Adam Steele is back for another guest post. You can view all of Adam’s posts here. As always, we thank him for contributing.
Earlier this month, I introduced a new stat called Surplus Yards and applied it to the 2017 season. If you haven’t read that post, consider that required background reading.
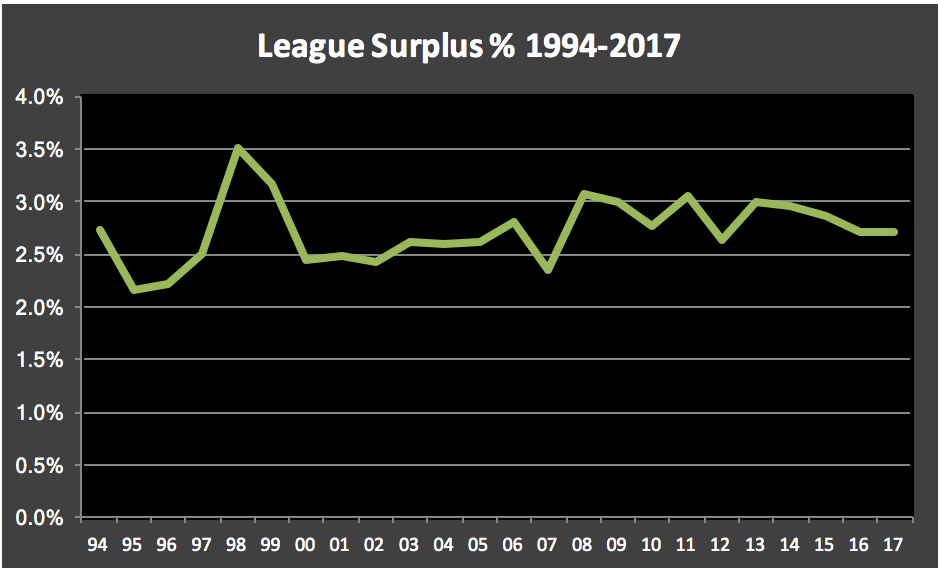
Since then, I calculated and archived every 40+ yard completion since 1994. The chart below shows the league average Surplus % for each of the last 24 seasons:
The overall average from 1994-2017 is 2.7%, but the trend line begs some interesting questions. Why did Surplus % bottom out in 1995-96 then rocket upward in 1998-99? Why did it spike again in 2008 then plateau for the next decade? Neither of the spikes coincided with rule changes, so I’m guessing the causes were a combination of strategy, personnel, and plain old randomness. If you have any explanations to offer, please share them in the comments!
With that macro level stuff out of the way, let’s take a look at the data for individual QB seasons. Below is a mega-chart displaying every qualifying season (224+ attempts) since 1994. In addition to the three variants of Surplus Yardage, I included the number of big pass plays (40+ yards) plus air yards and YAC per completion. There will be a follow up study detailing the relationship of air yards and YAC with Surplus Yards, but in the meantime maybe you guys can help pick out some trends that I’ve overlooked.
Quarterback | Team | Year | Surp % | Surp Y/A | Surplus | Big | Air/C | YAC/C | Att | Yards |
---|---|---|---|---|---|---|---|---|---|---|
Eli Manning | NYG | 2011 | 6.6% | 0.55 | 326 | 18 | 7.68 | 6.06 | 589 | 4933 |
Kurt Warner | STL | 2000 | 8.9% | 0.88 | 306 | 14 | 7.84 | 6.75 | 347 | 3429 |
Drew Brees | NOR | 2008 | 5.6% | 0.45 | 286 | 16 | 6.47 | 5.81 | 635 | 5069 |
Aaron Rodgers | GNB | 2011 | 5.9% | 0.55 | 274 | 13 | 7.23 | 6.31 | 502 | 4643 |
Drew Brees | NOR | 2006 | 6.1% | 0.49 | 269 | 18 | 6.54 | 5.87 | 554 | 4418 |
Aaron Rodgers | GNB | 2014 | 6% | 0.5 | 261 | 15 | 6.42 | 6.43 | 520 | 4381 |
Aaron Rodgers | GNB | 2009 | 5.9% | 0.48 | 260 | 17 | 6.49 | 6.18 | 541 | 4434 |
Steve Young | SFO | 1998 | 5.9% | 0.48 | 248 | 13 | 7.08 | 5.87 | 517 | 4170 |
Eli Manning | NYG | 2015 | 5.5% | 0.39 | 242 | 16 | 6.04 | 5.41 | 618 | 4436 |
Alex Smith | KAN | 2017 | 5.8% | 0.47 | 236 | 13 | 5.92 | 5.9 | 505 | 4042 |
Josh Freeman | TAM | 2012 | 5.7% | 0.42 | 233 | 16 | 7.47 | 5.81 | 558 | 4065 |
Peyton Manning | DEN | 2013 | 4.2% | 0.35 | 230 | 13 | 6.21 | 5.96 | 659 | 5477 |
Tony Romo | DAL | 2009 | 5.1% | 0.42 | 230 | 17 | 6.18 | 6.74 | 550 | 4483 |
Jared Goff | LAR | 2017 | 6% | 0.48 | 230 | 12 | 5.97 | 6.89 | 477 | 3804 |
Donovan McNabb | PHI | 2004 | 5.9% | 0.48 | 227 | 20 | 7.07 | 5.85 | 469 | 3875 |
Brett Favre | GNB | 2007 | 5.4% | 0.42 | 224 | 16 | 5.69 | 5.99 | 535 | 4155 |
Michael Vick | PHI | 2010 | 7.2% | 0.58 | 216 | 12 | 6.7 | 6.25 | 372 | 3018 |
Matt Ryan | ATL | 2016 | 4.3% | 0.4 | 212 | 17 | 6.88 | 6.37 | 534 | 4944 |
Brett Favre | GNB | 1998 | 4.9% | 0.38 | 208 | 9 | 6.66 | 5.48 | 551 | 4212 |
Trent Green | KAN | 2002 | 5.6% | 0.44 | 208 | 13 | 6.53 | 6.33 | 470 | 3690 |
Kirk Cousins | WAS | 2016 | 4.2% | 0.34 | 205 | 13 | 7.24 | 4.87 | 606 | 4917 |
Drew Brees | SDG | 2004 | 6.5% | 0.51 | 205 | 9 | 6.87 | 5.19 | 400 | 3159 |
Drew Brees | NOR | 2015 | 4.2% | 0.32 | 203 | 13 | 5.76 | 5.62 | 627 | 4870 |
Ben Roethlisberger | PIT | 2015 | 5.2% | 0.43 | 203 | 17 | 7.74 | 4.61 | 469 | 3933 |
Andrew Luck | IND | 2014 | 4.2% | 0.32 | 199 | 15 | 6.57 | 5.96 | 616 | 4761 |
Daunte Culpepper | MIN | 2004 | 4.2% | 0.36 | 199 | 18 | 6.18 | 6.27 | 548 | 4717 |
Jake Delhomme | CAR | 2005 | 5.8% | 0.46 | 198 | 13 | 6.6 | 6.46 | 435 | 3421 |
Tom Brady | NWE | 2011 | 3.7% | 0.32 | 196 | 14 | 6.31 | 6.74 | 611 | 5235 |
Donovan McNabb | PHI | 2006 | 7.4% | 0.62 | 196 | 14 | 6.94 | 7.76 | 316 | 2647 |
Tony Romo | DAL | 2008 | 5.7% | 0.43 | 195 | 12 | 6.78 | 5.72 | 450 | 3448 |
Blake Bortles | JAX | 2015 | 4.4% | 0.32 | 194 | 11 | 7.46 | 5.01 | 606 | 4428 |
Aaron Rodgers | GNB | 2008 | 4.8% | 0.36 | 193 | 16 | 7 | 4.84 | 536 | 4038 |
Ben Roethlisberger | PIT | 2014 | 3.9% | 0.31 | 191 | 15 | 6.32 | 5.81 | 608 | 4952 |
Tony Romo | DAL | 2011 | 4.6% | 0.37 | 191 | 11 | 6.27 | 5.83 | 522 | 4184 |
Matthew Stafford | DET | 2013 | 4.1% | 0.3 | 190 | 10 | 6.09 | 6.45 | 634 | 4650 |
Randall Cunningham | MIN | 1998 | 5.1% | 0.45 | 190 | 19 | 8.72 | 5.58 | 425 | 3704 |
Brad Johnson | TAM | 2003 | 5% | 0.33 | 189 | 9 | 6.22 | 4.54 | 570 | 3811 |
Tony Banks | BAL | 1999 | 8.8% | 0.59 | 189 | 9 | 7.06 | 5.58 | 320 | 2136 |
Drew Brees | NOR | 2016 | 3.6% | 0.28 | 188 | 10 | 5.94 | 5.12 | 673 | 5208 |
Donovan McNabb | WAS | 2010 | 5.5% | 0.4 | 187 | 11 | 6.04 | 6.24 | 472 | 3377 |
Matt Schaub | HOU | 2011 | 7.5% | 0.64 | 186 | 9 | 6.82 | 7.11 | 292 | 2479 |
J.P. Losman | BUF | 2006 | 6.1% | 0.43 | 185 | 10 | 6.36 | 5.02 | 429 | 3051 |
Doug Flutie | BUF | 1998 | 6.8% | 0.52 | 184 | 8 | 7.83 | 4.67 | 354 | 2711 |
Drew Brees | NOR | 2013 | 3.5% | 0.28 | 183 | 15 | 5.8 | 5.78 | 650 | 5162 |
Eli Manning | NYG | 2009 | 4.6% | 0.36 | 183 | 12 | 7.05 | 5.63 | 509 | 4021 |
Warren Moon | MIN | 1995 | 4.3% | 0.3 | 182 | 12 | 6.39 | 4.83 | 606 | 4228 |
Donovan McNabb | PHI | 2009 | 5.1% | 0.41 | 180 | 17 | 6.76 | 6.54 | 443 | 3553 |
Tom Brady | NWE | 2009 | 4.1% | 0.32 | 179 | 12 | 6.05 | 5.81 | 565 | 4398 |
Carson Palmer | CIN | 2006 | 4.4% | 0.34 | 178 | 15 | 7.73 | 4.73 | 520 | 4035 |
Kurt Warner | STL | 1999 | 4.1% | 0.36 | 178 | 16 | 6.85 | 6.55 | 499 | 4353 |
Philip Rivers | SDG | 2009 | 4.2% | 0.36 | 177 | 12 | 6.96 | 6.46 | 486 | 4254 |
Joe Flacco | BAL | 2016 | 4.1% | 0.26 | 175 | 11 | 5.03 | 4.87 | 672 | 4317 |
Elvis Grbac | KAN | 1999 | 5.2% | 0.35 | 175 | 6 | 6.62 | 4.9 | 499 | 3389 |
Chris Chandler | ATL | 1998 | 5.5% | 0.53 | 173 | 11 | 9.78 | 6.82 | 327 | 3154 |
Troy Aikman | DAL | 1999 | 5.7% | 0.38 | 170 | 7 | 6.18 | 5.09 | 442 | 2964 |
Ryan Tannehill | MIA | 2016 | 5.6% | 0.43 | 169 | 11 | 5.75 | 5.72 | 389 | 2995 |
Drew Bledsoe | NWE | 1998 | 4.6% | 0.35 | 168 | 14 | 9.05 | 4.77 | 481 | 3633 |
Jeff Blake | CIN | 1994 | 7.7% | 0.54 | 166 | 9 | 7.31 | 6.5 | 306 | 2154 |
Kurt Warner | ARI | 2008 | 3.6% | 0.28 | 165 | 12 | 6.01 | 5.42 | 598 | 4583 |
Carson Palmer | OAK | 2012 | 4.1% | 0.29 | 165 | 10 | 5.59 | 6.05 | 565 | 4018 |
Andy Dalton | CIN | 2017 | 5% | 0.33 | 165 | 9 | 5.34 | 5.84 | 496 | 3320 |
Tom Brady | NWE | 2016 | 4.6% | 0.38 | 165 | 8 | 6.19 | 6.02 | 432 | 3554 |
Chris Chandler | ATL | 2001 | 5.8% | 0.45 | 165 | 9 | 7.09 | 5.68 | 365 | 2847 |
Ben Roethlisberger | PIT | 2017 | 3.9% | 0.29 | 164 | 14 | 6.03 | 5.78 | 561 | 4251 |
Drew Brees | NOR | 2009 | 3.7% | 0.32 | 164 | 11 | 6.47 | 5.62 | 514 | 4388 |
Cam Newton | CAR | 2012 | 4.2% | 0.34 | 164 | 11 | 7.22 | 6.6 | 485 | 3869 |
Aaron Rodgers | GNB | 2010 | 4.2% | 0.35 | 164 | 10 | 6.55 | 6.02 | 475 | 3922 |
Tom Brady | NWE | 2007 | 3.4% | 0.28 | 163 | 15 | 7 | 5.07 | 578 | 4806 |
Joe Flacco | BAL | 2013 | 4.1% | 0.26 | 162 | 14 | 5.62 | 5.18 | 614 | 3912 |
Andy Dalton | CIN | 2016 | 3.9% | 0.29 | 162 | 13 | 6.38 | 5.17 | 563 | 4206 |
Carson Palmer | ARI | 2015 | 3.4% | 0.3 | 161 | 15 | 8.47 | 5.19 | 537 | 4671 |
Ben Roethlisberger | PIT | 2011 | 3.9% | 0.31 | 161 | 9 | 6.79 | 5.8 | 513 | 4077 |
Matthew Stafford | DET | 2016 | 3.7% | 0.27 | 160 | 10 | 5.41 | 5.74 | 594 | 4327 |
Jeff George | MIN | 1999 | 5.7% | 0.49 | 160 | 8 | 9.36 | 5.38 | 329 | 2816 |
John Elway | DEN | 1997 | 4.4% | 0.32 | 159 | 9 | 7.73 | 5.25 | 502 | 3635 |
Brad Johnson | WAS | 1999 | 3.9% | 0.3 | 158 | 14 | 6.97 | 5.71 | 519 | 4005 |
Matt Hasselbeck | TEN | 2011 | 4.4% | 0.31 | 158 | 10 | 5.39 | 5.81 | 518 | 3571 |
Jeff George | OAK | 1997 | 4% | 0.3 | 157 | 11 | 8.17 | 5.34 | 521 | 3917 |
Peyton Manning | IND | 2004 | 3.4% | 0.32 | 157 | 13 | 8.43 | 5.13 | 497 | 4557 |
Andy Dalton | CIN | 2014 | 4.6% | 0.33 | 157 | 7 | 5.11 | 5.89 | 481 | 3398 |
Tom Brady | NWE | 2015 | 3.3% | 0.25 | 156 | 12 | 5.9 | 5.97 | 624 | 4770 |
Matt Schaub | HOU | 2009 | 3.3% | 0.27 | 156 | 15 | 6.44 | 5.61 | 583 | 4770 |
Cam Newton | CAR | 2011 | 3.9% | 0.3 | 156 | 9 | 6.73 | 6.34 | 517 | 4051 |
Brian Griese | DEN | 1999 | 5.1% | 0.35 | 156 | 6 | 6.72 | 4.9 | 452 | 3032 |
Matt Ryan | ATL | 2008 | 4.5% | 0.36 | 156 | 9 | 7.68 | 5.3 | 434 | 3440 |
Andy Dalton | CIN | 2013 | 3.6% | 0.26 | 155 | 15 | 5.88 | 5.95 | 586 | 4293 |
Drew Bledsoe | DAL | 2005 | 4.3% | 0.31 | 155 | 9 | 7.4 | 4.73 | 499 | 3639 |
Matthew Stafford | DET | 2014 | 3.6% | 0.26 | 154 | 11 | 5.45 | 6.28 | 602 | 4257 |
Stan Humphries | SDG | 1994 | 4.8% | 0.34 | 154 | 9 | 7.23 | 4.92 | 453 | 3209 |
Carson Palmer | ARI | 2013 | 3.6% | 0.27 | 153 | 9 | 6.69 | 5.12 | 572 | 4274 |
Peyton Manning | IND | 2009 | 3.4% | 0.27 | 153 | 8 | 6.13 | 5.32 | 571 | 4500 |
Tony Banks | STL | 1997 | 4.7% | 0.31 | 153 | 11 | 7.12 | 5.8 | 487 | 3254 |
Robert Griffin | WAS | 2012 | 4.8% | 0.39 | 153 | 6 | 7.15 | 5.23 | 393 | 3200 |
Drew Bledsoe | NWE | 1997 | 4.1% | 0.29 | 152 | 12 | 6.88 | 4.92 | 522 | 3706 |
Jake Plummer | DEN | 2004 | 3.7% | 0.29 | 152 | 9 | 7.79 | 5.71 | 521 | 4089 |
Drew Bledsoe | BUF | 2002 | 3.5% | 0.25 | 151 | 13 | 6.71 | 4.91 | 610 | 4359 |
Matthew Stafford | DET | 2011 | 3% | 0.23 | 150 | 16 | 6.27 | 5.7 | 663 | 5038 |
Steve Beuerlein | CAR | 1999 | 3.4% | 0.26 | 150 | 9 | 7.2 | 5.73 | 571 | 4436 |
Russell Wilson | SEA | 2017 | 3.8% | 0.27 | 150 | 12 | 6.84 | 4.91 | 553 | 3983 |
Brett Favre | GNB | 1996 | 3.8% | 0.28 | 150 | 11 | 6.67 | 5.33 | 543 | 3899 |
Kyle Orton | DEN | 2009 | 3.9% | 0.28 | 150 | 9 | 5.17 | 6.15 | 541 | 3802 |
Jon Kitna | CIN | 2003 | 4.2% | 0.29 | 150 | 11 | 6.68 | 4.4 | 520 | 3591 |
Philip Rivers | SDG | 2008 | 3.7% | 0.31 | 150 | 12 | 6.95 | 5.9 | 478 | 4009 |
Gus Frerotte | MIN | 2008 | 7% | 0.5 | 150 | 8 | 6.37 | 5.75 | 301 | 2157 |
Drew Bledsoe | NWE | 1999 | 3.7% | 0.28 | 149 | 13 | 7.18 | 5.89 | 539 | 3985 |
Kevin Kolb | ARI | 2011 | 7.6% | 0.59 | 149 | 8 | 6.8 | 6.59 | 253 | 1955 |
Daunte Culpepper | MIN | 2000 | 3.7% | 0.31 | 146 | 12 | 8.82 | 4.43 | 474 | 3937 |
Jacoby Brissett | IND | 2017 | 4.7% | 0.31 | 146 | 9 | 5.41 | 5.82 | 469 | 3098 |
Matt Ryan | ATL | 2012 | 3.1% | 0.23 | 144 | 10 | 6.05 | 5.14 | 615 | 4719 |
Jake Plummer | ARI | 2001 | 3.9% | 0.27 | 144 | 11 | 7.03 | 4.98 | 525 | 3653 |
Randall Cunningham | PHI | 1994 | 4.5% | 0.29 | 144 | 9 | 6.96 | 5.22 | 490 | 3229 |
Philip Rivers | SDG | 2016 | 3.3% | 0.25 | 143 | 16 | 6.53 | 6.04 | 578 | 4386 |
Eli Manning | NYG | 2010 | 3.6% | 0.27 | 143 | 8 | 6.95 | 4.85 | 539 | 4002 |
Derek Carr | OAK | 2017 | 4.1% | 0.28 | 143 | 9 | 5.72 | 5.1 | 515 | 3496 |
Jason Campbell | OAK | 2010 | 6% | 0.43 | 143 | 8 | 5.3 | 7 | 329 | 2387 |
Aaron Rodgers | GNB | 2013 | 5.6% | 0.49 | 143 | 7 | 6.28 | 6.85 | 290 | 2536 |
Peyton Manning | IND | 2003 | 3.3% | 0.25 | 142 | 9 | 6.36 | 4.89 | 566 | 4267 |
Carson Wentz | PHI | 2017 | 4.3% | 0.32 | 142 | 9 | 7.54 | 4.9 | 440 | 3296 |
Trent Dilfer | CLE | 2005 | 6.1% | 0.43 | 142 | 7 | 5.98 | 5.68 | 333 | 2321 |
Matthew Stafford | DET | 2017 | 3.2% | 0.25 | 141 | 16 | 6.12 | 5.87 | 565 | 4446 |
Trent Green | KAN | 2004 | 3.1% | 0.25 | 141 | 9 | 7.09 | 5.35 | 556 | 4591 |
Jeff George | ATL | 1994 | 3.8% | 0.27 | 141 | 7 | 6.83 | 4.77 | 524 | 3734 |
Jay Cutler | CHI | 2015 | 3.9% | 0.29 | 141 | 10 | 6.71 | 5.53 | 483 | 3659 |
Tony Banks | STL | 1996 | 5.5% | 0.38 | 141 | 9 | 8.32 | 4.93 | 368 | 2544 |
Matt Ryan | ATL | 2013 | 3.1% | 0.22 | 140 | 9 | 5.1 | 5.18 | 651 | 4515 |
Tony Romo | DAL | 2012 | 2.9% | 0.22 | 140 | 9 | 6.75 | 4.78 | 648 | 4903 |
Donovan McNabb | PHI | 2008 | 3.6% | 0.25 | 140 | 11 | 6.12 | 5.23 | 571 | 3916 |
Peyton Manning | IND | 2000 | 3.2% | 0.25 | 140 | 8 | 7.94 | 4.42 | 571 | 4413 |
Tony Romo | DAL | 2013 | 3.6% | 0.26 | 139 | 7 | 5.81 | 5.38 | 535 | 3828 |
Erik Kramer | CHI | 1995 | 3.6% | 0.27 | 139 | 13 | 7.08 | 5.1 | 522 | 3838 |
Tyrod Taylor | BUF | 2016 | 4.6% | 0.32 | 138 | 7 | 6.96 | 4.28 | 436 | 3023 |
Jeff Blake | CIN | 1995 | 3.6% | 0.24 | 137 | 10 | 6.79 | 4.72 | 567 | 3822 |
Eli Manning | NYG | 2016 | 3.4% | 0.23 | 136 | 11 | 5.29 | 5.39 | 598 | 4027 |
Philip Rivers | SDG | 2010 | 2.9% | 0.25 | 136 | 14 | 6.6 | 6.6 | 541 | 4710 |
Eli Manning | NYG | 2012 | 3.4% | 0.25 | 136 | 10 | 7.75 | 4.55 | 536 | 3948 |
Brian Hoyer | CLE | 2014 | 4.1% | 0.31 | 136 | 10 | 7.84 | 5.9 | 438 | 3326 |
Jeff Garcia | SFO | 2000 | 3.2% | 0.24 | 135 | 9 | 6.37 | 5.68 | 561 | 4278 |
Aaron Brooks | NOR | 2002 | 3.8% | 0.26 | 135 | 12 | 7.25 | 5.37 | 528 | 3572 |
Dak Prescott | DAL | 2017 | 4.1% | 0.28 | 135 | 8 | 6.14 | 4.65 | 490 | 3324 |
Eli Manning | NYG | 2014 | 3% | 0.22 | 134 | 10 | 6.24 | 5.39 | 601 | 4410 |
Sam Bradford | STL | 2012 | 3.6% | 0.24 | 134 | 8 | 6.23 | 5.06 | 551 | 3702 |
Sam Bradford | PHI | 2015 | 3.6% | 0.25 | 134 | 14 | 4.85 | 5.92 | 532 | 3725 |
Cam Newton | CAR | 2016 | 3.8% | 0.26 | 134 | 8 | 8 | 5 | 510 | 3509 |
Jeff Garcia | CLE | 2004 | 7.7% | 0.53 | 134 | 8 | 6.69 | 5.33 | 252 | 1731 |
Vinny Testaverde | BAL | 1996 | 3.2% | 0.24 | 133 | 9 | 7.32 | 5.53 | 549 | 4177 |
Peyton Manning | IND | 2001 | 3.2% | 0.24 | 133 | 11 | 6.81 | 5.23 | 547 | 4131 |
Trent Dilfer | TAM | 1998 | 4.9% | 0.31 | 133 | 9 | 7.52 | 4.6 | 429 | 2729 |
Craig Erickson | TAM | 1994 | 4.6% | 0.33 | 133 | 12 | 8.25 | 4.72 | 399 | 2919 |
Trent Green | KAN | 2001 | 3.5% | 0.25 | 132 | 12 | 7.27 | 5.51 | 523 | 3783 |
Matt Hasselbeck | SEA | 2010 | 4.4% | 0.3 | 132 | 10 | 6.23 | 5.06 | 444 | 3001 |
Kerry Collins | CAR | 1995 | 4.9% | 0.3 | 132 | 8 | 6.76 | 5.93 | 433 | 2717 |
Philip Rivers | SDG | 2015 | 2.7% | 0.2 | 130 | 8 | 4.84 | 6.13 | 661 | 4792 |
Tony Romo | DAL | 2014 | 3.5% | 0.3 | 130 | 10 | 6.68 | 5.51 | 435 | 3705 |
Jay Cutler | CHI | 2010 | 4% | 0.3 | 130 | 6 | 6.7 | 5.84 | 432 | 3274 |
Drew Brees | NOR | 2011 | 2.4% | 0.2 | 129 | 11 | 6.34 | 5.37 | 657 | 5476 |
Brett Favre | GNB | 2006 | 3.3% | 0.21 | 129 | 7 | 5.14 | 6.18 | 613 | 3885 |
Jim Kelly | BUF | 1995 | 4.1% | 0.28 | 129 | 11 | 7.25 | 5.03 | 458 | 3130 |
Russell Wilson | SEA | 2014 | 3.7% | 0.29 | 129 | 8 | 5.32 | 6.88 | 452 | 3475 |
Kerry Collins | 2TM | 1998 | 5.8% | 0.37 | 129 | 6 | 8.12 | 4.89 | 353 | 2213 |
Kirk Cousins | WAS | 2015 | 3.1% | 0.24 | 128 | 8 | 5.96 | 5.03 | 543 | 4166 |
Steve Young | SFO | 1994 | 3.2% | 0.28 | 128 | 8 | 6.11 | 6.14 | 461 | 3969 |
Alex Smith | SFO | 2006 | 4.4% | 0.29 | 127 | 8 | 5.47 | 5.78 | 442 | 2890 |
Vinny Testaverde | NYJ | 1998 | 3.9% | 0.3 | 127 | 6 | 6.66 | 5.91 | 421 | 3256 |
Jay Cutler | DEN | 2008 | 2.8% | 0.2 | 126 | 7 | 6.89 | 4.9 | 616 | 4526 |
Philip Rivers | LAC | 2017 | 2.8% | 0.22 | 126 | 11 | 6.36 | 6.18 | 575 | 4515 |
Brett Favre | GNB | 2004 | 3.1% | 0.23 | 126 | 12 | 7.33 | 4.49 | 540 | 4088 |
Peyton Manning | IND | 2005 | 3.4% | 0.28 | 126 | 6 | 7.57 | 4.71 | 453 | 3747 |
Matt Ryan | ATL | 2011 | 3% | 0.22 | 125 | 10 | 6.89 | 5.14 | 566 | 4177 |
Donovan McNabb | PHI | 2005 | 5% | 0.35 | 125 | 6 | 6.07 | 5.81 | 357 | 2507 |
Tom Brady | NWE | 2003 | 3.4% | 0.24 | 124 | 8 | 6.31 | 5.11 | 527 | 3620 |
Ben Roethlisberger | PIT | 2005 | 5.2% | 0.46 | 124 | 12 | 8.33 | 5.86 | 268 | 2385 |
Chad Henne | JAX | 2012 | 5.9% | 0.4 | 123 | 5 | 7.12 | 5.43 | 308 | 2084 |
Tom Brady | NWE | 2012 | 2.5% | 0.19 | 122 | 8 | 6.22 | 5.82 | 637 | 4827 |
Carson Palmer | CIN | 2010 | 3.1% | 0.21 | 122 | 9 | 6.27 | 4.7 | 586 | 3970 |
Peyton Manning | IND | 1999 | 3% | 0.23 | 122 | 11 | 7.18 | 5.32 | 533 | 4135 |
Brett Favre | GNB | 2001 | 3.1% | 0.24 | 122 | 13 | 6.54 | 5.95 | 510 | 3921 |
Derek Carr | OAK | 2016 | 3.1% | 0.22 | 121 | 8 | 5.78 | 5.25 | 560 | 3937 |
Mark Brunell | JAX | 1996 | 2.8% | 0.22 | 121 | 13 | 8.17 | 4.2 | 557 | 4367 |
Aaron Rodgers | GNB | 2012 | 2.8% | 0.22 | 121 | 9 | 5.82 | 5.75 | 552 | 4295 |
Brett Favre | MIN | 2009 | 2.9% | 0.23 | 121 | 13 | 5.99 | 5.59 | 531 | 4202 |
Chad Pennington | MIA | 2008 | 3.3% | 0.25 | 121 | 8 | 6.56 | 4.82 | 476 | 3653 |
Carson Palmer | CIN | 2004 | 4.2% | 0.28 | 121 | 8 | 7.26 | 3.76 | 432 | 2897 |
Russell Wilson | SEA | 2013 | 3.6% | 0.3 | 121 | 10 | 7.02 | 6.04 | 407 | 3357 |
Jim Everett | NOR | 1994 | 3.1% | 0.22 | 120 | 5 | 6.14 | 5.01 | 540 | 3855 |
Scott Mitchell | DET | 1997 | 3.4% | 0.24 | 120 | 8 | 7.66 | 4.23 | 509 | 3484 |
Donovan McNabb | PHI | 2001 | 3.7% | 0.24 | 120 | 9 | 5.66 | 5.68 | 493 | 3233 |
Jeff Hostetler | RAI | 1994 | 3.6% | 0.26 | 120 | 7 | 7.8 | 4.87 | 455 | 3334 |
Vinny Testaverde | CLE | 1994 | 4.7% | 0.32 | 120 | 7 | 5.75 | 6.69 | 376 | 2575 |
Drew Brees | NOR | 2012 | 2.3% | 0.18 | 119 | 13 | 6.89 | 5.37 | 670 | 5177 |
Mike Glennon | TAM | 2013 | 4.6% | 0.29 | 119 | 7 | 7.4 | 5.75 | 416 | 2608 |
Dan Marino | MIA | 1996 | 4.3% | 0.32 | 119 | 10 | 7.06 | 5.59 | 373 | 2795 |
Andrew Luck | IND | 2013 | 3.1% | 0.21 | 118 | 9 | 5.27 | 5.87 | 570 | 3822 |
Elvis Grbac | KAN | 2000 | 2.8% | 0.22 | 118 | 7 | 7.75 | 5.04 | 547 | 4169 |
Joe Flacco | BAL | 2008 | 3.9% | 0.27 | 117 | 10 | 5.98 | 5.58 | 428 | 2971 |
Jeff Blake | CIN | 1999 | 4.4% | 0.3 | 117 | 7 | 6.49 | 5.93 | 389 | 2670 |
Tony Banks | WAS | 2001 | 4.9% | 0.32 | 117 | 6 | 6.05 | 6 | 370 | 2386 |
Mark Brunell | JAX | 1998 | 4.5% | 0.33 | 117 | 8 | 7.99 | 5.43 | 354 | 2601 |
Byron Leftwich | JAX | 2003 | 4.1% | 0.28 | 116 | 7 | 6.88 | 4.92 | 418 | 2819 |
Tom Brady | NWE | 2005 | 2.8% | 0.22 | 115 | 9 | 6.6 | 5.7 | 530 | 4110 |
Andy Dalton | CIN | 2012 | 3.1% | 0.22 | 115 | 12 | 5.67 | 5.48 | 528 | 3669 |
Drew Bledsoe | BUF | 2004 | 3.9% | 0.26 | 115 | 8 | 6.91 | 4.54 | 450 | 2932 |
Kordell Stewart | PIT | 1997 | 3.8% | 0.26 | 115 | 10 | 7.86 | 4.94 | 440 | 3020 |
Brian Griese | DEN | 2002 | 3.6% | 0.26 | 115 | 7 | 6 | 5.04 | 436 | 3214 |
Colin Kaepernick | SFO | 2013 | 3.6% | 0.28 | 115 | 10 | 6.81 | 3.74 | 416 | 3197 |
Drew Brees | NOR | 2010 | 2.5% | 0.17 | 114 | 10 | 5.63 | 4.68 | 658 | 4620 |
Brett Favre | GNB | 1995 | 2.6% | 0.2 | 114 | 5 | 6.35 | 5.94 | 570 | 4413 |
Aaron Brooks | NOR | 2003 | 3.2% | 0.22 | 114 | 7 | 6.82 | 4.76 | 518 | 3546 |
Jeff Garcia | SFO | 2001 | 3.2% | 0.23 | 114 | 10 | 5.78 | 5.41 | 504 | 3538 |
Jake Plummer | ARI | 2000 | 3.9% | 0.24 | 114 | 10 | 6.15 | 4.76 | 475 | 2946 |
JaMarcus Russell | OAK | 2008 | 4.7% | 0.31 | 114 | 5 | 6.46 | 5.77 | 368 | 2423 |
Brett Favre | GNB | 1999 | 2.8% | 0.19 | 113 | 11 | 6.64 | 5.36 | 595 | 4091 |
Kerry Collins | OAK | 2005 | 3% | 0.2 | 113 | 6 | 7.94 | 4.5 | 565 | 3759 |
Peyton Manning | IND | 2008 | 2.8% | 0.2 | 113 | 7 | 6.4 | 4.39 | 555 | 4002 |
Andy Dalton | CIN | 2011 | 3.3% | 0.22 | 113 | 10 | 6.57 | 4.76 | 516 | 3398 |
Ben Roethlisberger | PIT | 2009 | 2.6% | 0.22 | 113 | 14 | 7.05 | 5.79 | 506 | 4328 |
Kerry Collins | NYG | 2003 | 3.6% | 0.23 | 113 | 7 | 6.66 | 4.29 | 500 | 3110 |
Donovan McNabb | PHI | 2007 | 3.4% | 0.24 | 113 | 10 | 6.06 | 5.36 | 473 | 3324 |
Cam Newton | CAR | 2015 | 2.9% | 0.23 | 112 | 10 | 8.01 | 4.96 | 495 | 3837 |
Trevor Siemian | DEN | 2016 | 3.3% | 0.23 | 112 | 8 | 6.75 | 5.02 | 486 | 3401 |
Ryan Leaf | SDG | 2000 | 5.9% | 0.35 | 112 | 5 | 7.25 | 4.45 | 322 | 1883 |
Aaron Rodgers | GNB | 2016 | 2.5% | 0.18 | 111 | 10 | 5.96 | 5.09 | 610 | 4428 |
Tom Brady | NWE | 2010 | 2.8% | 0.23 | 111 | 9 | 5.85 | 6.19 | 492 | 3900 |
Jim Kelly | BUF | 1996 | 4% | 0.29 | 111 | 7 | 7.82 | 4.84 | 379 | 2810 |
Carson Palmer | OAK | 2011 | 4% | 0.34 | 111 | 11 | 7.99 | 5.84 | 328 | 2753 |
Nick Foles | PHI | 2013 | 3.8% | 0.35 | 111 | 13 | 6.94 | 7.3 | 317 | 2891 |
Rich Gannon | OAK | 2002 | 2.3% | 0.18 | 110 | 8 | 5.57 | 5.65 | 618 | 4689 |
Eli Manning | NYG | 2005 | 2.9% | 0.2 | 110 | 8 | 7.62 | 5.18 | 557 | 3762 |
Eli Manning | NYG | 2013 | 2.9% | 0.2 | 110 | 7 | 7.16 | 4.88 | 551 | 3818 |
Peyton Manning | IND | 2007 | 2.7% | 0.21 | 110 | 9 | 7.41 | 4.58 | 515 | 4040 |
Colin Kaepernick | SFO | 2014 | 3.3% | 0.23 | 110 | 5 | 6.66 | 5 | 478 | 3369 |
Mark Brunell | WAS | 2005 | 3.6% | 0.24 | 110 | 9 | 5.9 | 5.74 | 454 | 3050 |
Andy Dalton | CIN | 2015 | 3.4% | 0.28 | 110 | 11 | 6.99 | 5.75 | 386 | 3250 |
Scott Mitchell | DET | 1995 | 2.5% | 0.19 | 109 | 10 | 7.83 | 4.71 | 583 | 4338 |
Joe Flacco | BAL | 2009 | 3% | 0.22 | 109 | 8 | 5.85 | 5.62 | 499 | 3613 |
Joe Flacco | BAL | 2010 | 3% | 0.22 | 109 | 7 | 6.42 | 5.42 | 489 | 3622 |
Jake Delhomme | CAR | 2008 | 3.3% | 0.26 | 109 | 9 | 8.21 | 5.16 | 414 | 3288 |
Nick Foles | PHI | 2014 | 5% | 0.35 | 109 | 7 | 5.99 | 5.63 | 311 | 2163 |
Curtis Painter | IND | 2011 | 7.1% | 0.45 | 109 | 5 | 5.58 | 6.1 | 243 | 1541 |
Aaron Brooks | NOR | 2001 | 2.8% | 0.19 | 108 | 13 | 6.81 | 5.47 | 558 | 3832 |
Brett Favre | GNB | 2002 | 3% | 0.2 | 108 | 7 | 5.98 | 4.75 | 551 | 3658 |
Kirk Cousins | WAS | 2017 | 2.6% | 0.2 | 108 | 9 | 5.47 | 6.33 | 540 | 4093 |
Ben Roethlisberger | PIT | 2012 | 3.3% | 0.24 | 108 | 6 | 5.99 | 5.5 | 449 | 3265 |
Tim Couch | CLE | 1999 | 4.4% | 0.27 | 108 | 6 | 6.04 | 4.93 | 399 | 2447 |
Matthew Stafford | DET | 2009 | 4.8% | 0.29 | 108 | 6 | 5.13 | 6.15 | 377 | 2267 |
Tom Brady | NWE | 2013 | 2.5% | 0.17 | 107 | 8 | 5.77 | 5.66 | 628 | 4343 |
Doug Flutie | SDG | 2001 | 3.1% | 0.21 | 107 | 4 | 7.02 | 4.76 | 521 | 3464 |
Matt Schaub | HOU | 2008 | 3.5% | 0.28 | 107 | 8 | 6.27 | 5.86 | 380 | 3043 |
Jeff Garcia | TAM | 2007 | 4.4% | 0.33 | 107 | 8 | 5.89 | 5.78 | 327 | 2440 |
Tony Romo | DAL | 2007 | 2.5% | 0.2 | 105 | 11 | 7.44 | 5.13 | 520 | 4211 |
Jason Campbell | WAS | 2009 | 2.9% | 0.21 | 104 | 8 | 4.46 | 6.61 | 507 | 3618 |
Ryan Fitzpatrick | HOU | 2014 | 4.2% | 0.33 | 104 | 8 | 6.88 | 5.73 | 312 | 2483 |
Charlie Batch | DET | 1998 | 4.8% | 0.34 | 104 | 5 | 7.71 | 4.88 | 303 | 2178 |
Gus Frerotte | DET | 1999 | 4.9% | 0.36 | 104 | 7 | 7.05 | 5.05 | 288 | 2117 |
Colin Kaepernick | SFO | 2015 | 6.4% | 0.43 | 104 | 7 | 6.49 | 3.34 | 244 | 1615 |
Drew Brees | NOR | 2014 | 2.1% | 0.16 | 103 | 10 | 5.99 | 4.87 | 659 | 4952 |
Trent Green | KAN | 2003 | 2.6% | 0.2 | 103 | 8 | 6.06 | 6.18 | 523 | 4039 |
Brandon Weeden | CLE | 2012 | 3% | 0.2 | 103 | 6 | 5.1 | 6.3 | 517 | 3385 |
Chad Pennington | NYJ | 2006 | 3.1% | 0.21 | 103 | 9 | 5.96 | 4.74 | 485 | 3352 |
Jake Plummer | DEN | 2005 | 3.1% | 0.23 | 103 | 8 | 6.49 | 5.66 | 456 | 3366 |
Tim Couch | CLE | 2002 | 3.6% | 0.23 | 103 | 8 | 6.18 | 4.23 | 443 | 2842 |
Seneca Wallace | SEA | 2008 | 6.7% | 0.43 | 103 | 5 | 5.51 | 5.35 | 242 | 1532 |
Andrew Luck | IND | 2016 | 2.4% | 0.19 | 102 | 8 | 7.39 | 4.87 | 545 | 4240 |
Matt Cassel | NWE | 2008 | 2.8% | 0.2 | 102 | 6 | 4.82 | 6.47 | 516 | 3693 |
Jon Kitna | DET | 2007 | 2.5% | 0.18 | 101 | 7 | 7.03 | 4.43 | 561 | 4068 |
John Elway | DEN | 1995 | 2.5% | 0.19 | 101 | 10 | 6.99 | 5.58 | 542 | 3970 |
Trent Green | KAN | 2005 | 2.5% | 0.2 | 101 | 11 | 7.01 | 5.66 | 507 | 4014 |
Ryan Fitzpatrick | BUF | 2012 | 3% | 0.2 | 101 | 7 | 4.95 | 6.16 | 505 | 3400 |
Erik Kramer | CHI | 1997 | 3.4% | 0.21 | 101 | 6 | 6.24 | 4.71 | 477 | 3011 |
Jim Harbaugh | SDG | 1999 | 3.7% | 0.23 | 101 | 10 | 6.29 | 4.8 | 434 | 2761 |
Michael Vick | PHI | 2011 | 3.1% | 0.24 | 101 | 6 | 7.35 | 5.71 | 423 | 3303 |
David Carr | HOU | 2003 | 5% | 0.34 | 101 | 5 | 5.86 | 6.19 | 295 | 2013 |
Cam Newton | CAR | 2013 | 3% | 0.21 | 100 | 7 | 5.63 | 5.95 | 473 | 3379 |
Peyton Manning | DEN | 2014 | 2.1% | 0.17 | 99 | 11 | 6.86 | 5.1 | 597 | 4727 |
Joe Flacco | BAL | 2014 | 2.5% | 0.18 | 99 | 7 | 6.31 | 5.28 | 554 | 3986 |
Trent Green | WAS | 1998 | 2.9% | 0.19 | 99 | 7 | 7.33 | 5.05 | 509 | 3441 |
Dak Prescott | DAL | 2016 | 2.7% | 0.22 | 99 | 8 | 6.86 | 4.93 | 459 | 3667 |
Steve McNair | TEN | 2001 | 3% | 0.23 | 99 | 10 | 8.72 | 3.97 | 431 | 3350 |
Matt Cassel | MIN | 2013 | 5.5% | 0.39 | 99 | 5 | 6.29 | 5.52 | 254 | 1807 |
Blake Bortles | JAX | 2017 | 2.7% | 0.19 | 98 | 7 | 5.45 | 6.25 | 523 | 3687 |
Carson Palmer | CIN | 2005 | 2.6% | 0.19 | 98 | 9 | 7.04 | 4.08 | 509 | 3836 |
Jake Delhomme | CAR | 2003 | 3% | 0.22 | 98 | 8 | 6.39 | 5.71 | 449 | 3219 |
Kerry Collins | NYG | 1999 | 4.2% | 0.3 | 98 | 4 | 6.51 | 5.69 | 331 | 2318 |
Carson Palmer | ARI | 2014 | 6% | 0.44 | 98 | 3 | 5.81 | 5.72 | 224 | 1626 |
Peyton Manning | IND | 1998 | 2.6% | 0.17 | 97 | 8 | 6.03 | 5.44 | 575 | 3739 |
Brett Favre | GNB | 1997 | 2.5% | 0.19 | 97 | 9 | 7.68 | 5.04 | 513 | 3867 |
John Elway | DEN | 1994 | 2.8% | 0.2 | 97 | 11 | 6.04 | 5.33 | 494 | 3490 |
Heath Shuler | WAS | 1994 | 5.9% | 0.37 | 97 | 5 | 8.43 | 5.39 | 265 | 1658 |
Matt Ryan | ATL | 2014 | 2% | 0.15 | 96 | 8 | 6.12 | 5.2 | 628 | 4694 |
Elvis Grbac | BAL | 2001 | 3.2% | 0.21 | 96 | 6 | 6.37 | 5.07 | 467 | 3033 |
Mike Tomczak | PIT | 1996 | 3.5% | 0.24 | 96 | 7 | 7.22 | 5.24 | 401 | 2767 |
Steve McNair | TEN | 2003 | 3% | 0.24 | 96 | 11 | 8.79 | 4.07 | 400 | 3215 |
Alex Van Pelt | BUF | 2001 | 4.7% | 0.31 | 96 | 6 | 5.78 | 5.77 | 307 | 2056 |
Rich Gannon | OAK | 2000 | 2.8% | 0.2 | 95 | 8 | 6.57 | 5.51 | 473 | 3430 |
Tyrod Taylor | BUF | 2015 | 3.1% | 0.25 | 95 | 11 | 7.84 | 4.7 | 380 | 3035 |
Jeff George | ATL | 1995 | 2.3% | 0.17 | 94 | 10 | 6.33 | 6 | 557 | 4143 |
Daunte Culpepper | MIN | 2002 | 2.4% | 0.17 | 94 | 9 | 6.67 | 4.9 | 549 | 3853 |
Derek Anderson | CLE | 2007 | 2.5% | 0.18 | 94 | 6 | 7.7 | 5.01 | 527 | 3787 |
Neil O'Donnell | CIN | 1998 | 4.2% | 0.27 | 94 | 8 | 6.87 | 5.23 | 343 | 2216 |
Jason Campbell | CLE | 2013 | 4.7% | 0.3 | 94 | 7 | 5.26 | 5.94 | 317 | 2015 |
Jim Harbaugh | BAL | 1998 | 5.1% | 0.32 | 94 | 7 | 6.69 | 4.52 | 293 | 1839 |
Ryan Tannehill | MIA | 2013 | 2.4% | 0.16 | 93 | 10 | 6.22 | 4.8 | 588 | 3913 |
Marcus Mariota | TEN | 2017 | 2.9% | 0.21 | 93 | 6 | 6.77 | 4.73 | 453 | 3232 |
Marc Bulger | STL | 2008 | 3.4% | 0.21 | 93 | 7 | 5.51 | 5.32 | 440 | 2720 |
Mark Brunell | JAX | 2002 | 3.3% | 0.22 | 93 | 6 | 5.93 | 5.45 | 416 | 2788 |
Derek Carr | OAK | 2015 | 2.3% | 0.16 | 92 | 10 | 6.11 | 5.29 | 573 | 3987 |
Jim Kelly | BUF | 1994 | 3% | 0.21 | 92 | 3 | 6.73 | 4.2 | 448 | 3114 |
Mark Brunell | WAS | 2006 | 5.1% | 0.35 | 92 | 5 | 4.56 | 6.49 | 260 | 1789 |
Andrew Luck | IND | 2012 | 2.1% | 0.15 | 91 | 11 | 7.8 | 5.1 | 627 | 4374 |
Ryan Tannehill | MIA | 2015 | 2.2% | 0.16 | 91 | 13 | 6.22 | 5.37 | 586 | 4208 |
Ben Roethlisberger | PIT | 2006 | 2.6% | 0.19 | 91 | 7 | 7.05 | 5.5 | 469 | 3513 |
Brad Johnson | TAM | 2002 | 3% | 0.2 | 91 | 6 | 5.69 | 5.16 | 451 | 3049 |
Kordell Stewart | PIT | 2001 | 2.9% | 0.21 | 91 | 6 | 7.06 | 4.63 | 442 | 3109 |
Charlie Frye | CLE | 2006 | 3.7% | 0.23 | 91 | 6 | 5.05 | 4.69 | 392 | 2454 |
Steve Young | SFO | 1997 | 3% | 0.26 | 91 | 4 | 5.84 | 6.73 | 356 | 3029 |
Michael Vick | ATL | 2004 | 3.9% | 0.28 | 91 | 8 | 7.29 | 5.49 | 321 | 2313 |
Tarvaris Jackson | MIN | 2007 | 4.8% | 0.31 | 91 | 4 | 6.09 | 5.08 | 294 | 1911 |
Matt Schaub | HOU | 2007 | 4.1% | 0.31 | 91 | 6 | 7.47 | 4.2 | 289 | 2241 |
Matt Hasselbeck | SEA | 2003 | 2.3% | 0.18 | 90 | 5 | 6.51 | 5.76 | 513 | 3841 |
Jay Cutler | DEN | 2007 | 2.6% | 0.19 | 90 | 7 | 6.34 | 5.43 | 467 | 3497 |
Tony Romo | DAL | 2006 | 3.1% | 0.27 | 90 | 9 | 8.41 | 4.79 | 337 | 2903 |
Peyton Manning | IND | 2010 | 1.9% | 0.13 | 89 | 9 | 5.99 | 4.45 | 679 | 4700 |
Mark Sanchez | NYJ | 2010 | 2.7% | 0.18 | 89 | 10 | 6.8 | 5.04 | 507 | 3291 |
Case Keenum | MIN | 2017 | 2.5% | 0.19 | 89 | 8 | 5.11 | 5.8 | 481 | 3547 |
Josh Freeman | TAM | 2010 | 2.6% | 0.19 | 89 | 10 | 6.24 | 5.62 | 474 | 3451 |
Jay Fiedler | MIA | 2001 | 2.7% | 0.2 | 89 | 7 | 6.71 | 5.34 | 450 | 3290 |
Michael Vick | ATL | 2002 | 3% | 0.21 | 89 | 8 | 7.79 | 4.92 | 421 | 2936 |
Joey Harrington | DET | 2005 | 4.4% | 0.27 | 89 | 6 | 5.83 | 4.92 | 330 | 2021 |
Carson Palmer | CIN | 2007 | 2.1% | 0.15 | 88 | 8 | 6.64 | 4.44 | 575 | 4131 |
Jim Everett | NOR | 1995 | 2.2% | 0.16 | 88 | 7 | 6.24 | 5.49 | 567 | 3970 |
Kerry Collins | OAK | 2004 | 2.5% | 0.17 | 88 | 8 | 7.13 | 4.96 | 513 | 3495 |
Nick Foles | STL | 2015 | 4.3% | 0.26 | 88 | 8 | 4.52 | 6.28 | 337 | 2052 |
Doug Johnson | ATL | 2003 | 5.3% | 0.36 | 88 | 7 | 5.77 | 6.4 | 243 | 1655 |
Warren Moon | MIN | 1994 | 2% | 0.14 | 87 | 8 | 6.53 | 4.96 | 601 | 4264 |
Ryan Fitzpatrick | BUF | 2011 | 2.3% | 0.15 | 87 | 8 | 5.2 | 5.65 | 569 | 3832 |
Todd Collins | BUF | 1997 | 3.7% | 0.22 | 87 | 9 | 6.38 | 4.63 | 391 | 2367 |
Derek Carr | OAK | 2014 | 2.6% | 0.14 | 86 | 6 | 4.91 | 4.49 | 599 | 3270 |
Russell Wilson | SEA | 2015 | 2.1% | 0.18 | 86 | 9 | 5.95 | 5.81 | 483 | 4024 |
Tommy Maddox | PIT | 2002 | 3% | 0.23 | 86 | 6 | 7.75 | 4.37 | 377 | 2836 |
Brandon Weeden | CLE | 2013 | 5% | 0.32 | 86 | 6 | 7.52 | 4.75 | 267 | 1731 |
Joe Flacco | BAL | 2011 | 2.4% | 0.16 | 85 | 7 | 5.96 | 5.61 | 542 | 3610 |
Alex Smith | KAN | 2015 | 2.4% | 0.18 | 85 | 10 | 4.93 | 6.42 | 470 | 3486 |
Russell Wilson | SEA | 2012 | 2.7% | 0.22 | 85 | 11 | 6.41 | 5.99 | 393 | 3118 |
Tom Brady | NWE | 2017 | 1.8% | 0.14 | 84 | 10 | 6.7 | 5.19 | 581 | 4577 |
Eli Manning | NYG | 2017 | 2.4% | 0.15 | 83 | 4 | 5.11 | 4.74 | 571 | 3468 |
Tarvaris Jackson | SEA | 2011 | 2.7% | 0.18 | 83 | 8 | 6.17 | 5.23 | 450 | 3091 |
Jon Kitna | SEA | 2000 | 3.1% | 0.2 | 83 | 4 | 4.81 | 5.45 | 418 | 2658 |
Rodney Peete | CAR | 2002 | 3.2% | 0.22 | 83 | 6 | 7.4 | 4.39 | 381 | 2630 |
Steve Beuerlein | CAR | 1998 | 3.2% | 0.24 | 83 | 7 | 6.79 | 3.67 | 343 | 2613 |
Jake Plummer | DEN | 2006 | 4.2% | 0.26 | 83 | 4 | 6.05 | 5.35 | 317 | 1994 |
Matthew Stafford | DET | 2012 | 1.7% | 0.11 | 82 | 9 | 6.45 | 4.97 | 727 | 4967 |
Jameis Winston | TAM | 2015 | 2% | 0.15 | 82 | 9 | 8.1 | 4.85 | 535 | 4042 |
Brad Johnson | WAS | 2000 | 3.3% | 0.22 | 82 | 7 | 5.63 | 5.36 | 365 | 2505 |
Michael Vick | PHI | 2012 | 3.5% | 0.23 | 82 | 4 | 6.25 | 5.33 | 351 | 2362 |
Matt Ryan | ATL | 2015 | 1.8% | 0.13 | 81 | 9 | 6.55 | 4.73 | 614 | 4591 |
Jeff Garcia | SFO | 2002 | 2.4% | 0.15 | 81 | 7 | 5.4 | 4.8 | 528 | 3344 |
Jake Locker | TEN | 2012 | 3.7% | 0.26 | 81 | 7 | 7.24 | 5.05 | 314 | 2176 |
Trent Green | STL | 2000 | 3.9% | 0.34 | 81 | 7 | 9.66 | 4.57 | 240 | 2063 |
Matt Schaub | HOU | 2012 | 2% | 0.15 | 80 | 8 | 6.09 | 5.37 | 544 | 4008 |
Troy Aikman | DAL | 1997 | 2.4% | 0.15 | 80 | 7 | 6.81 | 4.43 | 518 | 3283 |
Kyle Orton | DEN | 2010 | 2.2% | 0.16 | 80 | 11 | 7.09 | 5.38 | 498 | 3653 |
Matt Ryan | ATL | 2009 | 2.7% | 0.18 | 80 | 4 | 6.75 | 4.34 | 451 | 2916 |
David Carr | HOU | 2002 | 3.1% | 0.18 | 80 | 5 | 6.33 | 4.79 | 444 | 2592 |
Teddy Bridgewater | MIN | 2014 | 2.7% | 0.2 | 80 | 7 | 5.5 | 5.77 | 402 | 2919 |
Jim Miller | CHI | 2001 | 3.5% | 0.2 | 80 | 7 | 5.21 | 4.88 | 395 | 2299 |
Trent Dilfer | TAM | 1997 | 3.1% | 0.21 | 80 | 6 | 6.58 | 5.2 | 386 | 2555 |
Ryan Fitzpatrick | TEN | 2013 | 3.3% | 0.23 | 80 | 7 | 5.9 | 5.41 | 350 | 2454 |
Peyton Manning | DEN | 2015 | 3.6% | 0.24 | 80 | 7 | 6.43 | 4.92 | 331 | 2249 |
Ryan Fitzpatrick | BUF | 2009 | 5.6% | 0.35 | 80 | 4 | 5.91 | 5.28 | 227 | 1422 |
Kerry Collins | NYG | 2001 | 2.1% | 0.14 | 79 | 7 | 6.29 | 5.22 | 568 | 3764 |
Drew Brees | NOR | 2017 | 1.8% | 0.15 | 79 | 11 | 4.97 | 6.27 | 536 | 4338 |
David Garrard | JAX | 2009 | 2.2% | 0.15 | 79 | 6 | 6.64 | 4.81 | 516 | 3597 |
Mark Brunell | JAX | 1999 | 2.6% | 0.18 | 79 | 8 | 7.74 | 4.07 | 441 | 3060 |
Byron Leftwich | JAX | 2004 | 2.7% | 0.18 | 79 | 7 | 7.22 | 3.8 | 441 | 2941 |
Chris Miller | STL | 1995 | 3% | 0.2 | 79 | 4 | 6.46 | 4.84 | 405 | 2623 |
Chris Chandler | HOU | 1995 | 3.2% | 0.22 | 79 | 6 | 7.11 | 3.82 | 356 | 2460 |
Brad Johnson | MIN | 2005 | 4.2% | 0.27 | 79 | 6 | 5.29 | 4.96 | 294 | 1885 |
Peyton Manning | IND | 2002 | 1.9% | 0.13 | 78 | 11 | 6.42 | 4.3 | 591 | 4200 |
Jay Cutler | CHI | 2009 | 2.1% | 0.14 | 78 | 6 | 5.96 | 4.95 | 555 | 3666 |
Tim Couch | CLE | 2001 | 2.6% | 0.17 | 78 | 7 | 6.46 | 4.72 | 454 | 3040 |
Jeff Garcia | TAM | 2008 | 2.9% | 0.21 | 78 | 5 | 6 | 5.11 | 376 | 2712 |
Brad Johnson | MIN | 1996 | 3.5% | 0.25 | 78 | 6 | 5.85 | 5.73 | 311 | 2258 |
C.J. Beathard | SFO | 2017 | 5.5% | 0.35 | 78 | 6 | 6.11 | 5.52 | 224 | 1430 |
Marc Bulger | STL | 2006 | 1.8% | 0.13 | 77 | 10 | 6.36 | 5.26 | 588 | 4301 |
Aaron Rodgers | GNB | 2015 | 2% | 0.13 | 77 | 6 | 5.18 | 5.84 | 572 | 3821 |
Stan Humphries | SDG | 1997 | 5.2% | 0.34 | 77 | 4 | 6.83 | 5.46 | 225 | 1488 |
Gus Frerotte | MIA | 2005 | 2.5% | 0.15 | 76 | 8 | 6.48 | 5.18 | 494 | 2996 |
Chad Henne | MIA | 2009 | 2.6% | 0.17 | 76 | 4 | 5.8 | 4.7 | 451 | 2878 |
Troy Aikman | DAL | 1994 | 2.8% | 0.21 | 76 | 5 | 6.89 | 4.59 | 361 | 2676 |
Tom Brady | NWE | 2014 | 1.8% | 0.13 | 75 | 8 | 5.79 | 5.23 | 582 | 4109 |
Ryan Fitzpatrick | NYJ | 2015 | 1.9% | 0.13 | 75 | 9 | 6.34 | 5.32 | 562 | 3905 |
Dan Marino | MIA | 1995 | 2% | 0.16 | 75 | 6 | 6.71 | 5.17 | 482 | 3668 |
Drew Brees | NOR | 2007 | 1.7% | 0.11 | 74 | 8 | 5.25 | 4.8 | 652 | 4423 |
Philip Rivers | SDG | 2014 | 1.7% | 0.13 | 74 | 9 | 5.84 | 5.47 | 570 | 4286 |
Jay Cutler | CHI | 2014 | 1.9% | 0.13 | 74 | 8 | 4.43 | 5.88 | 561 | 3812 |
Joe Flacco | BAL | 2012 | 1.9% | 0.14 | 74 | 12 | 6.53 | 5.51 | 531 | 3817 |
Quincy Carter | DAL | 2003 | 2.2% | 0.15 | 74 | 7 | 6.55 | 4.75 | 505 | 3302 |
Steve McNair | BAL | 2006 | 2.4% | 0.16 | 74 | 3 | 5.84 | 4.5 | 468 | 3050 |
Jeff Hostetler | OAK | 1995 | 3.7% | 0.26 | 74 | 4 | 6.52 | 5.09 | 286 | 1998 |
Kerry Collins | TEN | 2010 | 4.1% | 0.27 | 74 | 4 | 7.61 | 3.79 | 278 | 1823 |
Dan Orlovsky | DET | 2008 | 4.6% | 0.29 | 74 | 2 | 6.74 | 4.56 | 255 | 1616 |
Kerry Collins | NYG | 2002 | 1.8% | 0.13 | 73 | 4 | 6.82 | 5.33 | 545 | 4073 |
Kyle Orton | BUF | 2014 | 2.4% | 0.16 | 73 | 7 | 4.96 | 5.56 | 447 | 3018 |
Gus Frerotte | WAS | 1995 | 2.7% | 0.18 | 73 | 8 | 8.64 | 5.18 | 396 | 2751 |
Carson Palmer | ARI | 2016 | 1.7% | 0.12 | 72 | 6 | 7.1 | 4.52 | 597 | 4233 |
Peyton Manning | DEN | 2012 | 1.5% | 0.12 | 72 | 8 | 6.66 | 4.99 | 583 | 4659 |
Jeff Blake | ARI | 2003 | 3.2% | 0.2 | 72 | 6 | 6.26 | 4.54 | 367 | 2247 |
Kurt Warner | STL | 2001 | 1.5% | 0.13 | 71 | 11 | 7.36 | 5.52 | 546 | 4830 |
Philip Rivers | SDG | 2013 | 1.6% | 0.13 | 71 | 6 | 5.83 | 6.02 | 544 | 4478 |
Mark Brunell | JAX | 1997 | 2.2% | 0.16 | 71 | 8 | 7.24 | 5.19 | 435 | 3281 |
Blaine Gabbert | JAX | 2011 | 3.2% | 0.17 | 71 | 4 | 4.92 | 5.62 | 413 | 2214 |
Geno Smith | NYJ | 2014 | 2.8% | 0.19 | 71 | 7 | 5.76 | 5.77 | 367 | 2525 |
Matt Hasselbeck | SEA | 2007 | 1.8% | 0.12 | 70 | 7 | 6.28 | 4.99 | 562 | 3966 |
Russell Wilson | SEA | 2016 | 1.7% | 0.13 | 70 | 11 | 6.92 | 5.03 | 546 | 4219 |
Mark Sanchez | PHI | 2014 | 2.9% | 0.23 | 70 | 6 | 6.09 | 6.13 | 309 | 2418 |
Jeff Blake | CIN | 1996 | 1.9% | 0.13 | 69 | 11 | 6.32 | 5.44 | 549 | 3624 |
Matt Ryan | ATL | 2017 | 1.7% | 0.13 | 69 | 8 | 6.34 | 5.64 | 529 | 4095 |
Donovan McNabb | PHI | 2003 | 2.1% | 0.14 | 69 | 9 | 6.01 | 5.69 | 478 | 3216 |
David Carr | HOU | 2004 | 2% | 0.15 | 69 | 6 | 6.56 | 5.82 | 466 | 3531 |
Daunte Culpepper | MIN | 2003 | 2% | 0.15 | 69 | 10 | 6.28 | 5.52 | 454 | 3479 |
Jeff Garcia | SFO | 2003 | 2.6% | 0.18 | 69 | 6 | 6.66 | 5.36 | 392 | 2704 |
Jeff Blake | BAL | 2002 | 3.3% | 0.23 | 69 | 5 | 7.27 | 5.36 | 295 | 2084 |
Damon Huard | KAN | 2006 | 3.7% | 0.28 | 69 | 5 | 7.06 | 5.63 | 244 | 1878 |
Brett Favre | GNB | 2000 | 1.8% | 0.12 | 68 | 7 | 6.09 | 5.19 | 580 | 3812 |
Donovan McNabb | PHI | 2000 | 2% | 0.12 | 68 | 5 | 5.11 | 5.09 | 569 | 3365 |
Matt Cassel | KAN | 2009 | 2.3% | 0.14 | 68 | 8 | 6.24 | 4.55 | 493 | 2924 |
Ben Roethlisberger | PIT | 2008 | 2.1% | 0.14 | 68 | 7 | 6.88 | 4.87 | 469 | 3301 |
Rick Mirer | SEA | 1995 | 2.7% | 0.17 | 68 | 7 | 7.1 | 5.17 | 391 | 2564 |
Mark Sanchez | NYJ | 2009 | 2.8% | 0.19 | 68 | 8 | 7.28 | 5.19 | 364 | 2444 |
Steve McNair | TEN | 1999 | 3.1% | 0.21 | 68 | 6 | 5.93 | 5.73 | 331 | 2179 |
Cade McNown | CHI | 2000 | 4.1% | 0.24 | 68 | 5 | 6.1 | 4.59 | 280 | 1646 |
Jake Plummer | ARI | 2002 | 2.3% | 0.13 | 67 | 3 | 6.18 | 4.29 | 530 | 2972 |
Mark Brunell | JAX | 2000 | 1.8% | 0.13 | 67 | 9 | 7.58 | 4.12 | 512 | 3640 |
Blake Bortles | JAX | 2014 | 2.3% | 0.14 | 67 | 6 | 4.45 | 5.94 | 475 | 2908 |
Troy Aikman | DAL | 1996 | 2.1% | 0.14 | 67 | 5 | 6.43 | 4.14 | 465 | 3126 |
Shaun King | TAM | 2000 | 2.4% | 0.16 | 67 | 5 | 7.08 | 4.81 | 428 | 2769 |
Michael Vick | ATL | 2006 | 2.7% | 0.17 | 67 | 8 | 7.7 | 4.43 | 388 | 2474 |
Matt Leinart | ARI | 2006 | 2.6% | 0.18 | 67 | 6 | 7.26 | 4.64 | 377 | 2547 |
David Garrard | JAX | 2010 | 2.5% | 0.18 | 67 | 5 | 6.41 | 5.18 | 366 | 2734 |
Chad Pennington | NYJ | 2003 | 3.1% | 0.23 | 67 | 6 | 6.23 | 5.09 | 297 | 2139 |
Brock Osweiler | DEN | 2015 | 3.4% | 0.24 | 67 | 4 | 6.16 | 5.41 | 275 | 1967 |
Erik Kramer | CHI | 1998 | 3.7% | 0.27 | 67 | 5 | 7.03 | 5.04 | 250 | 1823 |
Carson Wentz | PHI | 2016 | 1.7% | 0.11 | 66 | 6 | 5.15 | 4.83 | 607 | 3782 |
Peyton Manning | IND | 2006 | 1.5% | 0.12 | 66 | 7 | 7.98 | 4.17 | 557 | 4397 |
Warren Moon | SEA | 1997 | 1.8% | 0.13 | 66 | 9 | 6.75 | 5 | 528 | 3678 |
Steve Young | SFO | 1995 | 2.1% | 0.15 | 66 | 7 | 5.36 | 5.34 | 447 | 3200 |
Shaun Hill | DET | 2010 | 2.5% | 0.16 | 66 | 3 | 4.48 | 5.97 | 416 | 2686 |
Chris Chandler | ATL | 1997 | 2.5% | 0.19 | 66 | 8 | 7.96 | 5.37 | 342 | 2692 |
Derek Anderson | CLE | 2008 | 4.1% | 0.23 | 66 | 5 | 6.27 | 5.1 | 283 | 1615 |
Cade McNown | CHI | 1999 | 4.5% | 0.28 | 66 | 6 | 6.39 | 5.15 | 235 | 1465 |
Brett Favre | GNB | 2005 | 1.7% | 0.11 | 65 | 7 | 5.66 | 4.77 | 607 | 3881 |
Vinny Testaverde | NYJ | 2000 | 1.7% | 0.11 | 65 | 7 | 6.51 | 4.87 | 590 | 3732 |
Tom Brady | NWE | 2006 | 1.8% | 0.13 | 65 | 8 | 5.65 | 5.42 | 516 | 3529 |
Alex Smith | KAN | 2016 | 1.9% | 0.13 | 65 | 8 | 4.82 | 5.86 | 489 | 3502 |
Josh McCown | NYJ | 2017 | 2.2% | 0.16 | 65 | 7 | 6.02 | 4.94 | 397 | 2926 |
Alex Smith | SFO | 2010 | 2.7% | 0.19 | 64 | 7 | 5.16 | 6.46 | 342 | 2370 |
Terrelle Pryor | OAK | 2013 | 3.6% | 0.24 | 64 | 4 | 5.46 | 6.06 | 272 | 1798 |
Ben Roethlisberger | PIT | 2016 | 1.6% | 0.12 | 63 | 8 | 6.39 | 5.26 | 509 | 3819 |
Jeff Garcia | SFO | 1999 | 2.5% | 0.17 | 63 | 7 | 6.17 | 5.13 | 375 | 2544 |
JaMarcus Russell | OAK | 2009 | 4.9% | 0.26 | 63 | 2 | 5.48 | 5.24 | 246 | 1287 |
Rex Grossman | CHI | 2006 | 1.9% | 0.13 | 62 | 8 | 7.16 | 5.02 | 480 | 3193 |
Tom Brady | NWE | 2001 | 2.2% | 0.15 | 62 | 6 | 5.19 | 5.58 | 413 | 2843 |
Jay Cutler | CHI | 2013 | 2.4% | 0.17 | 62 | 8 | 7.13 | 4.57 | 355 | 2621 |
Rich Gannon | KAN | 1998 | 2.7% | 0.18 | 62 | 4 | 6.02 | 5.17 | 354 | 2305 |
Charlie Batch | DET | 2001 | 2.6% | 0.18 | 62 | 5 | 6.92 | 5.16 | 341 | 2392 |
Aaron Rodgers | GNB | 2017 | 3.7% | 0.26 | 62 | 4 | 5.07 | 5.81 | 238 | 1675 |
Dan Marino | MIA | 1994 | 1.4% | 0.1 | 61 | 7 | 6.86 | 4.7 | 615 | 4453 |
Ben Roethlisberger | PIT | 2013 | 1.4% | 0.1 | 61 | 10 | 5.49 | 5.87 | 584 | 4261 |
Philip Rivers | SDG | 2011 | 1.3% | 0.1 | 61 | 8 | 6.73 | 5.9 | 582 | 4624 |
Matt Schaub | HOU | 2010 | 1.4% | 0.11 | 61 | 9 | 6.12 | 5.85 | 574 | 4370 |
Jon Kitna | CIN | 2002 | 1.9% | 0.13 | 61 | 4 | 6.86 | 3.95 | 473 | 3178 |
Jake Delhomme | CAR | 2006 | 2.2% | 0.14 | 61 | 7 | 5.49 | 5.17 | 431 | 2805 |
Brian Griese | TAM | 2004 | 2.3% | 0.18 | 61 | 6 | 6 | 5.3 | 336 | 2632 |
Andrew Luck | IND | 2015 | 3.2% | 0.21 | 61 | 3 | 7.16 | 4.45 | 293 | 1881 |
Doug Pederson | PHI | 1999 | 4.8% | 0.27 | 61 | 2 | 5.24 | 5.49 | 227 | 1276 |
Joe Flacco | BAL | 2017 | 1.9% | 0.11 | 60 | 5 | 4.63 | 4.3 | 549 | 3141 |
Tom Brady | NWE | 2004 | 1.6% | 0.13 | 60 | 10 | 8.2 | 4.61 | 474 | 3692 |
Jay Cutler | CHI | 2012 | 2% | 0.14 | 60 | 5 | 6.96 | 4.93 | 434 | 3033 |
Jeff Hostetler | OAK | 1996 | 2.4% | 0.15 | 60 | 5 | 5.75 | 4.78 | 402 | 2548 |
Case Keenum | LAR | 2016 | 2.7% | 0.19 | 60 | 8 | 6.16 | 5.07 | 322 | 2201 |
Jake Plummer | ARI | 1997 | 2.7% | 0.2 | 60 | 7 | 9.13 | 4.9 | 296 | 2203 |
Trent Edwards | BUF | 2007 | 3.7% | 0.22 | 60 | 4 | 5.12 | 5.68 | 269 | 1630 |
Matthew Stafford | DET | 2015 | 1.4% | 0.1 | 59 | 8 | 4.67 | 6.04 | 592 | 4262 |
Eli Manning | NYG | 2006 | 1.8% | 0.11 | 59 | 8 | 6.19 | 4.59 | 522 | 3244 |
Alex Smith | KAN | 2013 | 1.8% | 0.12 | 59 | 6 | 4.8 | 5.96 | 508 | 3313 |
Steve Bono | KAN | 1996 | 2.3% | 0.13 | 59 | 4 | 5.42 | 5.53 | 438 | 2572 |
Drew Brees | SDG | 2003 | 2.8% | 0.17 | 59 | 5 | 4.52 | 5.76 | 356 | 2108 |
Dan Marino | MIA | 1998 | 1.7% | 0.11 | 58 | 6 | 6.61 | 4.67 | 537 | 3497 |
Ryan Tannehill | MIA | 2012 | 1.8% | 0.12 | 58 | 3 | 6.88 | 4.8 | 484 | 3294 |
Brad Johnson | MIN | 1997 | 1.9% | 0.13 | 58 | 7 | 6.36 | 4.68 | 452 | 3036 |
Tyler Thigpen | KAN | 2008 | 2.2% | 0.14 | 58 | 4 | 6.55 | 4.79 | 420 | 2608 |
Neil O'Donnell | PIT | 1995 | 2% | 0.14 | 58 | 4 | 7.07 | 5 | 416 | 2970 |
Ben Roethlisberger | PIT | 2010 | 1.8% | 0.15 | 58 | 8 | 7.38 | 5.95 | 389 | 3200 |
Chris Chandler | ATL | 1999 | 2.5% | 0.19 | 58 | 6 | 8.88 | 4.56 | 307 | 2339 |
Kellen Clemens | STL | 2013 | 3.5% | 0.24 | 58 | 2 | 6.4 | 5.38 | 242 | 1673 |
Matt Hasselbeck | SEA | 2006 | 2.3% | 0.15 | 57 | 5 | 7.76 | 3.87 | 371 | 2442 |
Troy Aikman | DAL | 1998 | 2.4% | 0.18 | 57 | 8 | 7.61 | 4.84 | 315 | 2330 |
Chad Henne | JAX | 2013 | 1.7% | 0.11 | 56 | 5 | 4.52 | 6.11 | 503 | 3241 |
Carson Palmer | CIN | 2009 | 1.8% | 0.12 | 56 | 5 | 6.33 | 4.64 | 466 | 3094 |
Colt McCoy | CLE | 2011 | 2% | 0.12 | 56 | 5 | 5.64 | 4.68 | 463 | 2733 |
Geno Smith | NYJ | 2013 | 1.8% | 0.13 | 56 | 6 | 7.07 | 5.26 | 443 | 3046 |
Ryan Fitzpatrick | BUF | 2010 | 1.9% | 0.13 | 56 | 8 | 6.51 | 5.26 | 441 | 3000 |
Bobby Hebert | ATL | 1996 | 1.7% | 0.11 | 55 | 7 | 5.32 | 5.4 | 488 | 3152 |
Philip Rivers | SDG | 2006 | 1.6% | 0.12 | 55 | 5 | 6.88 | 5.05 | 460 | 3388 |
Matt Cassel | KAN | 2010 | 1.8% | 0.12 | 55 | 4 | 5.79 | 6.11 | 450 | 3116 |
Colin Kaepernick | SFO | 2016 | 2.5% | 0.17 | 55 | 5 | 5.66 | 5.77 | 331 | 2241 |
Case Keenum | HOU | 2013 | 3.1% | 0.22 | 55 | 6 | 7.68 | 5.17 | 253 | 1760 |
Kordell Stewart | CHI | 2003 | 3.9% | 0.22 | 55 | 4 | 7.22 | 4.03 | 251 | 1418 |
Trent Dilfer | TAM | 1999 | 3.4% | 0.23 | 55 | 4 | 5.99 | 5.1 | 244 | 1619 |
J.P. Losman | BUF | 2005 | 4.1% | 0.24 | 55 | 6 | 6.58 | 5.27 | 228 | 1340 |
Jameis Winston | TAM | 2017 | 1.5% | 0.12 | 54 | 5 | 7.67 | 4.76 | 442 | 3504 |
Jon Kitna | DAL | 2010 | 2.3% | 0.17 | 54 | 6 | 4.66 | 6.66 | 318 | 2365 |
Chris Simms | TAM | 2005 | 2.7% | 0.17 | 54 | 3 | 6.06 | 4.59 | 313 | 2035 |
Christian Ponder | MIN | 2011 | 2.9% | 0.19 | 54 | 4 | 6.11 | 5.62 | 291 | 1853 |
Blaine Gabbert | JAX | 2012 | 3.2% | 0.19 | 54 | 3 | 5.74 | 4.52 | 278 | 1662 |
Josh Freeman | TAM | 2011 | 1.5% | 0.1 | 53 | 5 | 5.22 | 5.16 | 551 | 3592 |
Marc Bulger | STL | 2004 | 1.3% | 0.11 | 53 | 6 | 7.57 | 4.78 | 485 | 3964 |
Marcus Mariota | TEN | 2016 | 1.5% | 0.12 | 53 | 7 | 7.59 | 4.82 | 451 | 3426 |
Ben Roethlisberger | PIT | 2007 | 1.7% | 0.13 | 53 | 6 | 7.57 | 4.38 | 404 | 3154 |
Alex Smith | SFO | 2009 | 2.3% | 0.14 | 53 | 5 | 5.27 | 5.17 | 372 | 2350 |
Charlie Batch | DET | 1999 | 2.7% | 0.2 | 53 | 8 | 6.76 | 6.2 | 270 | 1957 |
Sam Bradford | MIN | 2016 | 1.3% | 0.09 | 52 | 8 | 4.66 | 5.15 | 552 | 3877 |
Matt Hasselbeck | SEA | 2005 | 1.5% | 0.12 | 52 | 7 | 7.67 | 4.09 | 449 | 3459 |
Joey Harrington | DET | 2002 | 2.3% | 0.12 | 52 | 6 | 5.26 | 5.41 | 429 | 2294 |
Stan Humphries | SDG | 1996 | 1.9% | 0.13 | 52 | 6 | 6.68 | 4.83 | 416 | 2670 |
Danny Kanell | NYG | 1997 | 3% | 0.18 | 52 | 6 | 5.74 | 5.41 | 294 | 1740 |
Bobby Hoying | PHI | 1997 | 3.3% | 0.23 | 52 | 3 | 6.75 | 5.55 | 225 | 1573 |
Brett Favre | NYJ | 2008 | 1.5% | 0.1 | 51 | 7 | 4.94 | 5.19 | 522 | 3472 |
Vince Young | TEN | 2007 | 2% | 0.13 | 51 | 5 | 5.85 | 4.85 | 382 | 2546 |
Marcus Mariota | TEN | 2015 | 1.8% | 0.14 | 51 | 4 | 7.1 | 5.15 | 370 | 2818 |
Jay Fiedler | MIA | 2000 | 2.1% | 0.14 | 51 | 8 | 7.05 | 4.72 | 357 | 2402 |
John Elway | DEN | 1998 | 1.8% | 0.14 | 51 | 6 | 8.93 | 4.43 | 356 | 2806 |
Josh McCown | TAM | 2014 | 2.3% | 0.16 | 51 | 6 | 7.79 | 4.2 | 327 | 2206 |
Philip Rivers | SDG | 2012 | 1.4% | 0.09 | 50 | 3 | 4.93 | 5.74 | 527 | 3606 |
Jason Campbell | WAS | 2008 | 1.5% | 0.1 | 50 | 3 | 4.95 | 5.35 | 506 | 3245 |
Doug Flutie | BUF | 1999 | 1.6% | 0.1 | 50 | 7 | 7.23 | 4.78 | 478 | 3171 |
Kerry Collins | CAR | 1996 | 2% | 0.14 | 50 | 4 | 7.18 | 4.85 | 364 | 2454 |
Eli Manning | NYG | 2007 | 1.5% | 0.09 | 49 | 6 | 6.6 | 4.63 | 529 | 3336 |
Kerry Collins | NYG | 2000 | 1.4% | 0.09 | 49 | 7 | 6.08 | 5.53 | 529 | 3610 |
Josh McCown | CLE | 2015 | 2.3% | 0.17 | 49 | 6 | 5.87 | 5.47 | 292 | 2109 |
Kurt Warner | NYG | 2004 | 2.4% | 0.18 | 49 | 6 | 6.22 | 5.59 | 277 | 2054 |
Kelly Holcomb | BUF | 2005 | 3.2% | 0.21 | 49 | 3 | 4.44 | 5.3 | 230 | 1509 |
Josh McCown | CHI | 2013 | 2.7% | 0.22 | 49 | 3 | 6.38 | 5.9 | 224 | 1829 |
Cam Newton | CAR | 2017 | 1.5% | 0.1 | 48 | 5 | 5.64 | 5.71 | 492 | 3302 |
Brett Favre | GNB | 2003 | 1.4% | 0.1 | 48 | 7 | 5.74 | 5.18 | 471 | 3361 |
Kyle Orton | CHI | 2008 | 1.6% | 0.1 | 48 | 3 | 5.6 | 5.33 | 465 | 2972 |
Tony Banks | STL | 1998 | 1.9% | 0.12 | 48 | 4 | 5.85 | 4.67 | 408 | 2535 |
Trent Edwards | BUF | 2008 | 1.8% | 0.13 | 48 | 5 | 5.85 | 5.17 | 374 | 2699 |
Chris Chandler | ATL | 2000 | 2.1% | 0.15 | 48 | 5 | 6.51 | 5.14 | 331 | 2236 |
John Skelton | ARI | 2011 | 2.5% | 0.17 | 48 | 7 | 6.95 | 5.72 | 275 | 1913 |
Drew Bledsoe | NWE | 1996 | 1.2% | 0.08 | 47 | 3 | 6.17 | 4.79 | 623 | 4086 |
Jake Delhomme | CAR | 2004 | 1.2% | 0.09 | 47 | 8 | 8.31 | 4.22 | 533 | 3886 |
Steve McNair | TEN | 2005 | 1.5% | 0.1 | 47 | 7 | 5.69 | 5.13 | 476 | 3161 |
Brian Griese | DEN | 2000 | 1.7% | 0.14 | 47 | 5 | 7.16 | 5.29 | 336 | 2688 |
Chris Chandler | HOU | 1996 | 2.2% | 0.15 | 47 | 3 | 6.3 | 5.11 | 320 | 2099 |
Sam Bradford | STL | 2013 | 2.8% | 0.18 | 47 | 3 | 4.72 | 5.89 | 262 | 1687 |
Vince Young | TEN | 2009 | 2.5% | 0.18 | 47 | 4 | 6.89 | 5.47 | 259 | 1879 |
Chad Hutchinson | DAL | 2002 | 3% | 0.19 | 47 | 7 | 7.38 | 4.87 | 250 | 1555 |
Michael Vick | ATL | 2005 | 1.9% | 0.12 | 46 | 3 | 7.14 | 4.13 | 387 | 2412 |
Neil O'Donnell | PIT | 1994 | 1.9% | 0.12 | 46 | 7 | 6.22 | 5.31 | 370 | 2443 |
Matt Moore | MIA | 2011 | 1.8% | 0.13 | 46 | 6 | 7.6 | 4.29 | 347 | 2497 |
Ryan Leaf | SDG | 1998 | 3.6% | 0.19 | 46 | 3 | 6.07 | 5.54 | 245 | 1289 |
Rex Grossman | CHI | 2007 | 3.3% | 0.2 | 46 | 5 | 6.48 | 5.08 | 225 | 1411 |
Boomer Esiason | NYJ | 1994 | 1.6% | 0.1 | 45 | 3 | 5.32 | 5.59 | 440 | 2782 |
Ryan Fitzpatrick | CIN | 2008 | 2.4% | 0.12 | 45 | 2 | 4.78 | 3.84 | 372 | 1905 |
Dan Marino | MIA | 1999 | 1.8% | 0.12 | 45 | 5 | 7.4 | 4.6 | 369 | 2448 |
Blaine Gabbert | SFO | 2015 | 2.2% | 0.16 | 45 | 5 | 5.19 | 6.22 | 282 | 2031 |
Brian Griese | CHI | 2007 | 2.5% | 0.17 | 45 | 2 | 5.35 | 5.85 | 262 | 1803 |
Christian Ponder | MIN | 2012 | 1.5% | 0.09 | 44 | 3 | 4.07 | 5.71 | 483 | 2935 |
Kurt Warner | ARI | 2007 | 1.3% | 0.1 | 44 | 5 | 7.5 | 4.66 | 451 | 3417 |
Jake Plummer | ARI | 1999 | 2.1% | 0.12 | 44 | 4 | 6.04 | 4.46 | 381 | 2111 |
David Garrard | JAX | 2007 | 1.8% | 0.14 | 44 | 5 | 7.41 | 4.65 | 325 | 2509 |
Kurt Warner | ARI | 2005 | 1.6% | 0.11 | 43 | 4 | 6.48 | 4.73 | 375 | 2713 |
Sam Bradford | STL | 2011 | 2% | 0.12 | 43 | 3 | 6.6 | 4.73 | 357 | 2164 |
Dave Brown | NYG | 1994 | 1.7% | 0.12 | 43 | 9 | 7.12 | 5.49 | 350 | 2536 |
Steve Bono | KAN | 1995 | 1.3% | 0.08 | 42 | 5 | 6.05 | 4.6 | 520 | 3121 |
Joe Montana | KAN | 1994 | 1.3% | 0.09 | 42 | 5 | 5.47 | 5.51 | 493 | 3283 |
Gus Frerotte | WAS | 1996 | 1.2% | 0.09 | 42 | 6 | 7.37 | 5.41 | 470 | 3453 |
Kyle Boller | BAL | 2004 | 1.6% | 0.09 | 42 | 4 | 5.81 | 4.11 | 464 | 2559 |
Jake Plummer | DEN | 2003 | 1.9% | 0.14 | 42 | 5 | 6.65 | 4.9 | 302 | 2182 |
Drew Bledsoe | NWE | 2000 | 1.2% | 0.08 | 41 | 4 | 5.04 | 5.5 | 531 | 3291 |
Kordell Stewart | PIT | 1998 | 1.6% | 0.09 | 41 | 4 | 6.26 | 3.9 | 458 | 2560 |
Frank Reich | NYJ | 1996 | 1.9% | 0.12 | 41 | 6 | 8.24 | 4.36 | 331 | 2205 |
Ben Roethlisberger | PIT | 2004 | 1.6% | 0.14 | 41 | 6 | 8.48 | 4.89 | 295 | 2621 |
Kellen Clemens | NYJ | 2007 | 2.7% | 0.16 | 41 | 4 | 6.16 | 5.6 | 250 | 1529 |
Jason Campbell | WAS | 2007 | 1.5% | 0.1 | 40 | 4 | 6.02 | 4.78 | 417 | 2700 |
Matt Hasselbeck | SEA | 2001 | 2% | 0.12 | 40 | 4 | 6.3 | 5.2 | 321 | 2023 |
Kyle Boller | BAL | 2003 | 3.2% | 0.18 | 40 | 3 | 5.98 | 4.88 | 224 | 1260 |
Steve McNair | TEN | 2002 | 1.2% | 0.08 | 39 | 6 | 7.22 | 4.04 | 492 | 3387 |
Alex Smith | KAN | 2014 | 1.2% | 0.08 | 39 | 3 | 4.37 | 6.41 | 464 | 3265 |
Troy Aikman | DAL | 1995 | 1.2% | 0.09 | 39 | 8 | 7.1 | 4.7 | 432 | 3304 |
Daunte Culpepper | MIN | 2001 | 1.5% | 0.11 | 39 | 5 | 6.21 | 4.9 | 366 | 2612 |
Patrick Ramsey | WAS | 2003 | 1.8% | 0.12 | 39 | 3 | 6.37 | 5.73 | 337 | 2166 |
Jay Cutler | CHI | 2011 | 1.7% | 0.12 | 39 | 5 | 6.97 | 5.77 | 314 | 2319 |
Steve Beuerlein | ARI | 1994 | 2.5% | 0.15 | 39 | 3 | 7.18 | 4.7 | 255 | 1545 |
Teddy Bridgewater | MIN | 2015 | 1.2% | 0.09 | 38 | 6 | 4.85 | 6.22 | 447 | 3231 |
Alex Smith | SFO | 2011 | 1.2% | 0.09 | 38 | 6 | 6.15 | 5.37 | 445 | 3144 |
Jim Harbaugh | IND | 1995 | 1.5% | 0.12 | 38 | 8 | 7.12 | 5.76 | 314 | 2575 |
Cleo Lemon | MIA | 2007 | 2.1% | 0.12 | 38 | 2 | 5.17 | 5.08 | 309 | 1773 |
Rick Mirer | SEA | 1996 | 2.5% | 0.14 | 38 | 4 | 6.24 | 5.13 | 265 | 1546 |
Drew Stanton | ARI | 2014 | 2.2% | 0.16 | 38 | 6 | 7.88 | 5.08 | 240 | 1711 |
David Klingler | CIN | 1994 | 2.9% | 0.16 | 38 | 4 | 4.81 | 5.32 | 231 | 1327 |
Joey Harrington | DET | 2003 | 1.3% | 0.07 | 37 | 3 | 4.75 | 4.57 | 554 | 2880 |
Chad Henne | MIA | 2010 | 1.1% | 0.08 | 37 | 4 | 6.34 | 4.63 | 490 | 3301 |
Neil O'Donnell | NYJ | 1997 | 1.3% | 0.08 | 37 | 2 | 6.42 | 4.37 | 460 | 2796 |
Trent Dilfer | TAM | 1995 | 1.3% | 0.09 | 37 | 3 | 7.55 | 4.83 | 415 | 2774 |
Steve McNair | TEN | 1997 | 1.4% | 0.09 | 37 | 5 | 7.16 | 5.18 | 415 | 2665 |
Joey Harrington | ATL | 2007 | 1.7% | 0.11 | 37 | 2 | 4.91 | 5.4 | 348 | 2215 |
Tim Rattay | SFO | 2004 | 1.7% | 0.11 | 37 | 2 | 6.43 | 4.52 | 325 | 2169 |
Brett Hundley | GNB | 2017 | 2% | 0.12 | 37 | 4 | 4.14 | 5.43 | 316 | 1836 |
Rob Johnson | BUF | 2000 | 1.7% | 0.12 | 37 | 4 | 7.2 | 4.94 | 306 | 2125 |
Matt Hasselbeck | SEA | 2004 | 1.1% | 0.08 | 36 | 2 | 7.19 | 4.94 | 474 | 3382 |
Scott Mitchell | DET | 1996 | 1.2% | 0.08 | 36 | 3 | 8.02 | 3.51 | 437 | 2917 |
Steve McNair | TEN | 2000 | 1.3% | 0.09 | 36 | 5 | 6.27 | 5.21 | 396 | 2847 |
Jake Delhomme | CAR | 2009 | 1.8% | 0.11 | 36 | 4 | 6.32 | 5 | 321 | 2015 |
Jay Fiedler | MIA | 2003 | 1.7% | 0.11 | 36 | 2 | 6.79 | 5.16 | 314 | 2138 |
Austin Davis | STL | 2014 | 1.8% | 0.13 | 36 | 4 | 5.85 | 5.27 | 284 | 2001 |
Trent Dilfer | BAL | 2000 | 2.4% | 0.16 | 36 | 6 | 6.69 | 4.52 | 226 | 1502 |
Mark Sanchez | NYJ | 2011 | 1% | 0.06 | 35 | 2 | 6 | 5.28 | 543 | 3474 |
Tommy Maddox | PIT | 2003 | 1% | 0.07 | 35 | 4 | 7.1 | 4.36 | 519 | 3414 |
Matt Hasselbeck | SEA | 2009 | 1.2% | 0.07 | 35 | 5 | 4.45 | 5.89 | 488 | 3029 |
Jim Everett | NOR | 1996 | 1.3% | 0.08 | 35 | 5 | 6.34 | 4.13 | 464 | 2797 |
Rex Grossman | WAS | 2011 | 1.1% | 0.08 | 35 | 6 | 6.52 | 5.37 | 458 | 3151 |
Mitch Trubisky | CHI | 2017 | 1.6% | 0.11 | 35 | 3 | 5.99 | 5.19 | 330 | 2193 |
Jake Plummer | ARI | 1998 | 0.9% | 0.06 | 34 | 6 | 6.81 | 4.73 | 547 | 3737 |
DeShone Kizer | CLE | 2017 | 1.2% | 0.07 | 34 | 3 | 5.58 | 5.77 | 476 | 2894 |
Dave Brown | NYG | 1995 | 1.2% | 0.07 | 34 | 5 | 6.13 | 4.95 | 456 | 2814 |
Mark Sanchez | NYJ | 2012 | 1.2% | 0.08 | 34 | 5 | 7.55 | 4.17 | 453 | 2883 |
Vinny Testaverde | CLE | 1995 | 1.2% | 0.09 | 34 | 4 | 7.02 | 4.94 | 392 | 2883 |
Kyle Boller | BAL | 2007 | 2% | 0.12 | 34 | 4 | 6.51 | 3.86 | 275 | 1743 |
Craig Whelihan | SDG | 1997 | 2.5% | 0.14 | 34 | 4 | 6.97 | 4.53 | 237 | 1357 |
Dan Marino | MIA | 1997 | 0.9% | 0.06 | 33 | 4 | 6.96 | 4.89 | 548 | 3780 |
Rich Gannon | OAK | 1999 | 0.9% | 0.06 | 33 | 7 | 6.41 | 6.22 | 515 | 3840 |
Brock Osweiler | HOU | 2016 | 1.1% | 0.06 | 33 | 4 | 5.94 | 3.89 | 510 | 2957 |
Boomer Esiason | ARI | 1996 | 1.4% | 0.1 | 33 | 3 | 6.37 | 5.7 | 339 | 2293 |
Jim Harbaugh | IND | 1997 | 1.6% | 0.11 | 33 | 4 | 6.69 | 4.21 | 309 | 2060 |
Brooks Bollinger | NYJ | 2005 | 2.1% | 0.12 | 33 | 4 | 6.26 | 4.13 | 266 | 1558 |
Patrick Ramsey | WAS | 2002 | 2.1% | 0.15 | 33 | 5 | 7.61 | 5.55 | 227 | 1539 |
Robert Griffin | WAS | 2013 | 1% | 0.07 | 32 | 4 | 6 | 5.69 | 456 | 3203 |
Brian Griese | DEN | 2001 | 1.1% | 0.07 | 32 | 2 | 5.4 | 4.88 | 451 | 2827 |
Jay Cutler | MIA | 2017 | 1.2% | 0.07 | 32 | 2 | 5.38 | 4.65 | 429 | 2666 |
Josh McCown | ARI | 2005 | 1.7% | 0.12 | 32 | 6 | 6.29 | 4.98 | 270 | 1836 |
Vinny Testaverde | DAL | 2004 | 0.9% | 0.06 | 31 | 4 | 7.63 | 4.27 | 495 | 3532 |
Aaron Brooks | NOR | 2005 | 1.1% | 0.07 | 31 | 4 | 7.28 | 4.73 | 431 | 2882 |
Charlie Batch | DET | 2000 | 1.2% | 0.08 | 31 | 3 | 6.05 | 5.22 | 412 | 2489 |
Chad Pennington | NYJ | 2004 | 1.2% | 0.08 | 31 | 6 | 6.22 | 4.82 | 370 | 2673 |
Jay Fiedler | MIA | 2002 | 1.5% | 0.11 | 31 | 3 | 6.28 | 5.02 | 292 | 2024 |
Kent Graham | ARI | 1996 | 1.9% | 0.11 | 31 | 2 | 5.86 | 5.26 | 274 | 1624 |
Shaun Hill | STL | 2014 | 1.9% | 0.14 | 31 | 3 | 5.64 | 5.79 | 229 | 1657 |
Jon Kitna | SEA | 1999 | 0.9% | 0.06 | 30 | 5 | 8.36 | 4.03 | 495 | 3346 |
Stan Humphries | SDG | 1995 | 0.9% | 0.06 | 30 | 4 | 7.59 | 4.4 | 478 | 3381 |
Joe Flacco | BAL | 2015 | 1.1% | 0.07 | 30 | 4 | 4.9 | 5.59 | 413 | 2791 |
Gus Frerotte | WAS | 1997 | 1.1% | 0.07 | 30 | 5 | 6.88 | 6.27 | 402 | 2682 |
Craig Whelihan | SDG | 1998 | 1.7% | 0.09 | 30 | 4 | 6.64 | 5.46 | 320 | 1803 |
John Elway | DEN | 1996 | 0.9% | 0.06 | 29 | 5 | 6.57 | 5.03 | 466 | 3328 |
Ryan Fitzpatrick | NYJ | 2016 | 1.1% | 0.07 | 29 | 5 | 6.82 | 5.07 | 403 | 2710 |
Damon Huard | KAN | 2007 | 1.3% | 0.09 | 29 | 2 | 6.06 | 4.9 | 332 | 2257 |
Bruce Gradkowski | TAM | 2006 | 1.7% | 0.09 | 29 | 3 | 4.24 | 5.15 | 328 | 1661 |
Kent Graham | NYG | 1999 | 1.7% | 0.11 | 29 | 2 | 6.13 | 4.48 | 271 | 1697 |
Drew Bledsoe | NWE | 1994 | 0.6% | 0.04 | 28 | 3 | 7.22 | 4.17 | 691 | 4555 |
Aaron Brooks | NOR | 2004 | 0.7% | 0.05 | 28 | 5 | 7.77 | 4.56 | 542 | 3810 |
Chris Miller | RAM | 1994 | 1.3% | 0.09 | 28 | 4 | 5.97 | 6.19 | 317 | 2104 |
Kelly Holcomb | CLE | 2003 | 1.6% | 0.09 | 28 | 1 | 4.99 | 4.32 | 302 | 1797 |
Tim Tebow | DEN | 2011 | 1.6% | 0.1 | 28 | 6 | 8.44 | 5.28 | 271 | 1729 |
Kyle Orton | 2TM | 2011 | 1.6% | 0.11 | 28 | 4 | 6.29 | 5.43 | 252 | 1758 |
Sage Rosenfels | HOU | 2007 | 1.7% | 0.12 | 28 | 4 | 7.16 | 3.77 | 240 | 1684 |
Drew Brees | SDG | 2005 | 0.8% | 0.05 | 27 | 4 | 6.28 | 4.79 | 500 | 3576 |
Kerry Collins | TEN | 2008 | 1% | 0.07 | 27 | 4 | 5.72 | 5.34 | 415 | 2676 |
Steve Young | SFO | 1996 | 1.1% | 0.09 | 27 | 4 | 5.96 | 5.3 | 316 | 2410 |
Marc Bulger | STL | 2005 | 1.2% | 0.09 | 27 | 3 | 7.79 | 4.18 | 287 | 2297 |
Billy Joe Tolliver | NOR | 1999 | 1.4% | 0.1 | 27 | 6 | 9.14 | 4.64 | 268 | 1916 |
Blake Bortles | JAX | 2016 | 0.7% | 0.04 | 26 | 4 | 5.45 | 5.16 | 625 | 3905 |
Donovan McNabb | PHI | 2002 | 1.1% | 0.07 | 26 | 3 | 6.27 | 4.57 | 361 | 2289 |
Billy Volek | TEN | 2004 | 1% | 0.07 | 26 | 5 | 7.18 | 4.22 | 357 | 2486 |
Jeff Blake | CIN | 1997 | 1.2% | 0.08 | 26 | 3 | 5.88 | 5.67 | 317 | 2125 |
Jim Miller | CHI | 2002 | 1.3% | 0.08 | 26 | 2 | 6.49 | 4.31 | 314 | 1944 |
Ray Lucas | NYJ | 1999 | 1.5% | 0.1 | 26 | 2 | 5.6 | 4.82 | 272 | 1678 |
Chad Pennington | NYJ | 2007 | 1.5% | 0.1 | 26 | 3 | 5.83 | 4.03 | 260 | 1765 |
Matt Ryan | ATL | 2010 | 0.7% | 0.04 | 25 | 6 | 6.41 | 3.97 | 571 | 3705 |
Cam Newton | CAR | 2014 | 0.8% | 0.06 | 25 | 4 | 6.82 | 5.11 | 448 | 3127 |
Brett Favre | GNB | 1994 | 0.6% | 0.04 | 24 | 4 | 5.25 | 5.44 | 582 | 3882 |
Dave Krieg | ARI | 1995 | 0.7% | 0.05 | 24 | 4 | 6.13 | 5.56 | 521 | 3554 |
Joey Harrington | MIA | 2006 | 1.1% | 0.06 | 24 | 5 | 5.61 | 4.42 | 388 | 2236 |
Doug Flutie | BUF | 2000 | 1.4% | 0.1 | 24 | 4 | 8.54 | 4.34 | 231 | 1700 |
Jon Kitna | DET | 2006 | 0.5% | 0.04 | 23 | 3 | 6.39 | 4.92 | 596 | 4208 |
Drew Bledsoe | BUF | 2003 | 0.8% | 0.05 | 23 | 2 | 6.07 | 4.37 | 471 | 2860 |
Vinny Testaverde | BAL | 1997 | 0.8% | 0.05 | 23 | 6 | 6.25 | 4.72 | 470 | 2971 |
David Carr | HOU | 2005 | 0.9% | 0.05 | 23 | 2 | 5.41 | 4.31 | 423 | 2488 |
Matt Cassel | KAN | 2011 | 1.3% | 0.09 | 23 | 5 | 5.98 | 4.73 | 269 | 1713 |
Ty Detmer | PHI | 1997 | 1.5% | 0.09 | 23 | 2 | 6.01 | 5.68 | 244 | 1567 |
Drew Brees | SDG | 2002 | 0.7% | 0.04 | 22 | 4 | 5.24 | 5.02 | 526 | 3284 |
Jim Harbaugh | IND | 1996 | 0.8% | 0.05 | 22 | 6 | 5.92 | 5.42 | 405 | 2630 |
Dave Krieg | CHI | 1996 | 1% | 0.06 | 22 | 2 | 5.35 | 4.73 | 377 | 2278 |
Jeff Blake | NOR | 2000 | 1.1% | 0.07 | 22 | 4 | 5.38 | 5.63 | 302 | 2025 |
Brady Quinn | CLE | 2009 | 1.6% | 0.09 | 22 | 3 | 5 | 4.85 | 256 | 1339 |
Sam Bradford | STL | 2010 | 0.6% | 0.04 | 21 | 4 | 4.44 | 5.49 | 590 | 3512 |
Ryan Tannehill | MIA | 2014 | 0.5% | 0.04 | 21 | 4 | 5.31 | 5.01 | 590 | 4045 |
Joey Harrington | DET | 2004 | 0.7% | 0.04 | 21 | 3 | 5.39 | 5.73 | 489 | 3047 |
Tyrod Taylor | BUF | 2017 | 0.8% | 0.05 | 21 | 4 | 5.8 | 4.84 | 420 | 2799 |
Matt Hasselbeck | IND | 2015 | 1.2% | 0.08 | 21 | 3 | 5.72 | 5.12 | 256 | 1690 |
Chris Weinke | CAR | 2001 | 0.7% | 0.04 | 20 | 4 | 5.51 | 4.49 | 540 | 2931 |
Mark Brunell | WAS | 2004 | 1.7% | 0.08 | 20 | 3 | 6.5 | 3.62 | 237 | 1194 |
Kerry Collins | CAR | 1997 | 0.9% | 0.05 | 19 | 1 | 6.6 | 4.02 | 381 | 2124 |
Jimmy Clausen | CAR | 2010 | 1.2% | 0.06 | 19 | 2 | 4.54 | 5.38 | 299 | 1558 |
Ken Dorsey | SFO | 2004 | 1.5% | 0.08 | 19 | 1 | 5.93 | 4.07 | 226 | 1231 |
Philip Rivers | SDG | 2007 | 0.6% | 0.04 | 18 | 4 | 6.27 | 5.1 | 460 | 3152 |
David Carr | HOU | 2006 | 0.7% | 0.04 | 18 | 3 | 3.97 | 5.2 | 442 | 2767 |
Matt Hasselbeck | SEA | 2002 | 0.6% | 0.04 | 18 | 4 | 6.44 | 5.07 | 419 | 3075 |
Kyle Orton | CHI | 2005 | 1% | 0.05 | 18 | 3 | 5.99 | 3.85 | 368 | 1869 |
Steve Walsh | CHI | 1994 | 0.9% | 0.05 | 18 | 3 | 5.26 | 4.73 | 343 | 2078 |
Elvis Grbac | KAN | 1997 | 0.9% | 0.06 | 18 | 2 | 5.99 | 4.87 | 314 | 1943 |
Steve Beuerlein | CAR | 2000 | 0.5% | 0.03 | 17 | 2 | 6.41 | 5.1 | 533 | 3730 |
Rick Mirer | SEA | 1994 | 0.8% | 0.04 | 17 | 4 | 6.48 | 4.55 | 381 | 2151 |
Shaun Hill | SFO | 2008 | 0.8% | 0.06 | 17 | 3 | 6.36 | 4.94 | 288 | 2046 |
Jay Schroeder | ARI | 1994 | 1.1% | 0.07 | 17 | 5 | 5.7 | 5.65 | 238 | 1510 |
Steve McNair | TEN | 1998 | 0.5% | 0.03 | 16 | 3 | 6.59 | 4.58 | 492 | 3228 |
Shane Matthews | CHI | 1999 | 1% | 0.06 | 16 | 1 | 5.23 | 3.93 | 275 | 1645 |
Patrick Ramsey | WAS | 2004 | 1% | 0.06 | 16 | 2 | 5.94 | 3.91 | 272 | 1665 |
Rich Gannon | OAK | 2001 | 0.4% | 0.03 | 15 | 5 | 5.91 | 4.69 | 549 | 3828 |
Brian Hoyer | HOU | 2015 | 0.6% | 0.04 | 15 | 5 | 7.58 | 4.06 | 369 | 2606 |
Marc Bulger | STL | 2009 | 1% | 0.06 | 15 | 2 | 5.41 | 5.09 | 247 | 1469 |
Byron Leftwich | JAX | 2005 | 0.7% | 0.05 | 14 | 5 | 7.65 | 4.48 | 302 | 2123 |
Warren Moon | MIN | 1996 | 0.9% | 0.06 | 14 | 2 | 7.54 | 4.47 | 247 | 1610 |
Brett Favre | MIN | 2010 | 0.5% | 0.04 | 13 | 1 | 5.36 | 6.2 | 358 | 2509 |
Vince Young | TEN | 2006 | 0.6% | 0.04 | 13 | 1 | 6.72 | 5.23 | 357 | 2199 |
Tony Banks | BAL | 2000 | 0.8% | 0.05 | 13 | 2 | 5.39 | 5.13 | 274 | 1578 |
Jameis Winston | TAM | 2016 | 0.3% | 0.02 | 12 | 4 | 7.83 | 4.02 | 567 | 4090 |
Chad Pennington | NYJ | 2002 | 0.4% | 0.03 | 12 | 3 | 5.95 | 5.39 | 399 | 3120 |
Danny Kanell | NYG | 1998 | 0.7% | 0.04 | 11 | 2 | 5.78 | 4.24 | 299 | 1603 |
Andrew Walter | OAK | 2006 | 0.7% | 0.04 | 11 | 1 | 7.75 | 3.66 | 276 | 1677 |
Carson Palmer | ARI | 2017 | 0.6% | 0.04 | 11 | 2 | 7.31 | 4.76 | 266 | 1968 |
Christian Ponder | MIN | 2013 | 0.7% | 0.05 | 11 | 2 | 5.98 | 4.86 | 239 | 1648 |
Gus Frerotte | DEN | 2000 | 0.6% | 0.05 | 11 | 5 | 6.47 | 6.4 | 232 | 1776 |
Drew Bledsoe | NWE | 1995 | 0.3% | 0.02 | 10 | 2 | 6.36 | 4.5 | 636 | 3507 |
Tom Brady | NWE | 2002 | 0.3% | 0.02 | 10 | 3 | 4.78 | 5.31 | 601 | 3764 |
Jon Kitna | CIN | 2001 | 0.3% | 0.02 | 10 | 2 | 6.86 | 3.42 | 581 | 3216 |
Marc Bulger | STL | 2003 | 0.3% | 0.02 | 10 | 5 | 7.07 | 4.38 | 532 | 3845 |
Josh McCown | ARI | 2004 | 0.4% | 0.02 | 10 | 3 | 6.67 | 4.11 | 408 | 2511 |
E.J. Manuel | BUF | 2013 | 0.5% | 0.03 | 10 | 4 | 5.66 | 5.29 | 306 | 1972 |
Kordell Stewart | PIT | 2000 | 0.5% | 0.03 | 10 | 2 | 7.56 | 4.75 | 289 | 1860 |
Nick Foles | PHI | 2012 | 0.6% | 0.04 | 10 | 2 | 4.88 | 5.67 | 265 | 1699 |
Kent Graham | ARI | 1997 | 0.7% | 0.04 | 10 | 3 | 6.28 | 4.55 | 250 | 1408 |
David Garrard | JAX | 2006 | 0.6% | 0.04 | 10 | 2 | 6.22 | 5.74 | 241 | 1735 |
Kurt Warner | ARI | 2009 | 0.2% | 0.02 | 9 | 3 | 6.2 | 4.87 | 513 | 3753 |
Eli Manning | NYG | 2008 | 0.3% | 0.02 | 9 | 4 | 6.98 | 4.22 | 479 | 3238 |
Warren Moon | SEA | 1998 | 0.6% | 0.03 | 9 | 3 | 7.23 | 4.02 | 258 | 1632 |
Mike Tomczak | PIT | 1999 | 0.6% | 0.03 | 9 | 1 | 7.61 | 4.08 | 258 | 1625 |
Anthony Wright | BAL | 2005 | 0.5% | 0.03 | 8 | 1 | 5.63 | 4.01 | 266 | 1582 |
Troy Aikman | DAL | 2000 | 0.5% | 0.03 | 8 | 1 | 6.35 | 4.11 | 262 | 1632 |
Ryan Mallett | 2TM | 2015 | 0.6% | 0.03 | 8 | 1 | 5.22 | 6 | 244 | 1336 |
Brad Johnson | TAM | 2001 | 0.2% | 0.01 | 7 | 1 | 5.7 | 4.32 | 559 | 3406 |
Boomer Esiason | NYJ | 1995 | 0.3% | 0.02 | 7 | 3 | 5.35 | 4.95 | 389 | 2275 |
Matt Schaub | HOU | 2013 | 0.3% | 0.02 | 7 | 3 | 6.15 | 4.4 | 358 | 2310 |
Kyle Boller | BAL | 2005 | 0.4% | 0.02 | 7 | 1 | 5.68 | 4.84 | 293 | 1799 |
Donald Hollas | OAK | 1998 | 0.4% | 0.03 | 7 | 1 | 7.83 | 5.16 | 260 | 1754 |
Brad Johnson | MIN | 2006 | 0.2% | 0.01 | 6 | 4 | 4.93 | 5.26 | 439 | 2750 |
Matt Cassel | KAN | 2012 | 0.3% | 0.02 | 6 | 1 | 5.86 | 5.3 | 277 | 1796 |
Akili Smith | CIN | 2000 | 0.5% | 0.02 | 6 | 1 | 6.08 | 4.53 | 267 | 1253 |
Rich Gannon | OAK | 2003 | 0.5% | 0.03 | 6 | 1 | 5.65 | 4.54 | 225 | 1274 |
Trent Dilfer | TAM | 1996 | 0.2% | 0.01 | 5 | 2 | 6.08 | 4.63 | 482 | 2859 |
Mark Brunell | JAX | 1995 | 0.2% | 0.01 | 5 | 1 | 7 | 3.79 | 346 | 2168 |
Billy Joe Tolliver | HOU | 1994 | 0.4% | 0.02 | 5 | 2 | 5.39 | 5.25 | 240 | 1287 |
Mark Brunell | JAX | 2001 | 0.1% | 0.01 | 4 | 2 | 7.63 | 3.82 | 473 | 3309 |
Trevor Siemian | DEN | 2017 | 0.2% | 0.01 | 4 | 2 | 6.04 | 5.05 | 349 | 2285 |
Derek Anderson | ARI | 2010 | 0.1% | 0.01 | 3 | 1 | 7.75 | 4.47 | 327 | 2065 |
Kordell Stewart | PIT | 1999 | 0.2% | 0.01 | 3 | 2 | 4.33 | 5.52 | 275 | 1464 |
Shane Matthews | WAS | 2002 | 0.2% | 0.01 | 3 | 1 | 5.4 | 4.69 | 237 | 1251 |
Ty Detmer | PHI | 1996 | 0.1% | 0 | 2 | 2 | 6.71 | 5.53 | 401 | 2911 |
Josh Freeman | TAM | 2009 | 0.1% | 0.01 | 2 | 2 | 7.23 | 4.51 | 290 | 1855 |
David Garrard | JAX | 2008 | 0% | 0 | 1 | 1 | 6.35 | 4.46 | 535 | 3620 |
Vinny Testaverde | NYJ | 2001 | 0% | 0 | 0 | 1 | 5.47 | 5.12 | 441 | 2752 |
Dave Brown | NYG | 1996 | 0% | 0 | 0 | 0 | 6.66 | 4.61 | 398 | 2412 |
Marc Bulger | STL | 2007 | 0% | 0 | 0 | 1 | 6.81 | 4.02 | 378 | 2392 |
Rodney Peete | PHI | 1995 | 0% | 0 | 0 | 0 | 5.92 | 4.9 | 375 | 2326 |
A.J. Feeley | MIA | 2004 | 0% | 0 | 0 | 0 | 6.16 | 3.75 | 356 | 1893 |
Scott Mitchell | DET | 1994 | 0% | 0 | 0 | 0 | 9.24 | 3 | 246 | 1456 |
Brodie Croyle | KAN | 2007 | 0% | 0 | 0 | 0 | 5.29 | 4.37 | 224 | 1227 |
Bobby Hoying | PHI | 1998 | 0% | 0 | 0 | 0 | 3.79 | 4.64 | 224 | 961 |
Since an enormous table is rather ungainly to look at, I narrowed it down to seasons with at least 3,000 passing yards, then picked out the top 50 and bottom 50 seasons in Surplus % to view in more detail. First, the top:
As random as Surplus Yards are in the aggregate, the top of the chart doesn’t look like a random list of QB’s. There are a number of great seasons by great QB’s that were pushed into MVP territory by the bonus yardage from long plays. Even compared to the best seasons of big plays, Kurt Warner’s 2000 sticks out like a sore thumb. Warner tallied a ridiculous 306 Surplus Yards in only 11 games, including six completions of at least 72 yards. He had two games in particular that were just bananas: In week 1 against the Broncos, Warner tossed an 80 yard TD to Az-Zahir Hakim and a 72 yard TD to Marshall Faulk (the Hakim play is famous for looking like a relay race). In week 4 vs. Atlanta, Warner threw an 85 yard TD to Torry Holt, an 80 yard TD to Holt, and a 66 yard TD to Isaac Bruce; his stat line for the game was 12/19 for 336 yards!
But let’s be fair, there are some very mediocre QB’s sprinkled among the big play leaders. Nobody thinks J.P. Losman was anything but a bust, yet he managed to rack up the Surplus Yards back in 2006 (fun fact: both of his 83 yard completions occurred in the same quarter against Houston). Josh Freeman did nothing outside out of two decent seasons, RGIII is now a career backup, Jacoby Brissett is an unknown, Tony Banks played forever despite doing little of note, Blake Bortles and Andy Dalton are human memes, and Tyrod Taylor was hated by his own front office. That brings us to Jared Goff, who inspired this whole study in the first place. Will he prove himself to be great over the next few seasons, or was his 2017 breakout a fluke of unsustainable long plays? Regardless of how Goff’s career turns out, the chances of him picking up 230 Surplus Yards again next year are vey low.
Now, the bottom 50:
Here’s where the randomness of Surplus Yardage really comes to the forefront. With a few exceptions, this is chart is populated by plenty of good and great QB’s, some of whom had Pro Bowl seasons in spite of the paucity of bonus yardage. There are a number of QB’s who appear among the top and bottom 50 seasons, reinforcing the idea that Surplus Yards have little to do with the QB himself and are wildly inconsistent from year to year. Matt Hasselbeck shows up on the worst list in 2009 then jumps up to the best list in 2010 and 2011; Bortles made the best list in 2015 and worst list in 2016; Warner has the best Surplus % season and the fourth worst; Alex Smith had two seasons on the worst list before cracking the best list in 2017; RGIII went from best in 2012 to worst in 2013.
I could go on, but you get the point: Randomness rules.