≡ Menu

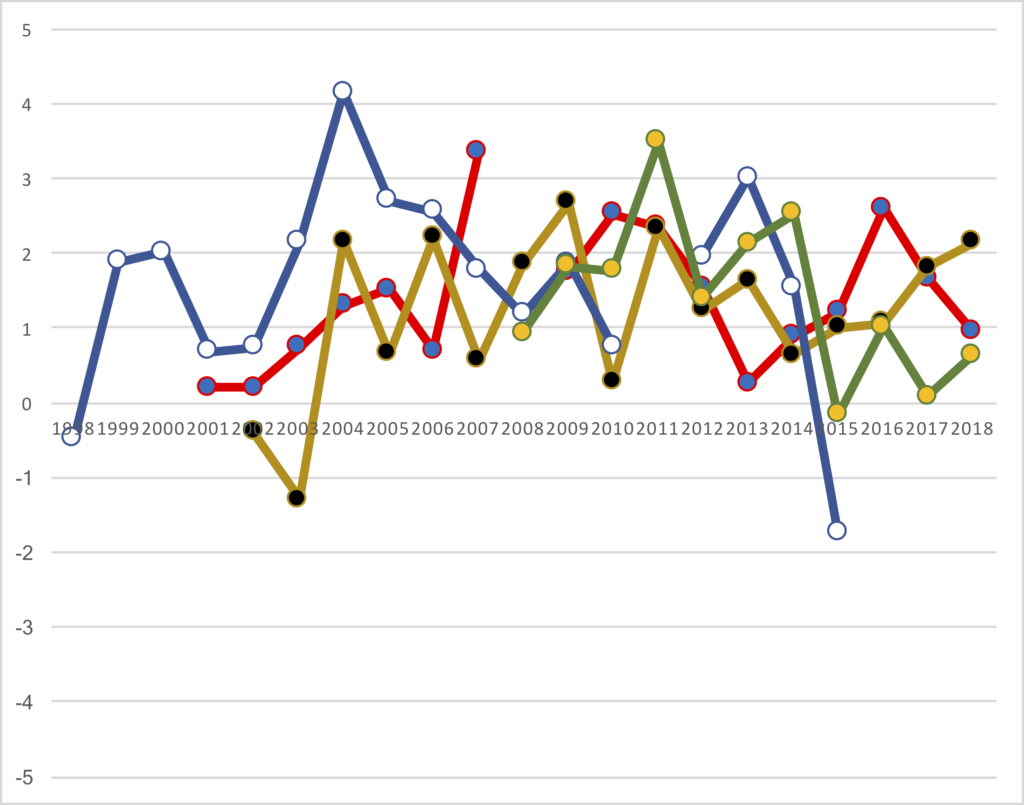
I calculated the Adjusted Net Yards per Attempt averages for every quarterback for every season in NFL history. I then calculated each quarterback’s Relative ANY/A, which is their ANY/A relative to league average. I wanted to then plot the big four quarterbacks of this era — Peyton Manning, Tom Brady, Drew Brees, and Aaron Rodgers — to see how they fared (after excluding seasons where the quarterback didn’t have enough pass attempts to qualify for the passing crown). I’ll leave the commentary to you guys, and I’ll just present the data in three different graphs.

First, let’s do it by chronological year. This means Manning’s graph starts early but ends, while Rodgers doesn’t get started until 2008. I have used blue/white for Manning, red/blue for Brady, gold/black for Brees, and green/gold for Rodgers.

[continue reading…]

{ 1 comment }

Trivia: Steve Young, Aaron Rodgers, or Tie?

Below are 31 questions, where the answer to each question is Steve Young, Aaron Rodgers, or tie. All stats are through 2018 and regular season only, unless expressly noted otherwise.

Post your score in the comments! The honor system will be strictly enforced.

1. Which quarterback won more games?

Click 'Show' For Answer Show

2. Which quarterback has a higher career winning percentage?

Click 'Show' For Answer Show

3. Which quarterback won the most Super Bowls as a starter?

Click 'Show' For Answer Show

4. Which quarterback won the most AP MVP awards?

Click 'Show' For Answer Show

5. Which quarterback earned the most 1st-team All-Pro selections from the Associated Press?

Click 'Show' For Answer Show

6. Which quarterback made the most Pro Bowls?

Click 'Show' For Answer Show

7. Which quarterback led the league in completion percentage most often?

Click 'Show' For Answer Show

8. Which quarterback led the league in TD/INT ratio most often?

Click 'Show' For Answer Show

9. Which quarterback led the league in passer rating most often?

Click 'Show' For Answer Show

10. Which quarterback led the league in ANY/A most often?

Click 'Show' For Answer Show

11. Which quarterback led the league in Passing Touchdowns most often?

Click 'Show' For Answer Show

12. Which quarterback had fewer (i.e., a better amount of) fumbles?

Click 'Show' For Answer Show

13. Which quarterback had more rushing TDs?

Click 'Show' For Answer Show

14. Which quarterback had more rushing yards?

Click 'Show' For Answer Show

15. Which quarterback had more rushing yards per carry?

Click 'Show' For Answer Show

The next set of questions cover the statistics produced by each quarterback relative to the other passers of his era. For Young, this looks at the 32 quarterbacks with the most pass attempts from 1985 to 1999; for Rodgers, the sample size is the 32 quarterbacks with the most pass attempts from 2005 to 2018.

16. Which quarterback ranks higher in ANY/A?

Click 'Show' For Answer Show

17. Which quarterback ranks higher in passer rating?

Click 'Show' For Answer Show

18. Which quarterback ranks higher in TD percentage?

Click 'Show' For Answer Show

19. Which quarterback ranks better (i.e., lower) in INT percentage?

Click 'Show' For Answer Show

20. Which quarterback ranks higher in Yards/Attempt?

Click 'Show' For Answer Show

21. Which quarterback ranks higher in 4th Quarter Comebacks?

Click 'Show' For Answer Show

22. Which quarterback ranks higher in Game Winning Drives?

Click 'Show' For Answer Show

23. Which quarterback had a better (i.e., lower) rank in sack rate?

Click 'Show' For Answer Show

24. Which quarterback ranked better TD/INT ratio?

Click 'Show' For Answer Show

25. Which quarterback ranked better in Yards/Completion?

Click 'Show' For Answer Show

Finally, let’s get to some playoff numbers. Which, like everything else here, isn’t easy.

26. Which quarterback won more playoff games?

Click 'Show' For Answer Show

27. Which quarterback had a better playoff winning percentage?

Click 'Show' For Answer Show

The next set of questions look at the quarterbacks with the 15 most pass attempts from ’87 to ’98 (for Young) and ’07 to ’16 (for Rodgers) in playoff games:

28. Which quarterback ranks better in Yards/Attempt?

Click 'Show' For Answer Show

29. Which quarterback ranks better in Passer Rating?

Click 'Show' For Answer Show

30. Which quarterback ranks better in rushing yards in the playoffs?

Click 'Show' For Answer Show

31. Which quarterback ranks better in playoff ANY/A?

Click 'Show' For Answer Show

How did you do?

{ 0 comments }

It was not a happy birthday for Rodgers

Aaron Rodgers threw 50 passes on Sunday, but only threw for 233 yards. That’s very un-Aaron Rodgers like, who entered the day as the active leader in career yards per pass attempt. For his career, Rodgers averaged 7.87 yards per attempt prior to Sunday, but after yesterday’s performance — a 4.66 average — his career average dropped to 7.84.

Was this the worst game of Rodgers’s career? He had a game where he averaged 0.00 yards per attempt on one pass, but I don’t think you want to count that. He averaged 2.67 yards/attempt is a game against the Patriots in 2006, but he didn’t start the game and he threw just 12 passes. Maybe you prefer the 22-pass game against the 2015 Broncos as the worst Y/A game of his career, since he picked up just 3.5 yards per pass. Then again, there’s also this game against the Bills in 2014, where he averaged 4.4 yards per attempt on 42 passes; that feels even worse than the Denver game.

Because of the large variance in pass attempts, it’s hard to figure out what’s the worst Y/A game of a player’s career. But here’s one method I like: if you remove game X from a player’s career, how much does his career Y/A change? The game that causes the biggest change could be considered the best or worst game of that player’s career.

And by this methodology, the game against the Cardinals yesterday was in fact the worst game of Rodgers’s career. His career yards/attempt average is 7.840. Remove the game where he threw 1 pass for 0 yards, and his career Y/A is 7.841.  If instead you removed the 12-pass Patriots game, Rodgers’s career average would be 7.851.  If you instead removed the Denver game, his career average would be 7.858.  If the one game from Rodgers’s career you had to remove was that Bills game, his career Y/A would rise to 7.867.

But if you want to get his career Y/A average to 7.87, then you need to take out yesterday’s game.  That’s the game that has lowered his career average the most.  Take a look: [continue reading…]

{ 0 comments }

Aaron Rodgers On Pace To Set Interception Record

Aaron Rodgers has thrown just one interception in 10 games this year. That’s 1 interception on a league-high 385 pass attempts. And this was it:

Damon Huard (2006) holds the current record for interception rate in a season at 0.4%; he threw 1 interception on 244 passes, so to beat him, a quarterback would need to either throw no interceptions and 224 passes (to qualify), 1 interception on more than 244 passes, 2 interceptions on more than 488 passes, or 3 interceptions on more than 672 passes. Rodgers has 1 interception so far this year on 385 pass attempts (0.26%!); he has room to throw one more interception this year and still win the crown, but he probably doesn’t have wiggle room to throw two more.

Josh McCown (2013) had 1 interception on 224 pass attempts (0.4%), putting him second all-time on the single-season list. Tom Brady (2016), Nick Foles (2013), Tom Brady (2010), Dak Prescott (2016), Steve DeBerg (1990), Sam Bradford (2016), and David Garrard (2007) are the only other players to throw fewer than 1 interception for every 100 passes in a season, min 14 pass attempts per team game. (Oh, and Drew Brees has a 0.3% interception rate this year, too: he has 1 interception on 304 passes).

Interceptions rates have plummeted, of course, so it’s hard to truly compare this season by Rodgers to some of the low interceptions of years past. Here’s the league average interception rate in every season since 1970:

Another thing that makes Rodgers’ 2018 interception rate so interesting, particularly compared to Brees, is that Rodgers has thrown a lot of incomplete passes. In fact, he’s thrown more than twice as many incomplete passes as Brees — 147 to 69. The graph below shows every player this season with an interception (no regular quarterback has zero interceptions). The X-Axis shows interceptions; the Y-Axis shows incomplete passes. Rodgers really stands out here, and while you didn’t need the help finding him, I colored his dot in Packers colors:

Rodgers is tied with Joe Flacco for the league lead in incomplete passes at 147, and yet he is also tied with Brees for the fewest interceptions among qualifying passers. That’s how extreme Rodgers has been this year. Consider that Rodgers has thrown an interception on just 0.7% of his incomplete passes; Brees ranks second with an interception on 1.4% of his passes, and nobody else has thrown an interception on fewer than 2.8% of interceptions. Huard in 2006 (1.0%) currently has the record for interception rate on incomplete passes, and that’s another mark Rodgers has in his sights.

It’s been an up-and-down year for Rodgers. For example:

  • His winning percentage is below .500, the worst of his career since his first year as a starter in 2008.
  • His touchdown rate is below 5.0% for the first time in his career.
  • His completion percentage is 62%, the second lowest of his career.

On the other hand, his sack rate is slightly better than his (not very good) career average, his yards/attempt is slightly better than (his remarkably good) career average, he’s averaging more passing yards/game than any season other than 2011, and he’s posting by far the best interception rate of his career, which has been littered with remarkable interception rates.

Rodgers entered the season with a remarkable TD/INT ratio, and it’s only gotten better.  He’s now at 4.20/1, easily the best in history (only Brady and Russell Wilson — both are at 3.02 to 1 — have more than 3 touchdown passes for every interception).  And while it’s been a rough year for Rodgers, he’s in position to set a new record in 2018.

{ 1 comment }

Who are the worst passing teams of the last three years? The Browns are the obvious and correct choice as the worst passing attack, and you won’t hear arguments from many if you include the Texans, Ravens, and 49ers in that group. Those four teams have all averaged 5.7 or fewer net yards per passing attempt since 2015, the simplest measure of passing efficiency.

But the fifth-worst team over the last three years is a shocker: it’s the Green Bay Packers. Yes, Aaron Rodgers missed most of last season (and Brett Hundley was terrible in his stead), but you may not remember that the Packers offense had a lot of struggles in 2015 playing without Jordy Nelson, who has been very instrumental to Rodgers’s success. Yes, Rodgers had his always glowing TD/INT ratio in 2015, but he ranked 32nd out of 36 qualifying passers in NY/A that season.  And Rodgers’s struggles creeped into September of 2016, too, before he finally turned things around.

Still, we think of him as Aaron freakin’ Rodgers, so it’s jarring to see that — even with half a season of Hundley — Green Bay ranks in the bottom five of any passing stat.  To be sure, NY/A has always been Rodgers’s weakest stat, since his TD rate and INT rate are what have buoyed his success. So let’s instead look at Adjusted Net Yards per Attempt, a stat that Rodgers remains the career leader in since 1970.

The graph below shows the trailing 16-game ANY/A average of the Packers passing attack over each 16 game period beginning with the 16th game of the 2008 season (Rodgers’s first as a starter).  The Packers line is in green and yellow; the league average is in black.  As you can see, things are not trending in the right direction, and even as of the middle of 2016, the T16G average was pretty ugly: [continue reading…]

{ 0 comments }

538: What Is Wrong With Aaron Rodgers?

Today at 538: What is wrong with Aaron Rodgers?

From 2008 to 2014, Rodgers averaged 7.34 yards per dropback,1 according to ESPN’s Stats & Information Group. Rodgers’s rate was the second-best during that time period and just 0.01 yards per dropback behind Peyton Manning’s. That sort of dominant play earned Rodgers two MVP awards and helped the Packers win a Super Bowl.

Recently, things haven’t gone quite so well. Rodgers has averaged 5.79 yards per dropback since the start of 2015. Since November of last year, the Packers are just 5-7. And Rodgers is in the middle of a cold spell prolonged enough to prompt his coach to chip in with a vote of confidence — never a great sign. But what’s to blame for the decline — a change in scheme? Rodgers’s skills? The steady physical destruction of his most trusted receivers? That’s tough to untangle, but we can give it a try.

You can read the full article here.

{ 4 comments }

Trivia: Longest Walkoff Passing Touchdown

Last night, Aaron Rodgers threw a walk-off, game-winning Hail Mary to Richard Rodgers to beat the Lions. According to Elias, it’s the longest game-winning Hail Mary in NFL history. And yet, perhaps most incredible part of the play was not how long it was, but high high it was:

Same ole lions 🦁

A video posted by Brandon Movitz (@brandicle) on

And here’s how I picture Lions fans during the middle of that pass.

But while this may have been the longest Hail Mary pass in history, it certainly wasn’t the longest walk-off passing touchdown in history.

Trivia hint 1 Show


Trivia hint 2 Show


Trivia hint 3 Show


Click 'Show' for the Answer Show

Also of note: this was the 9th touchdown pass, including playoffs, from Rodgers to Rodgers, which ties the same name passing touchdown NFL record.

{ 1 comment }

This week at the New York Times, we begin with a look at the impressive triplets being groomed in Oakland: quarterback Derek Carr, running back Latavius Murray, and wide receiver Amari Cooper.  They made a bit of history on Sunday:

Against the Browns, Carr threw for 314 yards, Murray rushed for 139 yards, and Cooper gained 134 receiving yards. It was the first time the Raiders had a 300-yard passer, a 100-yard rusher and a 100-yard receiver since 2010. But perhaps more impressive, this game marked only the 12th time since 1970 that any franchise had a 300-yard passer, a 100-yard rusher and a 100-yard receiver, with all three being 25 years or younger.

You can read the full article here.

Also, here is yet another ode to the greatness that is Aaron Rodgers.


It has been over three years since Rodgers lost a regular-season game at Lambeau, excluding a November 2013 game against the Bears in which he left the game because of an injury after two pass attempts. Putting aside that contest, the Packers have won 20 consecutive regular-season home games under Rodgers, with an average margin of victory of over 16 points.

The raw totals are mind-boggling. In Rodgers’s last 18 games at home (excluding that Bears game), he has completed 394 of 572 passes (68.9 percent) for an incredible 5,212 yards (9.1 yards per attempt), with 48 touchdowns and zero interceptions. During that time, the Packers have gone 17-1 and averaged 34.8 points per game, with the only loss coming in the 2013 playoffs to the San Francisco 49ers.

You can read the full article here.

{ 1 comment }

Guest Post: Marginal YAC, 2014 in Review

Adam Steele is back to discuss Marginal YAC, this time in the context of the 2014 season. You can view all of Adam’s posts here.


Manning is more of a downfield thrower than you think

Manning is more of a downfield thrower than you think

Back in September, I posted a three part series introducing Marginal Air Yards and Marginal YAC. Today, I’m going to update the numbers for 2014 and analyze some interesting tidbits from the just completed season. [1]A big thanks to Chad Langager at sportingcharts.com for helping me compile this data.

League-wide passing efficiency reached an all-time high in 2014 with a collective 6.13 Adjusted Net Yards per Attempt average. However, this past season was also the most conservative passing season in NFL history; 2014 saw the highest completion rate ever (62.6%), the lowest interception rate ever (2.5%), and also the lowest air yards per completion rate ever (5.91 Air/C). Passing yards were comprised of 51.4% yards through the air and 48.6% yards after the catch, the most YAC-oriented season in history. [2]Even though YAC data only goes back to 1992, I feel safe in using the phrase “all-time” with regard to YAC dependency. The offensive schemes of yesteryear emphasized downfield passing, which … Continue reading This trend shows no sign of reversing itself, so expect more of the same in 2015.

Here are the 2014 Marginal Air Yards (mAir) and Marginal YAC (mYAC) for quarterbacks with at least 100 pass attempts. The 2014 leader in Marginal Air Yards is…Peyton Manning? Yes, the noodle-armed, duck-throwing, over-the-hill Peyton Manning averaged 4.54 Air Yards per pass Attempt; given that the average passer on this list averaged 3.70 Air Yards per pass Attempt, this means Manning averaged 0.84 Air Yards per Attempt over average. Over the course of his 597 attempts, this means Manning gets credited with 500 marginal Air Yards, the most of any quarterback in the NFL. [continue reading…]

References

References
1 A big thanks to Chad Langager at sportingcharts.com for helping me compile this data.
2 Even though YAC data only goes back to 1992, I feel safe in using the phrase “all-time” with regard to YAC dependency. The offensive schemes of yesteryear emphasized downfield passing, which generated far less YAC than the short passing games of today.
{ 12 comments }

New York Times, Post Week-11 (2014): Time To R-E-L-A-X

This week at the New York Times, a look at the best quarterback in football.

When an athlete is having an excellent season, it is common for the home fans to break out into chants of “M.V.P.” from time to time. This year, in Green Bay, a five-letter cheer may be more appropriate.

“R-E-L-A-X.”

That is what quarterback Aaron Rodgers told Packers fans after a loss to Detroit dropped Green Bay’s record to 1-2. One could understand the fans’ frustration: The Packers scored 16 points and looked overmatched in an opening loss to the Seattle Seahawks; looked inconsistent in a comeback victory over the Jets; then scored 7 points in the Week 3 loss to the Lions. Of course, a bad stretch for Rodgers looks like a great stretch for just about every other quarterback: Through the three games he had still thrown five touchdown passes against one interception.

But the Packers’ offense was struggling: Green Bay ranked 27th in scoring through three games. The passing attack ranked 24th in yards per attempt and the team was tied for 26th in rushing yards. The Packers gained 223 yards of offense against the Lions, the fewest in a game under Rodgers since the 2008 season. The 7 points were the fewest in any game that Rodgers had started for the Packers other than another 7-point effort against the Lions in 2010 when Rodgers left the game with an injury in the first half. For a fan base used to dominant offenses, the 2014 Packers were off to an ugly start.

You can read the full article here.

{ 0 comments }

Predictions in Review: NFC North

During the 2013 offseason, I wrote 32 articles under the RPO 2013 tag. In my Predictions in Review series, I review those preview articles with the benefit of hindsight. Previously, I reviewed the AFC West, the NFC West, the AFC South, the NFC South, and the AFC North. Today, the NFC North.

The Detroit Lions will win more games in 2013, June 21, 2013

In 2012, Detroit finished 4-12, but they seemed like an obvious pick to have a rebound season. The Lions went 3-9 in games decided by 8 or fewer points that year, which was the worst mark in the league. Since such a poor record is usually a sign of bad luck rather than bad skill, Detroit wouldn’t need to do much to improve on their 4-win season. The Lions had 6.4 Pythagorean wins, and no team fell as far short of their Pythagorean record in 2012 as Detroit. There was one other reason I highlighted as to why Detroit would win more games in 2013: the Lions recovered only 33% of all fumbles that occurred in Detroit games. As a result, the team recovered 7.6 fewer fumbles than expected.

Of course, none of this was a surprise: Vegas pegged Detroit as an average team entering the season. And even though the Lions did finish 7-9, a three-win improvement wasn’t enough to save Jim Schwartz’ job. After a 3-9 record the year before, the 2013 Lions went 4-6 in games decided by 8 or fewer points, which included losses in the team’s final three games.  Detroit did improve when it came to fumble recoveries, but only slightly: the Lions recovered 42.6% of all fumbles in their games in 2013, which was 3.6 recoveries fewer than expected.

What can we learn: When it comes to records in close games and fumble recovery rates, we should expect regression to the mean.  Last year, the Colts (6-1) and Jets (5-1) had the best records in close games; Andrew Luck has been doing this for two years now, but no such benefit of the doubt should be given to the Jets. Meanwhile, Houston (2-9) and Washington (2-7) had the worst records in close games. All else being equal, we would expect both of those teams to improve on their wins total in 2014 (for the 2-14 Texans, it will take some work not to win more games in 2014; and, of course, such rebound seasons are already baked into the Vegas lines).

As far as fumble recovery rates, well, that’s one area where the Jets are hoping for some regression to the mean.

The 2012 Chicago Bears had the Least Strange Season Ever, August 2, 2013

Here’s what I wrote about the 2012 Bears:

The 2012 Bears played two terrible teams, the Titans and the Jaguars. Those were the two biggest blowouts of the season for Chicago. The Bears had five games against really good teams (Seattle, San Francisco, Houston, and the Packers twice): those were the five biggest losses of the season. Chicago had one other loss, which came on the road against the next best team the Bears played, Minnesota.

But the Bears didn’t just have a predictable season. That -0.89 correlation coefficient [between Chicago’s opponent’s rating and location-adjusted margin of victory] is the lowest for any 16-game season in NFL history. In other words, Chicago just had the least strange season of the modern era.

This post was not about predicting Chicago’s 2013 season but analyzing a quirky fact I discovered. The Bears struggled against the best teams in 2012, and that cost Lovie Smith his job. In 2013, Chicago’s season was much more normal; in fact, the Bears had a slightly “stranger” season than the average team.

The Bears did manage to defeat the Bengals and Packers (without Aaron Rodgers), but Chicago still finished below .500 against playoff teams thanks to losses to New Orleans, Philadelphia, and Green Bay (with Aaron Rodgers). After a 2-6 performance against playoff teams in 2012, I suppose a 2-3 record is an improvement. But the irony is that the reason Chicago’s season was less normal in 2013 wasn’t due to better play against the best teams, but because Chicago lost to Minnesota and Washington. In the first year post-Lovie, the Bears missed the playoffs because they lost to two of the worst teams in the league, causing them to miss out on the division title by one half-game. Here’s one stat I bet Lovie Smith knows: from 2005 to 2012, Chicago went 30-0 against teams that finished the season with fewer than six wins. As for which teams had the strangest and least strangest seasons in 2013? Check back tomorrow.

Can Adrian Peterson break Emmitt Smith’s rushing record?, August 3, 2013

What a difference a year makes. Eight months ago, the debate regarding whether Adrian Peterson could break Smith’s record was a legitimate talking point. After a “down” season with 1,266 yards in 14 games, nobody is asking that question anymore. Of course, Peterson never had much of a chance of breaking the record anyway, which was the point of my post. Not only had Smith outgained him Peterson through each of their first six seasons, and not only did Smith enter the league a year earlier than Peterson, but Emmitt Smith was also the leader in career rushing yards after a player’s first six seasons.

Peterson just turned 29 years old. He ranks sixth in career rushing yards through age 28, but Smith has a 1,119 yard advantage when it comes to rushing yards through age 28. Barry Sanders has them both beat, of course, but he retired after his age 30 season. The problem for Peterson? He needs to run for 8,241 yards during his age 29+ seasons to break Smith’s record. The career leader in yards after turning 29 is Smith with 7,121 yards.

What can we learn: Unless Peterson finds the fountain of youth, Smith’s record won’t be challenged for a long, long time.

Witnesses to Greatness: Aaron Rodgers Edition, August 30, 2013

In late August, I wondered if we had taken Rodgers’ dominance for granted. After all, he had a career passer rating of 104.9, the best ever. Then in 2013, he produced a passer rating of … 104.9, the fifth best mark among qualifying passers.

Passer rating stinks, as we all know, but Rodgers is dominant in nearly every metric. If we break passer rating down into its four parts we see:

  • Entering 2013, Rodgers was the career leader in completion percentage. Drew Brees now holds a 0.1% edge over Rodgers in this category. Rodgers completed 66.6% of his passes last year, the 5th best mark of 2013.
  • Rodgers was the career leader in interception rate entering 2013, and still holds that crown. Believe it or not, his 2.1% interception rate last year ranked only 12th.
  • With a 5.9% touchdown rate in 2013 (5th best), he remains the active leader in touchdown percentage. Everyone ahead of him on the career list began their career before 1960.
  • Rodgers was the active leader in yards/attempt prior to 2013, and then he had another dominant year by producing an 8.7 average (2nd best). He’s now widened his lead in this metric and should remain the active leader for the foreseeable future.

What can we learn: That Rodgers is the man? Of course, this year we got to see that first-hand. The Packers went 6-3 in Rodgers’ 9 starts and 2-4-1 without him, but remember, he threw just two passes in his Bears start, which the Packers lost. Count that as a non-Rodgers game, and Green Bay went 6-2 with him and 2-5-1 without him. From there, one might infer that he added 3.5 wins to the Packers last year, tied for the 4th most ever from a quarterback relative to his backups.

The only area where Rodgers struggles is with sacks, and it’s worth remembering that all of his other rate stats are slightly inflated because they do not include sacks in the denominator. He’s still the man, of course, but sacks, era adjustments, and the fact that he isn’t done producing top seasons is why he “only” ranked 12th and 14th on these lists.

{ 1 comment }
The Packers had a rough Movember without this guy

The Packers had a rough Movember without this guy..

Green Bay started the season 5-2 and seemed on its way to another playoff berth. But in the first quarter of the team’s eighth game, Aaron Rodgers broke his collarbone. The Packers lost that game (technically on Rodgers’ ledger as the starter), and have struggled ever since. In his stead, Seneca Wallace went 0-1, Scott Tolzien went 0-1-1, and then Matt Flynn got a chance to lose on Thanksgiving against the Lions before salvaging a win against the Falcons last Sunday.

Unsurprisingly, Green Bay is much worse without Rodgers. Using his .625 winning percentage as a starter this year, we might presume that the Packers would have won 3.125 out of the team’s five games that he’s missed. Instead, Green Bay has won 1.5 out of five games; that means Rodgers would have provided 1.625 Wins Above the Other QBs on the roster. (If we did not count the Bears game as a Rodgers game, then Rodgers would have provided 2.79 Wins Above the Other QBs.) Rodgers has been ruled out for the Packers’ pivotal week 15 showdown with the Cowboys; a loss there would bring Rodgers’ value up to 2.25 Wins Above the Other Green Bay QBs.

Where does that rank all time? The biggest discrepancy belongs to the 2002 Rams. The Rams started 0-4 under reigning NFL AP MVP Kurt Warner, and then lost the team’s next game when Jamie Martin started in relief of an injured Warner. For the sixth game, the team turned to Marc Bulger, who led the 0-5 team on a five game winning streak before suffering a finger injury just as the starting quarterback was ready to return. Warner started games 11 and 12, but another injury forced Martin started game 13; St. Louis lost all three games. Bulger then returned and won his 14th start. At that point in the year, St. Louis was 6-0 under Bulger and 0-8 under everyone else. In game 15 against Seattle, Bulger was hurt on the St. Louis’ fourth play from scrimmage; Martin came in and the team lost 30-10. The final game of the year was a meaningless one and started by Scott Covington, although Martin took most of the snaps in a victory over the 49ers.

All told, St. Louis went 6-1 in Bulger starts (including the Seahawks game), while the other Rams quarterbacks posted a 1-8 record. Since we would project a 1-8 team to win just 0.78 out of 7 games, Bulger is given credit for being 5.22 Wins Above the Other QBs for the team.

The table below shows all quarterbacks from 1950 to 2013 to produce at least 2 Wins Above the Other QBs for their team. The formula to calculate WAOQBs is simply the difference between the winning percentages with and without the starting quarterback multiplied by the number of starts by the quarterback or by the other quarterbacks on the team, whichever number is smaller. [continue reading…]

{ 6 comments }

Leader in Fu Manchus among active quarterbacks (sorry, Mark)

Leader in Fu Manchus among active quarterbacks (sorry, Mark).

Let’s be honest: we all know Aaron Rodgers is great, so we don’t spend much time talking about him. Debating his ability is pointless, so we instead spend countless hours discussing Tony Romo’s intangibles, Tim Tebow’s throwing motion, Colin Kaepernick’s tattoos, and Joe Flacco’s eliteness. Talk radio dies when it discusses Aaron Rodgers: debating the Packers quarterback is as fun as watching paint dry and as illuminating as asking if water is wet.

But we’re doing a disservice to us all when we ignore how great Rodgers is. I mean, we spend lots of time chronicling the feats of Adrian Peterson and Calvin Johnson — why not Rodgers?

One way to measure Rodgers’ greatness is to look at passer rating. Now we know that passer rating is wildly overrated, so perhaps you shouldn’t be too impressed to hear that Rodgers has the highest passer rating in history. But consider: Rodgers has a career 104.9 passer rating, well ahead of Steve Young, who is second at 96.8. Chad Pennington sits at #13 on the career passer rating list (an example of why this metric is one I don’t use), but Young is closer to Pennington (90.1) than he is to Rodgers. But there’s an even better way to show Rodgers’ dominance in this statistic.

Passer rating is made up of four metrics. Let’s take a look at how Rodgers ranks in those four categories:
[continue reading…]

{ 40 comments }

I was on vacation last week, so I provided just a bare bones set of NFL playoff predictions. Technically, my picks went 4-0 on Wildcard Weekend, but that doesn’t count for much when you pick the favorite in every game. With a little more time on my hands, here’s an in-depth preview of Saturday’s games. Tomorrow I’ll be previewing Sunday’s action.

Baltimore Ravens (10-6) (+9.5) at Denver Broncos (13-3), Saturday 4:30PM ET

Manning looks for to win another Super Bowl

Manning points to his glove dealer.

Most of the signs in this game point squarely in the favor of Peyton Manning and the Broncos. Baltimore has wildly underachieved on the road the last few seasons, and in Denver does not seem like the optimal place for that trend to reverse itself. From 2002 to 2010, Manning went 8-0 against the Ravens, including a 2-0 mark in playoff games. If you double his numbers in those games (to approximate a 16-game season), Manning would have thrown for 4,044 yards and 28 touchdowns against just 12 interceptions, while averaging 7.8 Y/A and 7.9 AY/A to go with a 65.6% completion rate and a 97.7 passer rating. Manning was similarly lethal in Denver’s win over the Ravens in Baltimore earlier this year.
[continue reading…]

{ 1 comment }

Is this a thinly-veiled Brady/Manning post?

Is this a thinly-veiled Brady/Manning post?

Last weekend, I looked at career rushing stats in wins and losses; today I will do the same but for quarterbacks.

I looked at all games, including playoffs, from 1960 to 2011, for all quarterbacks with at least 5,000 career passing yards over that time period. The table below lists the following information for each passer:

– His first year (or 1960, if he played before 1960) and his last year (or 2011, if still active)
– All the franchises he played for (which you can search for in the search box)
– His number of career wins, and his touchdown rate, interception rate, yards per attempt and Adjusted Yards per Attempt (which includes a 20-yard bonus for touchdown passes and a 45-yard penalty for interceptions) in wins [1]Unfortunately, I excluded sack data from this study due to its general unavailability for most of the covered time period.
– His number of career losses, and his touchdown rate, interception rate, yards per attempt and Adjusted Yards per Attempt in losses

The table is sorted by AY/A in wins; unsurprisingly, Aaron Rodgers — who is the career leader in that metric — tops this table, too. In fact, Rodgers is also the leader in AY/A in losses. Note that this table includes all games played by the quarterback, not just his starts.

RkPlayerYearsTeamsPYDWinTD%_WINT%_WY/A_WAY/A_WLossTD%_LINT%_LY/A_LAY/A_L
1Aaron Rodgers2005--2011gnb19147497.6%1.3%8.78.3274.3%2.5%7.46.4
2Matt Schaub2004--2011atl-htx17936485.3%1.7%8.78.1533.5%3.3%7.25.8
3Tony Romo2005--2011dal21666606.6%2.1%8.77.9434.3%3.4%75.5
4Kurt Warner1998--2009ram-nyg-crd36296816.8%2.2%8.77.8573.3%4.4%7.25.3
5Daunte Culpepper1999--2009min-mia-rai-det25133457.1%2.2%8.77.8643.3%4%6.95.1
6Bob Berry1965--1975min-atl9197327.4%2.3%8.67.7364.2%7.4%7.13.8
7Steve Young1985--1999tam-sfo364501256.8%1.7%8.37.6602.9%4.2%7.25.3
8Philip Rivers2004--2011sdg26105696.2%2.3%8.57.6394%3.1%7.36
9Ben Roethlisberger2004--2011pit29729905.7%2.2%8.47.6383.7%4.9%7.25
10John Friesz1990--2000sdg-was-sea-nwe8699195%1%7.87.5382.6%4%5.84
11Bart Starr1960--1971gnb22810996.6%2.9%8.67.5412.4%5.9%6.74.1
12Don Meredith1960--1968dal17750518.5%3.3%8.87.5503.5%6%6.23.6
13Drew Brees2001--2011sdg-nor43722976.5%1.7%87.4663.4%3.7%6.75.1
14Ken O'Brien1984--1993nyj-phi25598565.8%1.7%87.4722.1%3.6%6.34.7
15J.P. Losman2004--2011buf-rai-mia6271175.8%1.5%7.97.4282.5%4.4%6.14.1
16Trent Green1997--2008was-ram-kan-mia28794595.3%2.1%8.27.3633.6%3.8%7.15.5
17Rob Johnson1995--2003jax-buf-tam-was-rai5947204.8%1.5%7.97.3252.8%3.6%6.75.1
18Chad Pennington2000--2010nyj-mia19241465.1%1.2%7.77.3493.2%4.1%6.64.9
19Boomer Esiason1984--1997cin-nyj-crd38520896.6%2.4%8.27.31033.3%4.4%6.54.6
20Neil Lomax1981--1988crd23156486.4%2.1%8.17.3593%3.3%6.65.2
21David Garrard2002--2010jax16489455.3%1.4%7.87.3442.7%3.4%6.44.9
22Matthew Stafford2009--2011det8220138.1%1.8%7.97.2173.4%4.4%6.34.4
23Joe Montana1979--1994sfo-kan463231406.4%2.2%8.17.2602.7%3.4%6.34.9
24Eddie LeBaron1960--1963dal53311112.5%5.5%9.47.2314.7%8.7%7.13.3
25Peyton Manning1998--2010clt602171506.3%1.9%87.2773.9%4.1%6.95.2
26Ed Brown1960--1965chi-pit-clt7723357.7%5.8%9.77.2332.9%8.8%6.52.6
27Wade Wilson1981--1998min-atl-nor-dal-rai18605666.1%2.6%8.37.2632.4%5.3%6.23.9
28Jay Cutler2006--2011den-chi18637426.6%2.2%8.17.2382.7%4.6%6.54.5
29Josh Freeman2009--2011tam8898175.6%1.8%7.97.2242.8%4.6%6.14.1
30Tom Brady2000--2011nwe452641406.1%1.6%7.87.2433.6%4.2%6.34.5
31Matt Moore2007--2011car-mia5137176.2%1.8%7.87.1192.8%5%6.24
32Chris Chandler1988--2004clt-tam-crd-ram-oti-atl-chi29212725.9%2.6%8.27.11053.1%4.4%6.44.4
33Len Dawson1960--1975cle-kan301121058.7%3.6%8.67.1643.2%6.3%6.63.8
34Joe Flacco2008--2011rav15348494.6%1.2%7.67.1243%4.4%5.94
35Trent Edwards2007--2010buf-jax6019144%1.6%7.77.1222%4.3%5.73.8
36Jeff Garcia1999--2009sfo-cle-det-phi-tam26894635.4%1.3%7.57.1683.4%3.1%6.45.1
37Ken Anderson1971--1986cin341591006.2%2.4%87.1922.7%4.7%6.74.7
38Rudy Bukich1960--1968pit-chi7865307.5%3.5%8.57353.5%8.6%62.3
39Troy Aikman1989--2000dal367911054.8%2.1%7.97762.1%4.1%64.2
40Damon Huard1998--2008mia-nwe-kan6349204.9%1.1%7.47242%4.3%5.84
41Jim Everett1986--1997ram-nor-sdg35957665.7%2.6%8.17973.2%4.2%6.54.6
42Roger Staubach1969--1979dal254911066.1%2.5%87443.5%6.3%6.73.9
43Bert Jones1973--1982clt-ram18589476.4%3.1%8.27583.6%4.6%6.34.3
44Frank Reich1985--1998buf-car-nyj-det6858398.8%2.1%7.77393.3%4.3%6.34.4
45Jeff Hostetler1986--1997nyg-rai-was17464705.5%1.9%7.77402.3%4.1%6.34.5
46Dan Fouts1973--1987sdg45165915.9%3.2%8.36.9953.1%5.5%7.14.7
47Bill Kenney1980--1988kan17374375.9%2.5%86.9493.2%4.2%6.54.6
48Y.A. Tittle1960--1964sfo-nyg11542408.9%4.3%8.76.9232.5%6.9%5.72.7
49Mark Brunell1994--2011gnb-jax-was-nor-nyj33905994.8%1.8%7.66.9913.2%2.9%6.24.9
50Aaron Brooks2000--2006nor-rai20822415.8%1.6%7.56.9543.3%4.1%6.44.7
51Patrick Ramsey2002--2008was-nyj-den5929165.2%2.3%7.86.9243.1%3.8%5.84.2
52Scott Mitchell1992--2001mia-det-rav-cin15925406%2.1%7.76.9452.6%4.6%5.93.9
53Randy Wright1984--1988gnb7106125.4%3.4%8.36.9332.2%5.5%5.93.5
54Rich Gannon1987--2004min-was-kan-rai30434915.5%1.5%7.46.9713%3.6%6.24.6
55Earl Morrall1960--1976det-nyg-clt-mia17529927.9%4.8%8.96.9444.2%6.9%6.63.6
56Sonny Jurgensen1960--1974phi-was31546747.7%3.9%8.46.9794.5%4.9%6.84.7
57Steve DeBerg1978--1998sfo-den-tam-kan-mia-atl34752725.4%2.3%7.86.91143.2%4.9%6.44.2
58Steve Beuerlein1988--2003rai-dal-crd-jax-car-den24317645.6%2.3%7.86.8663.4%4.2%6.85
59Fran Tarkenton1961--1978min-nyg488061316.8%2.8%86.81173.6%5.5%6.54.1
60John Brodie1960--1973sfo30783786.7%3.3%8.26.8793.3%6%6.13.5
61Doug Flutie1986--2005chi-nwe-buf-sdg15209485.2%2.4%7.86.8452.9%3.9%64.3
62Johnny Unitas1960--1973clt-sdg323351076.3%3.8%8.46.8592.7%7.3%6.53.2
63Joe Namath1965--1977nyj-ram28299686.4%4%8.56.8713.3%6.8%6.53.5
64Matt Ryan2008--2011atl14832436.1%1.9%7.56.8222.4%3%6.14.8
65Craig Erickson1992--1997tam-clt-mia7625184.8%2.7%7.96.8343.2%3.9%6.54.8
66Marc Bulger2002--2009ram23758424.9%2.6%7.86.8573.1%3.3%6.85.4
67Matt Cassel2005--2011nwe-kan11769425.1%2%7.66.8303.5%3.3%5.74.3
68Tom Flores1960--1969rai-buf-kan11960408.3%3.8%8.36.8442.8%6.7%5.72.8
69Phil Simms1979--1993nyg351411025.3%2.5%7.76.7723%4.3%6.44.6
70Derek Anderson2006--2011cle-crd-car9148215.5%2.4%7.76.7322.7%4.6%5.73.6
71Michael Vick2001--2011atl-phi18889655.8%2.4%7.76.7512.8%3.4%6.34.9
72Brett Favre1991--2010atl-gnb-nyj-min776932016.3%2.2%7.66.71253.2%4.9%6.44.3
73Craig Morton1965--1982dal-nyg-den291431186.7%3.7%8.26.7822.6%6.5%6.23.4
74Steve Pelluer1985--1990dal-kan6870173.3%2.2%7.66.7262.9%4.7%6.94.8
75Dan Marino1983--1999mia658711555.7%2.4%7.76.71054.1%3.9%6.85.1
76Donovan McNabb1999--2011phi-was-min408591065.4%2%7.46.7742.9%2.6%6.15
77Dave Krieg1980--1998sea-kan-det-crd-chi-oti400421136.7%3%7.96.7983%4.4%6.54.5
78Warren Moon1984--2000oti-min-sea-kan521951085.5%2.6%7.76.61103.1%4.2%6.84.9
79Jim Kelly1986--1996buf393301106.1%3.2%86.6673.1%4.6%6.64.6
80John Hadl1962--1977sdg-ram-gnb-oti339411037%3.7%8.26.6923.3%7.8%6.12.7
81Bernie Kosar1985--1996cle-dal-mia25254674.8%1.9%7.46.6663.1%3.4%6.65.1
82Jake Delhomme1999--2011nor-car-cle-htx22822655.5%2.9%7.86.6453.1%4.2%6.64.8
83Vince Evans1977--1995chi-rai9511377.1%3.8%8.26.6572.4%6%6.33.6
84John Elway1983--1998den564391635%2.6%7.76.6922.8%3.9%6.34.6
85Drew Bledsoe1993--2006nwe-buf-dal459461025.1%1.9%7.46.6992.4%4.2%5.94
86Jason Campbell2006--2011was-rai14417323.8%1.7%7.36.6393.3%2.7%6.45.3
87Pete Liske1964--1972nyj-den-phi5170167%2.6%7.66.6232.2%8.2%5.92.3
88Jeff George1990--2001clt-atl-rai-min-was28603485.5%2.7%7.76.6853.2%2.9%6.65.4
89Alex Smith2005--2011sfo13038334.4%1.1%76.6392.9%4.3%64.1
90Jim Zorn1976--1987sea-gnb-tam21249524.9%2.9%7.86.6682.8%5.4%6.13.7
91Lynn Dickey1971--1985oti-gnb23914526.5%4.4%8.46.6763.5%6.6%74.1
92Jon Kitna1997--2011sea-cin-det-dal30104565.7%2%7.46.6862.8%4.7%6.34.3
93Eric Hipple1981--1989det11009306.3%3%7.86.6361.8%5.5%6.44
94Bob Griese1967--1980mia265591087.4%3.9%8.16.5623.5%6.4%6.43.5
95Chris Miller1987--1999atl-ram-den19789375.7%2.4%7.56.5633.6%4.2%6.34.5
96Gus Frerotte1994--2008was-det-den-cin-min-mia-ram21666585.1%2.7%7.66.5602.5%4.1%6.24.4
97Matt Hasselbeck1999--2011gnb-sea-oti35891915.1%2.4%7.56.5803%3.4%6.34.8
98Tarvaris Jackson2006--2011min-sea7239274.5%3.1%7.86.5232.8%3.4%5.84.3
99Jeff Blake1992--2005nyj-cin-nor-rav-crd-phi-chi21711425.1%2.1%7.46.5773.6%3.6%6.34.7
100Tony Eason1983--1990nwe-nyj11703355.1%2.8%7.76.5313.3%3.4%6.75.2
101Jim Harbaugh1987--2000chi-clt-rav-sdg27194784.8%2.1%7.36.5932.3%3.6%6.24.6
102Don Majkowski1987--1996gnb-clt-det12906344.8%2.8%7.76.5432.6%4.2%64.2
103Gary Hogeboom1982--1989dal-clt-crd9598315.1%2.6%7.56.5282.7%6.1%6.74
104Joe Theismann1974--1985was26988956%2.8%7.66.5592.4%5.1%6.34.1
105Randall Cunningham1985--2001phi-min-dal-rav32405986.1%2.6%7.66.5733.1%3.6%6.34.7
106Byron Leftwich2003--2010jax-atl-pit-tam10439305%1.6%7.16.5312.6%3.5%6.24.7
107Tony Banks1996--2005ram-rav-was-htx15315435.2%2.2%7.46.5522%3.7%5.94.3
108Bobby Hebert1985--1996nor-atl22331635.2%3%7.76.5553.5%5%6.24.1
109Greg Landry1968--1984det-clt-chi16100556.7%3.9%8.16.5652.5%4.7%6.34.2
110Eli Manning2004--2011nyg30095775.5%2.2%7.36.4543.7%4.5%6.74.7
111Jay Fiedler1998--2005min-jax-mia-nyj12499505%2.6%7.56.4292.5%5.9%63.4
112Stan Humphries1989--1997was-sdg18538554.4%2.3%7.46.4392.2%5.1%5.93.7
113Jim Plunkett1971--1986nwe-sfo-rai28175855.6%3.4%7.96.4823.2%7.1%6.43.2
114Elvis Grbac1994--2001sfo-kan-rav17492614.8%2.4%7.46.4393.1%4.4%6.24.3
115Richard Todd1976--1985nyj-nor21636515.2%3.6%7.96.4703.2%7%6.23.1
116Steve Grogan1975--1990nwe27457806.7%4.3%8.26.4713.5%7.2%6.83.6
117Frank Ryan1960--1970ram-cle-was15833669.3%4.4%8.26.4424%6.1%6.63.9
118Carson Palmer2004--2011cin-rai25659505.9%2.9%7.66.4593.8%3.5%6.95.3
119Shaun Hill2005--2011min-sfo-det6209185.5%1.8%7.16.4163.2%2.8%6.35.1
120Mark Rypien1988--2001was-cle-ram-phi-clt20249585.7%3.3%7.76.4472.9%3.6%6.54.9
121Bubby Brister1986--2000pit-phi-nyj-den-min14801475.7%2.3%7.36.4511.9%4.3%5.93.9
122Kerry Collins1995--2011car-nor-nyg-rai-oti-clt42478924.4%2.1%7.26.41132.7%4%6.14.3
123Steve McNair1995--2007oti-rav330681004.6%2.1%7.26.4722.6%3.4%6.44.9
124Charlie Batch1998--2011det-pit10610405.2%2.8%7.56.3373.1%3.4%6.65.1
125Bill Nelsen1963--1972pit-cle15004466.5%4.1%86.3433%7.2%6.53.4
126Charley Johnson1961--1975crd-oti-den24410687.3%4.7%8.36.3703%5.9%6.33.6
127Steve Bartkowski1975--1986atl-ram24916605.9%3.1%7.66.3733.5%5.2%6.54.3
128Sam Bradford2010--2011ram567684.1%1.5%6.96.3181.9%2.5%5.64.5
129Gary Danielson1977--1988det-cle14000424.9%2.9%7.56.3433.5%5.3%6.74.4
130Brian Sipe1974--1983cle23896606%3.2%7.66.3623%5.4%6.23.8
131Jay Schroeder1985--1994was-rai-cin-crd20854715.2%2.7%7.46.3502.7%5.3%6.64.3
132Virgil Carter1968--1976chi-cin-sdg5127215.7%3%7.56.3242.1%4.7%5.63.5
133Tommy Kramer1977--1990min-nor25651645.9%2.8%7.46.3662.9%5.7%6.23.7
134Brad Johnson1994--2008min-was-tam-dal304571024.6%2.1%7.16.2702.9%3.9%6.24.5
135Kelly Holcomb1995--2007tam-clt-cle-buf-min645395.5%3.4%7.76.2294%4.5%6.54.6
136Quincy Carter2001--2004dal-nyj6491204.7%2.2%7.16.2181.8%5.3%5.93.5
137Ryan Fitzpatrick2005--2011ram-cin-buf10936226.2%2.4%7.26.2342.9%4.5%5.93.9
138Neil O'Donnell1991--2003pit-nyj-cin-oti23399725%2%76.2582.5%2.3%6.35.4
139James Harris1969--1979buf-ram-sdg8479445.8%4.2%86.2341.8%6.6%63.1
140Brian Griese1998--2008den-mia-tam-chi19440535.2%2.8%7.46.2403.3%4.2%6.64.7
141Terry Bradshaw1970--1983pit318221257%4.3%86.2623%7.3%6.12.9
142Bill Munson1964--1979ram-det-sea-sdg-buf12940416.4%2.6%7.26.2582.8%5%6.13.9
143Steve Tensi1966--1970sdg-den5558158.5%4.4%86.1293.5%5.7%5.83.3
144Jeff Kemp1981--1991ram-sfo-sea-phi6403286.7%2.9%7.36.1261.9%5.5%6.33.8
145Ty Detmer1993--2001gnb-phi-sfo-cle-det6499184.9%2.5%7.16.1242.7%4.6%6.54.4
146Billy Wade1960--1966ram-chi11390346.1%3.5%7.66.1333.8%6.3%6.43.7
147Dave M. Brown1992--2000nyg-crd10304294.1%2.5%7.26.1421.9%4.2%5.84
148Mark Sanchez2009--2011nyj10364305.1%2%6.96.1222.9%5%6.24
149Joe Ferguson1973--1990buf-det-tam-clt30631836.4%3.1%7.46.11073%5.8%6.13.5
150Norm Snead1961--1976was-phi-min-nyg-sfo30797576.9%4.3%7.96.11143.5%6.7%6.73.7
151Dennis Shaw1970--1975buf-crd6347125.9%5.3%8.46.1342.8%8.1%6.52.9
152Vince Ferragamo1977--1986ram-buf-gnb12564357.1%3.7%7.66.1422.9%7.1%6.53.4
153Jake Plummer1997--2006crd-den30593744.7%2.5%7.16.1752.9%4.8%6.44.3
154Tommy Maddox1992--2005den-ram-nyg-pit8754275.9%3.2%7.46.1282.6%5.3%6.13.7
155Daryle Lamonica1963--1974buf-rai210821047.8%4.6%86.1373%7.3%62.8
156Kyle Orton2005--2011chi-den-kan14532364.5%1.9%6.86.1353%3.1%6.45
157Roman Gabriel1962--1977ram-phi29780875.7%2.6%7.16.1793.2%4%5.84.1
158Bob Lee1969--1980min-atl-ram5416605.9%4.8%8.16.1241.2%6.2%52.3
159David Carr2002--2010htx-car-nyg-sfo14433323.4%2.2%76.1612.7%3.4%6.24.7
160Jack Trudeau1986--1995clt-nyj-car10494253.2%2.4%7.16432.3%5.2%5.83.5
161Steve Fuller1979--1986kan-chi7454334%3.5%7.56291.9%4%6.24.5
162Danny White1976--1988dal242431245.8%4%7.76594%5.3%6.74.4
163Archie Manning1971--1984nor-oti-min23911374.4%3.2%7.461103.1%5.1%6.34.1
164Ken Stabler1970--1984rai-oti-nor305791106.6%4.6%7.96643%7.3%6.53.3
165Doug Williams1978--1989tam-was18108495.4%2.8%7.26453.1%4.8%6.54.4
166Joe Pisarcik1977--1984nyg-phi5552254.6%4.1%7.86322.1%5.7%5.73.1
167Jim McMahon1982--1996chi-sdg-phi-min-crd-gnb19260864.5%3.3%7.46402.6%3.8%6.44.8
168Milt Plum1960--1969cle-det-ram-nyg13335466.9%4.9%8.16403.1%6%6.33.7
169Ron Jaworski1974--1989ram-phi-mia-kan29859895.4%2.9%7.26793.4%4.8%6.54.4
170Rodney Peete1989--2004det-dal-phi-was-car16636554.3%3.4%7.56482.2%4.3%6.54.6
171Vinny Testaverde1987--2007tam-cle-rav-nyj-dal-nwe-car475531025.3%3.1%7.361373.3%4.5%6.74.7
172Billy Kilmer1961--1978sfo-nor-was21555886.7%3.7%7.56813.3%5.9%6.13.5
173Tim Couch1999--2003cle11131225.5%3.2%7.36402.7%4.3%64.1
174Erik Kramer1987--1999atl-det-chi-sdg16336384.9%2.4%76483.4%4.1%6.54.7
175Trent Dilfer1994--2007tam-rav-sea-cle-sfo21489685.3%2.7%7.16652%5.1%63.7
176Mike Pagel1982--1993clt-cle-ram9593224.5%2.6%7.16532.9%4.9%63.8
177Kordell Stewart1995--2005pit-chi-rav15490763.5%2.1%6.85.9542.7%5.6%5.53
178Chad Henne2008--2011mia7114143.6%1.7%6.65.9202.4%4.6%6.74.7
179Jim Hart1966--1984crd-was35156935.7%4%7.65.91032.9%5.5%6.23.8
180Vince Young2006--2011oti-phi9102354.5%3%7.15.9272.2%4.9%6.54.3
181Josh McCown2002--2011crd-det-rai-car-chi6998154.2%1.6%6.55.9362.9%5.2%6.23.9
182Mark Malone1981--1989pit-sdg-nyj10733296.3%3%7.15.8442.3%5.9%5.83.2
183Babe Parilli1960--1969rai-nwe-nyj18778647.1%4.1%7.55.8473.2%7.5%5.92.5
184Don Strock1974--1988mia-cle5913377.1%3.6%7.35.8304.5%7.3%6.63.3
185Dick Wood1962--1966sdg-nyj-rai-mia7153177.1%3.4%7.25.8282.6%7.3%5.32.1
186Shaun King1999--2004tam-crd5057195.9%2.3%6.75.8161.1%4.1%5.53.7
187Pat Haden1976--1981ram10024414.4%2.9%75.8263.1%7.1%6.43.3
188Bobby Douglass1969--1978chi-sdg-nor-gnb6493166.2%3.5%7.25.8572.1%5.8%5.12.5
189Cotton Davidson1960--1968kan-rai11451306.5%4.1%7.55.7402.9%7.2%6.33.1
190Steve Bono1985--1999min-pit-sfo-kan-gnb-ram-car10576494.6%1.8%6.45.7262.5%3.7%5.74.1
191Marc Wilson1980--1990rai-nwe14526395.8%4%7.45.7422.8%5.8%6.53.9
192Billy Joe Tolliver1989--1999sdg-atl-oti-kan-nor10760245%2.6%6.85.7533%4.1%6.14.4
193Rick Mirer1993--2003sea-chi-nyj-sfo-rai11969273.9%2.4%6.65.6521.8%4.4%5.53.5
194Steve Ramsey1970--1976nor-den6437235.4%5.9%8.15.6282.4%6.5%6.33.4
195Jacky Lee1960--1969oti-den-kan6191309%7%8.55.5294%6.9%6.63.6
196Hugh Millen1987--1995ram-atl-nwe-den644082.3%4.2%7.45.5302.4%3.6%6.85.2
197Jim Ninowski1960--1969det-cle-was-nor6953334.3%4.5%7.55.5272.6%7.4%6.22.9
198Dave Wilson1981--1988nor7007164.2%5.2%7.85.5373.1%5.5%6.23.8
199Kyle Boller2003--2011rav-ram-rai8931304.1%1.7%6.25.5362.6%4.7%5.73.6
200Joey Harrington2002--2007det-mia-atl14693274.4%2.2%6.45.5552.5%3.8%5.53.9
201Todd Blackledge1983--1989kan-pit5366225.2%3.4%6.95.5221.7%5.2%5.32.9
202Mike Tomczak1985--1999chi-gnb-cle-pit16963793.8%3.9%7.15.5593.4%5.3%6.64.2
203Mike Livingston1968--1979kan11295374.4%3.2%6.85.5522.4%5.7%6.23.7
204Danny Kanell1996--2003nyg-atl-den5328145.3%2.5%6.55.5252.2%4%4.93.2
205Steve Dils1980--1988min-ram-atl5816183.5%2.6%6.55.4292.4%3.6%5.74.1
206Jack Thompson1979--1984cin-tam5329155.3%1.8%6.15.4303.5%6.2%6.33.6
207Kent Graham1992--2001nyg-crd-pit-was7801274.4%1.6%65.4331.8%3.1%5.74.3
208David Woodley1980--1985mia-pit9203384.4%3.5%6.95.4243%7.4%6.33.1
209Randy Johnson1966--1976atl-nyg-was-gnb8329147.8%4.4%7.25.4583.2%7.6%6.33
210Rex Grossman2003--2011chi-htx-was11015304.7%3.3%6.85.4272.3%4.3%6.24.3
211Jim Miller1995--2002pit-chi6410203.9%2.9%6.65.3183%3.2%5.64.3
212Dan Pastorini1971--1983oti-rai-ram-phi19469624.6%4.2%7.15.3812.5%6.1%5.42.7
213Paul McDonald1980--1984cle5550123.8%3.4%6.85.3232.8%5.1%74.7
214George Blanda1960--1975oti-rai220291428.4%6%7.85.3793.9%8%6.12.5
215Jack Kemp1960--1969sdg-buf22256714.6%5.2%7.55.2462.2%7.1%6.23
216David Whitehurst1977--1983gnb6205216.1%5.3%7.45.1301.1%5.4%5.73.3
217Zeke Bratkowski1960--1971chi-ram-gnb8005304.7%5.5%7.55.1453.5%8.9%6.62.7
218Steve Spurrier1967--1976sfo-tam6878486.4%4.9%7.15.1532.2%5.2%5.43.1
219Joe Kapp1967--1970min-nwe6746266.6%6.2%7.75.1262.2%8.1%5.72.1
220Bob Avellini1975--1984chi7288304.2%5.9%7.55362.3%6.8%5.72.7
221Frank Tripucka1960--1963den7676135.1%5.9%7.55293.3%6.7%5.22.3
222Pete Beathard1964--1973kan-oti-crd-ram8544404.5%5.3%7.24.9342.5%7.3%5.62.4
223Gary Cuozzo1963--1972clt-nor-min-crd7688474.6%3.9%6.54.9352.9%5.7%63.5
224Al Dorow1960--1962nyj-buf5732145.7%5%6.94.8184.7%8.5%5.82.1
225Steve Walsh1989--1999dal-nor-chi-ram-tam-clt8248273.9%3.2%6.24.8342.4%4.5%5.93.9
226Mike Phipps1970--1981cle-chi10806504.5%3.7%6.44.8511.7%8.4%5.31.6
227Scott Brunner1980--1985nyg-crd6843163.7%3.7%6.34.7293%5.8%6.23.6
228Jack Concannon1964--1975phi-chi-gnb-det6270274.6%4.3%6.54.6322.5%6.8%5.12.1
229Mike Taliaferro1964--1972nyj-nwe-buf5241198.2%4.7%6.34.4412.2%7.2%5.11.9

[continue reading…]

References

References
1 Unfortunately, I excluded sack data from this study due to its general unavailability for most of the covered time period.
{ 0 comments }

In 2006, I took a stab at ranking every quarterback in NFL history. Two years later, I acquired more data and made enough improvements to merit publishing an updated and more accurate list of the best quarterbacks the league has ever seen. In 2009, I tweaked the formula again, and published a set of career rankings, along with a set of strength of schedule, era and weather adjustments, and finally career rankings which include those adjustments and playoff performances.

If nothing else, that was three years ago, so the series was due for an update. I’ve also acquired more data, enabling me to tweak the formula to better reflect player performance. But let’s start today with an explanation of the methodology I’m using. To rank a group of players, you need to decide which metric you’re ordering the list by. I’ll get to all of the criteria I’m not using in a little bit, but the formula does use each of the following: pass attempts, passing touchdowns, passing yards, interceptions, sacks, sack yards lost, fumbles, fumbles recovered, rush attempts, rushing yards and rushing touchdowns. Most importantly, the formula is adjusted for era and league.

Two of the best quarterbacks ever.

So where do we begin? We start with plain old yards per attempt. I then incorporate sack data by removing sack yards from the numerator and adding sacks to the denominator [1]I have individual sack data for every quarterback since 1969. For seasons before then, I have team sack data going back to 1949. For seasons before 1950, I ignored sacks; for seasons between 1950 … Continue reading. To include touchdowns and pass attempts, I gave a quarterback 20 yards for each passing touchdown and subtracted 45 yards for each interception. This calculation — (Pass Yards + 20 * PTD – 45 * INT – Sack Yards Lost) / (Sacks + Pass Attempts) forms the basis for Adjusted Net Yards per Attempt, one of the key metrics I use to evaluate quarterbacks.

For purposes of this study, I did some further tweaking. I’m including rushing touchdowns, because our goal is to measure quarterbacks as players. There’s no reason to separate rushing and passing touchdowns from a value standpoint, so all passing and rushing touchdowns are worth 20 yards and are calculated in the numerator of Adjusted Net Yards per Attempt. To be consistent, I also include rushing touchdowns in the denominator of the equation. This won’t change anything for most quarterbacks, but feels right to me. A touchdown is a touchdown.
[continue reading…]

References

References
1 I have individual sack data for every quarterback since 1969. For seasons before then, I have team sack data going back to 1949. For seasons before 1950, I ignored sacks; for seasons between 1950 and 1969, I gave each quarterback an approximate number of sacks, giving him the pro-rated portion of sacks allowed by the percentage of pass attempts he threw for the team. While imperfect, I thought this “fix” to be better than to ignore the data completely, especially for years where one quarterback was responsible for the vast majority of his team’s pass attempts.
{ 13 comments }