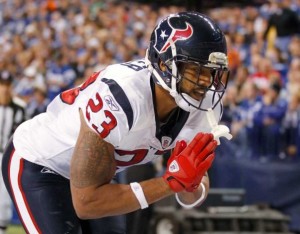
From 2010 to 2014, Foster played in 70 games. But in two of those games in 2013, injuries limited him to just 9 combined snaps. And in the season finale in 2014, a hamstring injury caused him to exit after 10 snaps. In those three games, Foster had a total of 9 carries for 34 yards. [continue reading…]
During the 2013 offseason, I wrote 32 articles under the RPO 2013 tag. In my Predictions in Review series, I review those preview articles with the benefit of hindsight. Previously, I reviewed the AFC West and the NFC West. Today, the AFC South, beginning with a straightforward case in Tennessee.
Can Kenny Britt become the next great wide receiver?, July 9, 2013Spoiler alert: Kenny Britt did not become the next great wide receiver, at least in 2013 (apparently, I still can’t quit him). Britt is an easy player to fall in love with, if you ignored the warning signs. He was just 20 years old when he played in his first NFL game in 2009. In 2010, he led all players in yards per route run according to Pro Football Focus, but his raw numbers underhwlemed because the Titans were a run-heavy team and Britt missed 30% of the season with a hamstring injury. In 2011, he matched his elite YPRR production, but a torn ACL/MCL tear ended his season after 94 pass routes.
He struggled in 2012, but I was willing to write that off due to recovering from the ugly knee injury, additional hamstring and ankle injuries, and a first-year starter in Jake Locker. That set up 2013 as a season where I thought Britt had great breakout potential. I interviewed Thomas Gower, of Total Titans and Football Outsiders, and asked him his thoughts. Gower was more pessimistic than I was about Britt, and for good reason.
As it turned out, Britt never seemed quite right mentally (in more ways than one); he struggled with drops and was eventually dropped behind Justin Hunter and Kendall Wright on the depth chart. He finished the year with 11 catches for only 96 yards and no touchdowns. In late December, Britt said he would definitely be a #1 wide receiver somewhere in 2014, which means I’m susceptible to falling into the Britt trap again. [continue reading…]
I don’t know if that’s true, but let’s investigate. First, I’m only giving a running back credit for his additional carries after his 15th carry of the game. So an 18-carry game goes down as a “3” and a 25 carry game is a “10.” Using this scoring system, Arian Foster had the highest number of “Carries over 15” from last season, with 117. Such a list mostly corresponds to the number of overall rushing attempts for a player, but the exceptions could be revealing.
[continue reading…]
I’m short on time today, which means a lot of data and not so much theory. One of the more underrated statistics to measure running backs is the number of first downs they produce. I don’t like using Yards per Carry for running backs because that metric is pretty sensitive to outliers. But by using rushing first downs, perhaps we can smooth things out.
We know that the value of a touchdown is about 20 yards, but what is the value of a rushing first down? Being short on time, I took the easy way out. Pro-Football-Reference has produced Expected Points Added for each team’s running game going back to 2000. I decided to run a regression on the team level to best predict rushing EPA based on four rushing statistics. The R^2 was 0.77, but more importantly, here was the best fit formula:
EPA = -16.6 -0.58*Rush + 0.067*Rush_Yd + 1.43*Rush_TD + 1.08*Rush_FD
What interests me is the relationships between the variables. Rushing touchdowns are considered 21.3 times as valuable as rushing yards, which happens to fit in well with our previous assumptions. But more importantly, this tells us that a rushing first down is worth 16.1 rushing yards. That seems pretty high to me, and I reserve the right to adjust this later, but for now, let’s adjust down and say the value of a rushing first down is 15 yards. Now what?
[continue reading…]
[House-keeping note: I’ve added the Salary Cap Calculator to the gray header tabs at the top of each page, so you can now easily get there no matter what page you’re on at Football Perspective.]
A quick look at Arian Foster‘s statistics over the last three years paints a picture of a player in decline:
| Year | G | Rsh | RshYd | RTD | YPC | YPG | C/G | Rec | RecYd | YPR | TD | YScm | RRTD |
|---|---|---|---|---|---|---|---|---|---|---|---|---|---|
| 2010*+ | 16 | 327 | 1616 | 16 | 4.9 | 101.0 | 20.4 | 66 | 604 | 9.2 | 2 | 2220 | 18 |
| 2011* | 13 | 278 | 1224 | 10 | 4.4 | 94.2 | 21.4 | 53 | 617 | 11.6 | 2 | 1841 | 12 |
| 2012* | 16 | 351 | 1424 | 15 | 4.1 | 89.0 | 21.9 | 40 | 217 | 5.4 | 2 | 1641 | 17 |
Foster’s declined in rushing yards per game and yards per carry over the last two years, while his value in the receiving game fell off a cliff in 2012. One could reasonably conclude that Foster simply isn’t the same player he used to be, and that he could drop off even more in 2013. But while the traditional statistics tell one story, what do the advanced metrics say?
[continue reading…]
Yesterday, I previewed Saturday’s games with um, mixed results (skip the Denver-Baltimore preview and just read the San Francisco-Green Bay breakdown twice). Let’s take another crack at it by examining Sunday’s matchups.
Seattle Seahawks (11-5) (+1) at Atlanta Falcons (13-3), Sunday, 1:00PM ET
Once again, Atlanta is tasked with facing a dominant wildcard team. Is this the year Matt Ryan finally silences his critics?Atlanta is only a one-point favorite, just the seventh time a home team has been given such little respect this late in the season since 2000. Home teams are 3-3 when underdogs or small favorites over that span in the divisional conference championship rounds, although one of those losses came by the Falcons in 2010 against the Packers when Atlanta was a 1.5-point favorite. But let’s focus on these two teams, because the stats might surprise you.
Russell Wilson edges Matt Ryan in Y/A (7.9 to 7.7), AY/A (8.1 to 7.7), and passer rating (100.0 to 99.1), despite having a significantly worse set of receivers. Ryan does have the edge in NY/A (7.0 to 6.8) but the two are deadlocked in ANY/A at 7.0. Both quarterbacks led four 4th quarter comebacks this year, and Wilson led 5 game-winning drives while Ryan led six. Considering one quarterback has Roddy White, Julio Jones, and Tony Gonzalez, and the other is a 5’10 rookie, I consider this pretty remarkable.
[continue reading…]


