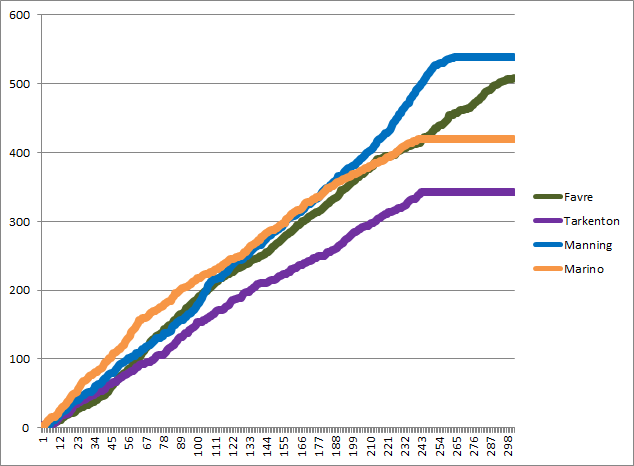
There have been four passing touchdown kings in the last 40 years: Fran Tarkenton, Dan Marino, Brett Favre, and Peyton Manning. I thought it would be fun to plot the number of career touchdown passes each player had on the Y-Axis after each game of their career (shown on the X-Axis):
Disclaimer: Quarterbacks don’t have records, teams do. A quarterback’s “record” is simply shorthand for saying “the record of a quarterback’s teams in all playoff games started by that quarterback.” Please forgive me for using that shorthand for the remainder of this post.
Eight years ago, Doug Drinen wrote a fun post in advance of the 2006 AFC Championship Game. At the time, Peyton Manning had gone 0-2 in playoff games against Tom Brady, so Doug looked at quarterbacks who had gone winless against another particular quarterback in the postseason.
Manning wound up beating Brady in that game, and evened his record against Brady in the 2013 playoffs. No pair of quarterbacks have ever met as starters five times in the playoffs, so Brady/Manning are tied for the most playoff meetings. Joining them on Saturday will be Brady and Joe Flacco. This weekend’s game will be the fourth time since 2009 that the Ravens have traveled to Foxboro in the postseason, and Brady and Flacco have been under center for each game. [continue reading…]
Jerry Rice’s best year came with Steve Young, not Joe Montana. Randy Moss set the touchdown record with Tom Brady, but his best year in receiving yards was with Daunte Culpepper. Lynn Swann’s best year was with Terry Bradshaw, but John Stallworth’s top season in receiving yards came with Mark Malone. James Lofton’s best season was with Lynn Dickey, Isaac Bruce’s best year was with Chris Miller, Torry Holt’s top season came with Marc Bulger, and Tim Brown’s top year was with Jeff George.
This is little more than random trivia, but this site does not have aspirations for March content higher than random trivia. In unsurprising news, 25 different players had their best season in receiving yards (minimum 300 receiving yards) while playing with Brett Favre. That includes a host of Packers, but also a couple of Jets and Vikings, too (including one future Hall of Famer).
After Favre, Marino is next with 22 players, and he’s followed by Manning and Fran Tarkenton (20). From that group, I suspect that Tarkenton might surprise some folks. That is, unless they realized that he was the career leader in passing yards when he retired and played for five years with the Giants and thirteen with Minnesota.
The table below shows every quarterback who was responsible for the peak receiving yards season of at least five different receivers (subject to the 300 yard minimum threshold). For each quarterback, I’ve also listed all of his receivers. [continue reading…]
Therefore, if a pitcher has a high BABIP, sort of like an NFL team with a lot of turnovers, he’s probably been unlucky. And good things may be coming around the corner. A high BABIP means a pitcher probably has an ERA higher than he “should” and that his ERA will go down in the future. In fact, you can easily recalculate a pitcher’s ERA by replacing the actual BABIP he has allowed with the league average BABIP. And that ERA will be a better predictor of future ERA than the actual ERA. At least, I think. Forgive me if my baseball analysis is not perfect.
Are you still awake? It’s Monday, and I’ve brought not only baseball into the equation, but obscure baseball statistics. Let’s get to the point of the post by starting with a hypothesis:
Assume that it is within a quarterback’s control as to whether he throws a completed pass on any given pass attempt. However, if he throws an incomplete pass, then he has no control over whether or not that pass is intercepted.
[continue reading…]
Yesterday, I explained the methodology behind the formula involved in ranking every quarterback season in football history. Today, I’m going to present the career results. Converting season value to career value isn’t as simple as it might seem. Generally, we don’t want a player who was very good for 12 years to rank ahead of a quarterback who was elite for ten. Additionally, we don’t want to give significant penalties to players who struggled as rookies or hung around too long; we’re mostly concerned with the peak value of the player.
What I’ve historically done — and done here — is to give each quarterback 100% of his value or score from his best season, 95% of his score in his second best season, 90% of his score in his third best season, and so on. This rewards quarterbacks who played really well for a long time and doesn’t kill players with really poor rookie years or seasons late in their career. It also helps to prevent the quarterbacks who were compilers from dominating the top of the list. The table below shows the top 150 regular season QBs in NFL history using that formula, along with the first and last years of their careers, their number of career attempts (including sacks and rushing touchdowns), and their career records and winning percentages (each since 1950). For visibility reasons, I’ve shown the top 30 quarterbacks below, but you can change that number in the filter or click on the right arrow to see the remaining quarterbacks.
[continue reading…]


