≡ Menu

Paxton Lynch’s Broncos Career Is Nearly Over

Paxton Lynch was the 26th pick in the 2016 Draft, but it looks like his Broncos (and perhaps NFL) career is coming to a close. As a rookie, he sat on the bench behind Trevor Siemian, who was taken with the 25t0h pick in the 2015 Draft and vastly outplayed Lynch during the summer of ’16 to win the job. And in 2017, Lynch missed time with shoulder and ankle injuries, but he also was the third most productive QB on a bottom-5 passing offense, looking worse than both Siemian and Brock Osweiler. Lynch has now fallen to third on the team’s depth chart even with Siemian and Osweiler gone: Case Keenum was brought in to be the team’s starter, and Chad Kelly — the 253rd pick in the ’17 Draft — has moved ahead of Lynch on the depth chart.

That’s right: the Broncos 1st round pick in 2016 has now been beaten out by 7th round picks from both the 2015 and 2017 drafts.

Let’s assume Lynch finishes 2018 with zero touchdown passes.  That would give him 4 career touchdown passes through three seasons.  The graph below shows quarterbacks drafted from 1992 to 2015 plus Lynch, with the X-Axis representing draft slot and the Y-Axis showing touchdown passes through three years.  Lynch is the red dot. [continue reading…]

{ 1 comment }

Yes.

Take a look at the Broncos pass defense this year, compared to the Broncos pass defense last year:

Year Tm G Cmp Att Cmp% Yds TD TD% Int Int% Y/A AY/A Y/C Y/G Rate Sk Yds NY/A ANY/A
Sk% EXP
2016 DEN 14 260 483 53.8 2562 10 2.1 12 2.5 5.8 5.1 10.7 183.0 67.5 40 221 4.9 4.2 7.6 72.16
Year Tm G Cmp Att Cmp% Yds TD TD% Int Int% Y/A AY/A Y/C Y/G Rate Sk Yds NY/A ANY/A
Sk% EXP
2015 DEN 16 344 573 60.0 3193 19 3.3 14 2.4 6.2 5.7 10.3 199.6 78.8 52 351 5.1 4.7 8.3 59.89

Three years ago, I looked at the Seattle pass defense and calculate how many standard deviations above average the Seahawks were. At the time, I compared them to an average of the other 31 defenses rather than an average of all 32 defenses, including themselves. I don’t know if there’s a right or wrong answer there, but I’m going to use the latter methodology today, which will explain why the numbers are slightly different.

Anyway, Seattle was 2.80 standard deviations above average in ANY/A allowed in 2013. That’s because Seattle’s pass defense allowed 3.19 ANY/A, while the league average was 5.89 ANY/A. That’s a difference of 2.70 ANY/A, and the standard deviation among the 32 pass defenses that year was 0.97. Divide 2.70 by 0.97, and you see that Seattle was 2.80 standard deviations above average.

The 2016 Broncos? They are allowing just 4.25 ANY/A. That is over a full yard “worse” than Seattle, but worse needs to be put in quotes. For starters, the league average is 6.25 ANY/A this year; in addition, the rest of the league is bunched together. The standard deviation for the 32 pass defenses is 0.74 ANY/A. That means the Broncos have a Z-Score of 2.69 standard deviations better than average (here, negative is better).

That puts Denver as the 5th best pass defense, by this metric, since 1970: [continue reading…]

{ 11 comments }

538: Is Denver’s Pass Defense Even Better? 

Today at 538: yes, really, Denver’s pass defense is even better this year.

Football studies have generally shown that offenses are more consistent from year to year than defenses, and regression to the mean is always a key part of any analysis for a historically great unit. As a result, we wouldn’t expect Denver’s 2016 pass defense to be anywhere near as good as the 2015 one. And that’s exactly what you see with most of the other teams on the list above.

The other pass defenses on the top 20 list above were, on average, 1.53 net yards per attempt better than average against the pass in their dominant season; however, in their first eight games of the following season, they were just 0.52 NY/A better than average. That’s a sign of how difficult is it for dominant defenses to sustain that level of excellence over a long period. Defensive backs and pass rushers are two of football’s most health-dependent roles, and even one player losing a step or leaving in free agency can sink a unit. But so far this season, the Broncos have been even better that last season, jumping from 1.30 NY/A better than league average to 1.73.

You can read the full article here.

{ 9 comments }

For years, Peyton Manning kept ruining Gary Kubiak’s life. From 2006 to 2010, both men were in the AFC South, and Kubiak never managed more than 9 wins or a division title. He finished his time in Houston with a 61-64 record, before joining the Broncos in 2015. That makes Kubiak just the 7th head coach who had a losing career record prior to the season in which his team won the Super Bowl.

The coach with the worst career record before winning it all? That would be Bill Walsh, who held an 8-24 record entering the 1981 season. [continue reading…]

{ 4 comments }

The 2012-2015 Broncos: What Can We Learn?

Here was something I tweeted a few days before Super Bowl 50:

The 2012 Broncos were awesome. Peyton Manning, while not having the scorched-earth campaign he would enjoy a year later, still led the NFL in ANY/A and Total QBR, and received 19.5 of 50 votes for Most Valuable Player (Adrian Peterson picked up the other 30.5). The Broncos finished 2nd in points and 4th in yards, while on defense, the team ranked 4th in points and 2nd in yards. Perhaps more impressively, the Broncos defense ranked 1st in Net Yards per Attempt, and in the top three in rushing yards, rushing touchdowns, and yards per carry.

The Broncos did have an easy schedule, but they were one of four teams that stood head and shoulders above the rest of the NFL, along with the Patriots, Seahawks, and 49ers. Of course, a Joe Flacco pass to Jacoby Jones, combined with a Rahim Moore blunder, wound up ruining the dream season. [continue reading…]

{ 53 comments }

538: 2013/2015 Broncos and the 1982/1984 Dolphins

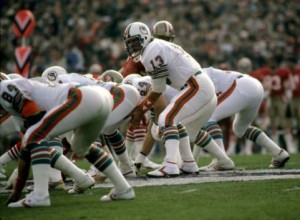
The 2013 Broncos had one of the greatest offenses of all time and made it to the Super Bowl.  Two years later, Denver is again in the Super Bowl, on the strength of a superb defense.  How rare is that?  Well, the only team that really fits that profile is the Miami Dolphins, who made the Super Bowl in 1982 and 1984, and had a similar swing (albeit in the other direction).

Over at 538, I look at the  similarities between those two teams, and other teams that have swung from an extreme offensive/defensive identity to an extreme defensive/offensive identity just two years later.  A special thanks to Adam Harstad, who was the one who gave me the simple but creative methodology to display these results.

In the strike-shortened 1982 season, the Miami Dolphins made it to the Super Bowl on the strength of an incredible defense that allowed the NFL’s fewest yards, first downs, passing yards and net yards per pass attempt. The offense wasn’t very good, but the defense — known as the Killer Bees because the last names of six starters began with the letter B — guided the team to the Super Bowl, as Miami ranked second in points allowed and third in takeaways.

Just two years later, the Dolphins were back in the Super Bowl, and once again, the team was one-dimensional. But, remarkably, it was the offense that was the dominant unit, as Miami led the NFL in points, yards, first downs and net yards per pass attempt, while a second-year quarterback named Dan Marino set single-season records for passing yards and passing touchdowns.

You can read the full article here.

{ 8 comments }

Pre-Week 19: How Good Does The Broncos D Need To Be?

This week at the Washington Post, a look at how good the Broncos defense needs to be to win the Super Bowl.

This year’s Denver offense posts a minus-8.8 percent DVOA rating, which would make it the worst offense to make the Super Bowl since 1989.  If we useestimated DVOA ratings, only the ’79 Rams (-13.1 percent) were worse.  The worst offense by any Super Bowl champion prior to 1989, using estimated DVOA, was the 1980 Raiders, at -7.7 percent.  Therefore, by either measure, the Broncos would be an incredible outlier to even make the Super Bowl, much less win it.

The 2000 Ravens’ profile looks remarkably similar to this year’s Broncos teams.  That Baltimore squad had an offensive DVOA of minus-8.1 percent, and a defensive DVOA of minus-23.8 percent; the 2015 Broncos have an offensive DVOA of minus-8.8 percent, and a defensive DVOA of minus-25.8 percent.  That makes this Broncos team look like a carbon copy of the ’00 Ravens, despite Baltimore having a journeyman Trent Dilfer at quarterback, with the Broncos having arguably the greatest quarterback of all time.

You can read the full article here.

{ 1 comment }

This week at the New York TimesPeyton Manning is now being carried by his defense.

The Denver Broncos have been synonymous with offensive success since Peyton Manning joined the team in 2012. In Manning’s first three years in Denver, the Broncos scored 1,569 points, 100 more than any other team in football. But this year, the Broncos are 5-0 despite ranking 30th in offensive yards, 27th in yards per pass, and 31st in yards per carry. That’s because Denver’s success has been powered by a dominant defense.

It starts with the defense’s production on a per-play basis, where the defense leads all teams. The Broncos are allowing just 4.3 yards per play to opposing offenses; if that holds, it would be the lowest average allowed by any defense since the 2009 Jets. The Broncos are allowing a league-low 4.7 yards per pass attempt, thanks in part to an incredible 22 sacks, the most by any defense through five weeks. And there is no weakness to this unit, as the rush defense ranks in the top quarter of the league in both yards and yards per carry. Situation defense? The Broncos are covered there, too, as Denver’s third down defense has been the best in the league, allowing first downs just 29.7% of the time.

You can read the full article here

I also wrote this week about Devonta Freeman on Thursday at the Times.

In his first 18 N.F.L. games, Freeman had never gained more than 84 yards from scrimmage. In his first three starts, he has gained at least 149 yards in each one, making him the first Falcons player since Jamal Anderson (1998) with such a streak. He is currently the N.F.L. leader in yards from scrimmage (645) and total touchdowns (eight). And he is one of the best bargains in the N.F.L., too, costing the Falcons only $631,106 in salary cap dollars.

You can read the full article here.

{ 3 comments }

Over at Five Thirty Eight, I look at whether the Broncos pass offense, or the Seahawks pass defense, is more immune from regression to the mean.

 As a general rule, elite offenses are further from league average than great defenses, so offensive regression isn’t as likely as defensive regression. It helps, too, that research has shown offenses to be more consistent from year to year than defenses. All else being equal, we would expect the Broncos to be the more likely team to repeat last year’s brilliant performance.But all else isn’t equal. Denver produced 2013’s record-breaking numbers while playing defenses from the AFC South and the NFC East; those will be replaced this year by the AFC East and the NFC West, divisions that present much more formidable challenges. That’s a significant change.

According to Football Outsiders, Denver played the third-easiest slate of opposing defenses in 2013. Based purely on adjusted net yards per attempt, the average defense Manning faced last year was 0.44 ANY/A below average, and that’s after adjusting those defenses’ ratings for the fact that they played Manning. Only Alex Smith and Robert Griffin III faced more cupcakes. Last year, Manning didn’t Omaha against a single defense that ranked in the top eight in strength-of-schedule ANY/A; this year, he’s set to face six opponents that ranked in the top eight in that metric in 2013.

You can read the full article here.

{ 20 comments }

Super Bowl XLVIII Denver/Seattle Preview

Before we get to my preview, I want to point you to some excellent Super Bowl previews I saw this week:

Last week, I went into the film room and recapped the preseason matchup between these two teams. Today, I’m going to analyze the six — yes, six! — different matchups to watch in Super Bowl XLVIII.

Seattle Pass Defense vs. Denver Pass Offense

I’ve written many glowing articles about the Seattle pass defense, and we all know about the Broncos record-setting offense. Super Bowl XLVIII is the greatest offense/defense showdown since 1950 and the greatest passing showdown ever. Denver’s pass offense is historically great, and Seattle’s pass defense is historically great. But beyond being a great defense, there are reasons to think the Seahawks present a particularly tough challenge for Manning and company. [continue reading…]

{ 4 comments }

SB XLVIII Is The Best Offense/Defense Super Bowl Ever

This year, the Broncos averaged 37.9 points per game, 14.5 points more than league average. Seattle, meanwhile, allowed just 14.4 points per game, 9.0 points better than league average. That means this is a true clash of the titans in one sense: when the Broncos offense is on the field against the Seattle defense, the two units will have been a combined 23.4 (difference due to rounding) points better than average during the regular season.

As it turns out, that’s the greatest disparity between any two units in Super Bowl history. One nice aspect of comparing a team’s offense to an opponent’s defense is that you don’t need to adjust for era, since a high (or low) scoring environment will equally help and hurt each pairing. You can simply subtract Seattle’s 14.4 PPG average from Denver’s 37.9 PPG average to get that same 23.4 PPG difference. The table below shows the differential between each team offense and opposing defense — measured by points scored and points allowed per game — for each of the 48 Super Bowls. That means the Denver/Seattle battle will replace Super Bowl I for the greatest offense/defense showdown in Super Bowl history.

Here’s how to read the table below. In 1966, the Kansas City offense faced the Green Bay defense in Super Bowl I (hyperlinked to the boxscore at PFR). The Chiefs quarterback was Len Dawson, and Kansas City averaged 32 points per game that year. Meanwhile, the Packers allowed only 11.6 points per game, providing a difference of 20.4 points. In Super Bowl I, however, the Chiefs lost to the Packers, 35-10. This is the first time since Super Bowl XXV that the number one scoring offense is facing the number one ranked scoring defense, but frankly, the Bills/Giants showdown pales in comparison to this one. The difference there was nearly ten points narrower than the Denver/Seattle disparity. [continue reading…]

{ 11 comments }

Championship Game Preview: New England at Denver

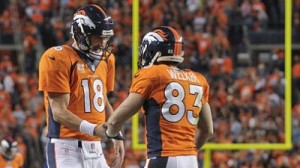
These two men look important

These two men look important.

Someone needs to say it. I know, I know, it’s Manning/Brady XV. But someone needs to remind people that Peyton Manning threw 30 more touchdown passes than Tom Brady in 2013. He threw for over 1,000 more yards. He threw one less interception. He was sacked 22 fewer times. And did I mention that he threw 30 more touchdowns? If you’re not into stats, Brian Burke has Manning providing 5.83 extra wins this year, compared to 3.82 for Brady. At some point, the analysis should move beyond “a game between two of the greatest quarterbacks ever” and recognize these things, right?

Let’s cut off the Patriots fans before they can begin typing in Boston accents: the fact that Manning’s 2013 numbers dwarf Brady’s 2013 numbers does not mean Manning’s career >>> Brady’s career. And it doesn’t even mean (although it strongly implies) that Manning was a better quarterback in 2013 than Brady was. There’s no doubt that Denver’s supporting cast, at least on offense, is much better than New England’s. Manning has Brady’s favorite target from last year, Wes Welker, along with Demaryius Thomas, Eric Decker, and Julius Thomas. Brady has dealt with a very inexperienced set of receivers following massive turnover. The Patriots have had to replace Welker, Rob Gronkowski, Aaron Hernandez, and Danny Woodhead with Julian Edelman, 12 games worth of Danny Amendola, 8 games of Shane Vereen (although he’ll be around on Sunday), 7 games of Gronkowski (he won’t be around on Sunday), and Aaron Dobson and Kenbrell Thompkins. Each quarterback is down a star tackle (Ryan Clady, Sebastian Vollmer) but has an All-Pro caliber guard (Louis Vasquez, Logan Mankins).

But whatever the reason for the discrepancy, one conclusion is inescapable: this is not a meeting of equal passing attacks. On one hand, you have one of the greatest passing offenses ever. On the other, you have an above-average passing offense. And that’s the real story. The Broncos averaged 10 more points per game than New England, while Manning (as representative of the Denver passing attack) averaged 2.75 more adjusted net yards per attempt than Brady (as representative of the Patriots passing attack). [continue reading…]

{ 3 comments }

Cap Space Versus Production For DEN/NE/SF/SEA

It’s not much of a stretch to say that the Patriots, Broncos, 49ers, and Seahawks, and are four of the best organizations in the NFL. Over the last two years, these four teams are the only to win 23 games in the regular season or 26 games if you include the playoffs. In the salary cap era, being an excellent team means managing the salary cap well. And, broadly speaking, managing the cap well means finding good values for cheap and making sure the players you spend a premium on deliver commensurate production.

So is that true for New England, Denver, San Francisco, and Seattle? The invaluable Jason Fitzgerald of Over the Cap has salary cap data for each team in the league, which can answer half the problem. But how do we measure production? I decided to use the ratings from Pro Football Focus, since the website provides a rating of every player on every team (although I excluded special teamers from my analysis today).

One note about PFF data, which comes from Nathan Jahnke, a writer at the website. As he explained to me, PFF’s ratings are not necessarily designed for comparisons across positions. For each position, zero is average, but the magnitude a player’s rating can get to is somewhat dependent on the position they play. For example, PFF has never had a safety over a grade of +30, while five 3-4 DEs hit that mark in 2013. For my purposes today, this is not a big concern — it just means view the graphs with an understand that these are not designed to be the perfect way to compare a player. But in general, I think they work well. (And, of course, don’t think that just because Brandon Mebane has a higher rating than Russell Wilson that it means PFF thinks Mebane is a more valuable player.)

To avoid people using my graphs to scrub data and steal the hard work put in by by Over The Cap and Pro Football Focus in assembling the salary cap data and player grades , I have decided not to label either axis with salary information or player ratings. Just know that the X-axis (that’s the horizontal one) is for salary, and players on the left are cheap and players on the right are expensive. The vertical or Y-axis shows the PFF grades from worst (on the bottom) to best on top). Note: to compare across teams, I have used the exact same dimensions for both axes across all four graphs. [continue reading…]

{ 13 comments }

By all accounts, this was an underwhelming quartet of games played on The Best Weekend in Football. Last year, the division round gave us an incredible Russell Wilson comeback where the Seahawks scored three fourth quarter touchdowns before falling short against the Falcons and the Peyton ManningJoe FlaccoRahim Moore classic. Seattle won this year but in boring fashion, and Broncos fans undoubtedly prefer this year’s rendition of Neutral-Zone-Infraction to last year’s heartbreak. In 2011, the 9-7 Giants pulled off the rarest of upsets: outclassing the 15-1 Packers and winning a game as huge underdogs while managing to look like the better team in the process. The day before, Alex Smith lead the 49ers in a home upset over the Saints in one of the more exciting playoff games of our generation. In 2009 and 2010, the brash Jets won road games as heavy underdogs in convincing fashion against the Chargers and Patriots. This was the halcyon era of the Mark SanchezRex Ryan Jets, also known as years 3 and 2 Before The Buttfumble. In 2008, the Ravens (over the Titans), Eagles (Giants), and Cardinals (Panthers) all won as road underdogs. The year before, the Giants shocked the Cowboys before that was our Tony Romo-adjusted expectation, and the Chargers won as 11-point underdogs in Indianapolis preventing a Tom BradyPeyton Manning upset (no such road bump this year).

In some ways, the results this weekend were a good thing. Perhaps we will remember this as the year the division round of the playoffs felt like eating a salad – a bit unsatisfying at the time, but better for us in the long term. No one would complain about seeing more Andrew Luck — actually, maybe some of us would — but getting an AFC Championship Game of Manning and Brady just feels right. We have become so accustomed to seeing fluky teams like the Chargers make runs that we’ve forgotten that it can be very good when the results match our intuition. Back in April I said that the Patriots and Broncos were on a collision course for the AFC Championship Game, although my reasoning wasn’t exactly spot on (“the key to their success is keeping Rob Gronkowski, Aaron Hernandez, and Danny Amendola healthy, although the Patriots will be fine as long as two of them are on the field.”)

But it’s not as if I had some special insight: as noted by Will Brinson, the 49ers, Seahawks, Patriots, and Broncos were the four teams with the best preseason odds. No one would complain about seeing more from the Saints and Panthers, but I don’t think many would argue with the idea that the 49ers and Seahawks are the two most talented teams in the league. A few years from now, there won’t be much we remember from the division round. But I have a feeling it set up two conference championship games that will be very memorable. [continue reading…]

{ 9 comments }

Division Preview: San Diego at Denver

I’m not going to do it again. This time last year, I thought I wrote a very good preview of the Denver/Baltimore game. I looked at both teams, decided that Denver was much, much better, and ended with this:

I think it’s best not to over think this one.

Prediction: Denver 31, Baltimore 13

A year later, and we’re in the same boat. The Broncos just had another marvelous run, again capturing the #1 seed in the AFC on the back of a spectacular season by Peyton Manning. The opponent looks overmatched, at least on paper: the 2012 Ravens had an Simple Rating System score of +2.9, while the 2013 Chargers are at +2.7. The 2012 Broncos had an SRS grade of +10.1, a number that has risen to +11.4 this year. About the only good thing we could say about the 2012 Ravens (relative to Denver) was that they were getting healthier. About the only good thing we can say about the 2013 (relative to Denver) is that they’re getting hotter. And, I suppose, they’re healthier, too, at least compared to a Broncos team that is missing Von Miller, Ryan Clady, Rahim Moore, and Dan Koppen. So no, I’m not just going to assume Denver will win and move on.

I suppose some of you out there are thinking, “Hey, wait a minute. The Chargers beat the Broncos in Denver in the regular season. Doesn’t that mean something?” Well, tell that to the 1934 Bears, who went 13-0 and beat the Giants in the Polo Grounds in the regular season only to lose 30-13 at that same spot in the playoffs! Okay, presumably Denver/San Diego won’t flip on the shoe selection of the competitors, but the larger point remains: road teams that played a rematch in the playoffs against a team they beat at that same venue in the regular season are just 18-32.

Here’s how to read the table below. In 2010, the Seahawks went on the road to play the Bears after beating them in the regular season, 23-20. Seattle met in Chicago in the Division Round of the playoffs, and the Seahawks were 10-point underdogs. Seattle lost, 35-24.
[continue reading…]

{ 1 comment }

How quaint: a quarterback taking snaps form under center

How quaint: a quarterback taking snaps form under center.

With one game remaining, Peyton Manning has already set the new single-season record with 51 passing touchdowns (two months ago, I projected Manning to finish the season with 52 touchdowns). But all records must be viewed in their environment, and NFL teams are averaging 1.58 touchdown passes per team game this year, the highest average since 1948. In 1984, the year Dan Marino threw 48 touchdowns, teams averaged 1.37 touchdown passes per game.

So which season is more impressive? That’s a complicated question, and one that could be answered in many ways. In my view, the question boils down to which performance was more outstanding; in mathematical terms, we could define that as which season was farthest from the mean.

To make life a little simpler, I’m going to analyze this question on the team level, meaning we will compare “Denver 2013” to “Miami 1984.” Of course, this approach is preferable in many ways, since when we praise Manning we really mean “Manning with his offensive line and his coaching staff throwing to Demaryius Thomas, Wes Welker, Eric Decker, and Julius Thomas.” And “Marino in 1984” means “Marino and Mark Clayton and Mark Duper and Dwight Stephenson and Ed Newman.”

This season, the Broncos have 51 touchdown passes. The other 31 teams (through 15 games) are averaging 22.8 passing touchdowns, which means Denver is 28.2 touchdowns above average. The standard deviation of the 32 teams in passing touchdowns is 7.4; as a result, we can say that the Broncos are 3.84 standard deviations above average, also known as their Z-score.

In 1984, the other 27 teams (through 16 games) averaged 21.0 touchdowns, while the Dolphins threw 49 scores (Jim Jenson, a college quarterback who played receiver for Miami, threw a 35-yard touchdown to Duper against the Patriots off a Marino lateral). The standard deviation that season in touchdown passes at the team level was 7.5, which gives Miami a Z-score of 3.72 in 1984.

So the Broncos this season have been more extraordinary, at least by this measure. One nice thing about using the Z-score is we don’t need to adjust for games played. I went ahead and calculated the Z-scores for every team since 1932. The current Broncos are #1, with the ’84 Dolphins in second place. The third place team isn’t the Tom Brady 2007 Patriots; that team is down at #7, because the standard deviation in passing touchdowns among the league’s 32 teams was 8.8 that season. Instead, the third slot goes to the 1986 Dolphins. Few remember that Marino threw 44 touchdowns that season; add in Don Strock’s two touchdowns, a lower league average and a smaller standard deviation, and those Dolphins get a Z-score of 3.70.

Let’s look at the top 100 teams using this metric. The 2004 Colts ranked fifth (if you click on the cell in the team column, the link takes you to that team’s PFR page) in Z-score. That year, Indianapolis threw 51 touchdowns, while the other 31 teams averaged 21.97 touchdown passes. That means Indianapolis was 29.03 touchdowns above average, the highest production above average to date. But that year, the standard deviation among the 32 teams in passing touchdowns was 8.53, giving the Colts a Z-score of “only” 3.41; that’s why they’re 5th, not first.
[continue reading…]

{ 38 comments }

Denver has scored at a historic rate

Denver has scored at a historic rate.

Today’s insane statistic comes courtesy of RJ Bell: the difference between Denver and the #2 team in points per game is larger than the difference between the #2 and #31 teams. The Broncos are averaging 39.8 points per game this season, 11.6 points more than the (surprisingly second-ranked) Bears. And Chicago is averaging just 9.9 more points per game than the Jets, the #31 ranked scoring team.

That is, well, crazy. The record for points per game in a season is 38.8, set by the 1950 Rams. The 2007 Patriots are second at 36.8, and both of those teams scored slightly more points through ten games than the 2013 Broncos. So while Denver is on pace to break the scoring record, some regression to the mean over the final six games should be expected.

If the Broncos want to set the record for most points scored relative to the second highest scoring team in the league, Peyton Manning and company have some work to do. That mark is held by the ’41 Bears, who averaged 36.0 points per game, 12.5 more than the Packers that year. Second and third on that list are the ’07 Patriots (8.4) and ’50 Rams (8.3), so Denver has a realistic shot of setting the modern record.

I’ll be honest: as dominant as the Broncos offense has been, I’m a little surprised to see them so far ahead of the competition in points scored. After all, consider:

  • The Eagles have just 19 fewer yards than the Broncos, and Nick Foles actually leads Manning in both passer rating and Adjusted Net Yards per Attempt;
  • In PFR’s Expected Points Added, the Broncos offense is at 14.7 EPA-added per game, while the Saints offense is at 11.3. That’s a relatively small difference considering the fact that Denver has scored 12.1 more points per game than New Orleans.
  • The Chargers have a higher completion percentage than the Broncos and six fewer turnovers, but have averaged 17 fewer points per game.
  • The Packers are actually a hair ahead of Denver in yards per play (6.3531 to 6.3529), but have scored two fewer touchdowns per game.

So what’s going on? I’m perfectly fine with Denver being general run-of-the-mill dominant, but the team’s points scored numbers makes it seem like the Broncos might be the greatest offensive machine ever. I think I’ve identified the two reasons to explain the gap:

Red Zone success

Philadelphia has scored a touchdown just 46% of the time the Eagles made it into the red zone, which ranks 28th in the league. San Diego isn’t much better at 50% (22nd). The Saints are at 52.5% (20th), and the Packers are down at 30th at 43%. So some excellent offenses are really struggling in the red zone, which gives them disproportionately low points per game averages. Oh, and Denver? They’re at 79.1%, by far the highest rate in the league. It’s not unusual for a great offense to dominate in the red zone — the ’07 Pats were at 70% — but what is unusual is seeing the other top offenses struggle there.

I have red zone data going back to 1997, and the highest ever performance was set by Kansas City in 2003. The Trent GreenPriest HolmesTony Gonzalez Chiefs scored a touchdown on 77.8% of all red zone opportunities (42 out of 54), so the Broncos (34 out of 43) could break that record this year. More likely, though, is that the Broncos go from otherworldly in the red zone to just great, which would drop the team’s points per game average.

Number of Drives

The Broncos are averaging 2.85 points per drive, while the Saints are #2 at 2.46. That’s not a huge difference — the gap between #2 and #7 is slightly bigger. The difference, as you can deduce, is that the Broncos are averaging 13 drives per game while the Saints are at just 11.3 drives per game. Why is that? New Orleans’ average drive takes 2:56 minutes, the third-longest in the league (and San Diego is #1 at 3:13), while the Broncos are in the bottom five at 2:17 (the Eagles are last at 2:02). That Chip Kelly edge is erased, though, because Philadelphia’s opponents average 2:48 per drive, the third highest rate in the league. Denver’s opponents take just 2:18 per drive, the third lowest (just a second ahead of Detroit and eight seconds longer than Kansas City).

The Broncos defense is not great, but it does rank 6th in completion percentage allowed. Combine that with the fact that Denver ranks 4th in percentage of opponent plays that are passes, and incomplete passes occur on 25% of all plays run by Broncos opponents, the second-highest rate in the league behind Kansas City. That’s not surprising for a team with such a high Game Script, but it does stop the clock from running for long stretches, which gives Denver’s offense more possessions The Chargers are 28th in this statistic (18%), which is one reason why San Diego is dead last in offensive drives (10.2 per game).

But there’s another reason why Broncos’ opponents tend to have short drives: Denver leads the league in 20+ yard plays allowed at 54. As a result, teams don’t end up with many clock-chewing drives against Denver: opponents tend to gain big yards quickly or throw incomplete passes. That increases the number of drives for the Broncos, which (one could argue) inflates the success of the team’s offense. It’s all relative, of course — Denver is still #1 in points per drive by a wide margin — but it’s worth recognizing that Denver has scored 75% more points per game than an average of the other 31 teams, but “just” 62% more on a per-drive basis. That accounts for about 3 points per game. Add in the insane success in the red zone, and the lack of success there by the other top teams, and you have the reasons for the crazy stat at the top of today’s post.

Manning Record Watch Update

After six games, I analyzed how likely Manning was to break the single-season touchdown record. At the time, he had 22 touchdowns, and the formula projected him to throw 2.99 TDs/G the rest of the way to finish with 52 touchdowns, narrowly breaking Tom Brady’s record.

Now? Manning has 34 touchdowns, as his pace has only slightly declined. What does that mean? To calculate Manning’s odds using Bayes Theorem we need to know four things:

1) His Bayesian prior mean (i.e., his historical average): 2.38, as this number wouldn’t change from the original post.

2) His Bayesian prior variance (the variance surrounding his historical average): Again, no change here, so we use 0.0986.

3) His observed mean: Instead of 3.667, we will use 3.4.

4) His observed variance: This one involves just a little bit of work. What I suggested we do last time is calculate the number of passing touchdowns per game Manning averaged in the first six (now ten) games of each season since 2000, along with his average over the rest of the season (then, 8-10 games, now, 4-6 games). Then we take the difference of the variances of each column, as we did in step two.

YearTD/G Thru 10ROY GTD/G ROYDiff
20002.1620.1
20011.861.330.47
20021.961.330.57
20031.961.670.23
20043.552.80.7
20052420
2006261.830.17
20071.653-1.4
20081.751.8-0.1
20092.143-0.9
2010262.17-0.17
20122.462.170.23
Variance0.220.31

Manning’s variance over the rest of the season is 0.3052 TDs/G, while his variance through ten games is 0.2214; the differential there is 0.0838, which is the variance of our current mean.

Once you have your number for these four variables, then you substitute those numbers into this equation:

Result_mean = [(prior_mean/prior_variance)+(observed_mean/observed_variance)]/[(1/prior_variance)+(1/observed_variance)]

Or, using our numbers:

[(2.38 /0.0986) + (3.4 / 0.0838)] / [(1/0.0986) + (1/0.0838)]

which becomes

[24.14 + 40.57] / (22.08) = 2.93

This picture will never get old

This picture will never get old.

After averaging 3.667 TDs/G over 6 games, we projected Manning to average 2.99 TDs/G the rest of the year. Since he averaged “only” 3 touchdowns per game over his next four games, we downgrade him from 2.99 to 2.93. Of course, we already had a significant regression factored into his future projection — we dropped him by 0.67 TDs/game from his average, which is the point of using Bayes Theorem. So while he’s at “only” 3.4 TDs/G on the season after 10 games, since he’s played at that level for longer, he only loses about half a touchdown per game over his projection the rest of the way.

That gives Manning 17-18 touchdowns, which puts him at a season-ending projection of 51-52 touchdowns. He’s still more likely than not to break the record, although obviously this analysis ignores lots of elements like strength of schedule. And with a visit to Kansas City and a game against the Titans (who have allowed a league-low 7 touchdowns through the air), perhaps he’s actually an underdog to even tie Brady at 50.

{ 3 comments }

If you don’t play fantasy football, you probably have no idea what this title means. Of course, it’s 2013, so if you don’t play fantasy football, you’re now the oddball. “PPR” stands for points per reception. About half of all fantasy leagues do not give any points for receptions, while the other half includes some sort of PPR format. And while the value of every player is dependent on each league’s scoring system, few players see their value fluctuate between scoring systems quite like Wes Welker. Or, at least, that’s how it seems. Is there a way to measure this effect?

First, a review of Welker’s numbers since he joined the Patriots:

Games Receiving
Rk Player Year Age Draft Tm Lg G GS Rec Yds Y/R TD Y/G
1 Wes Welker 2012 31 NWE NFL 16 12 118 1354 11.47 6 84.6
2 Wes Welker 2011 30 NWE NFL 16 15 122 1569 12.86 9 98.1
3 Wes Welker 2010 29 NWE NFL 15 11 86 848 9.86 7 56.5
4 Wes Welker 2009 28 NWE NFL 14 13 123 1348 10.96 4 96.3
5 Wes Welker 2008 27 NWE NFL 16 14 111 1165 10.50 3 72.8
6 Wes Welker 2007 26 NWE NFL 16 13 112 1175 10.49 8 73.4

Welker doesn’t get many touchdowns, and while he has respectable yardage totals, he is only exceptional when it comes to piling up receptions. Welker has 672 receptions over the last six seasons, easily the most in the NFL (in fact, it’s the most ever over any six-year stretch). Brandon Marshall (592) and Reggie Wayne (578) are the only two players even within 100 catches of Welker. Over that same time frame, he ranks 4th in receiving yards, but only tied for 17th in receiving touchdowns.

Giselle approves of Welker's form

Giselle approves of Welker's form.

So how can we measure how much more valuable Welker is in PPR-leagues than non-PPR leagues? One way is to use VBD, which is a measure of how much value a player provided over the worst starter (or some other baseline). For example, Welker scored 173 fantasy points and ranked as WR12 in non-PPR leagues last season. If you are in a start-three wide receiver league, the worst starter would be WR36, who scored 111 fantasy points. That means Welker provided 62 points of VBD.
[continue reading…]

{ 2 comments }

Trindon Holliday’s perfect season: can he go 19-0?

Holliday went 11-0 with the Broncos in the regular season.

Holliday went 11-0 with the Broncos in the regular season.

I was going to save this post for later today if the Broncos won, but seeing as how Trindon Holliday just set a playoff record with the longest punt return touchdown in post-season history, the timing feels more appropriate now. Holliday was a sixth round pick of the Houston Texans in 2010. At 5-5, many viewed him too short to be effective in the NFL, but the Texans saw potential in him as returner (he led the SEC in punt return average in 2009 at LSU). Holliday didn’t make an instant impact, but the shortest player in the NFL in 25 years is trying to vault one of the biggest hurdles in the game: a 19-0 season.

Holliday led the NFL in punt return yards this season and finished the year 16-0. Wearing #16, Holliday gained 341 all-purpose yards in five games with Houston before the Texans decided that he wasn’t providing a big enough spark in the return game. The Broncos quickly scooped him up, and the Broncos finished the year 11-0. That gave Holliday a perfect 16-0 season. According to my data, no player has ever gone 19-0 in a season. Can Holliday become the first?

{ 4 comments }

I was on vacation last week, so I provided just a bare bones set of NFL playoff predictions. Technically, my picks went 4-0 on Wildcard Weekend, but that doesn’t count for much when you pick the favorite in every game. With a little more time on my hands, here’s an in-depth preview of Saturday’s games. Tomorrow I’ll be previewing Sunday’s action.

Baltimore Ravens (10-6) (+9.5) at Denver Broncos (13-3), Saturday 4:30PM ET

Manning looks for to win another Super Bowl

Manning points to his glove dealer.

Most of the signs in this game point squarely in the favor of Peyton Manning and the Broncos. Baltimore has wildly underachieved on the road the last few seasons, and in Denver does not seem like the optimal place for that trend to reverse itself. From 2002 to 2010, Manning went 8-0 against the Ravens, including a 2-0 mark in playoff games. If you double his numbers in those games (to approximate a 16-game season), Manning would have thrown for 4,044 yards and 28 touchdowns against just 12 interceptions, while averaging 7.8 Y/A and 7.9 AY/A to go with a 65.6% completion rate and a 97.7 passer rating. Manning was similarly lethal in Denver’s win over the Ravens in Baltimore earlier this year.
[continue reading…]

{ 1 comment }

Season in review: AFC and NFC West

AFC East and NFC East Season in review
AFC North and NFC North Season in review
AFC North and NFC South Season in review

In the case of the AFC West, a picture can say a thousand words.

AFC West

Denver Broncos

Pre-season Projection: 8.5 wins
Maximum wins: 13 (after weeks 10 through 16)
Minimum wins: 9 (after weeks 3, 5 )
Week 1 comment: Watching Peyton Manning work his magic was a thing of beauty on Sunday night. The less John Fox touches this offense, the better, but I think everyone in Denver already knows that.

Once Peyton Manning proved that he was healthy and back, the AFC West race was effectively over. Officially, that happened in the week 6 comeback over the Chargers. That win only made them 3-3, but here is what I wrote then: According to Advanced NFL Stats, Denver is the best team in the league. Their remaining schedule is absurdly easy, so I’m going to perhaps prematurely give them a two-win bump. Their week 15 game in Baltimore may be for a bye, and I now think Denver is the favorite.

Kudos to Brian Burke’s model for correctly identifying how good the Broncos were early in the year. After week 9, I pegged Denver at 12 wins, and wrote: As a matter of principle, projecting a team to finish 7-1 is never advised. But this seems to be a good place to make an exception.

The next week, I bumped them to 13 wins, and never moved off that number. They got a late Christmas present from Manning’s old team, and now the AFC playoffs will have to go through Denver.

San Diego Chargers

Pre-season Projection: 9 wins
Maximum wins: 9 (after weeks 1, 2, and 4)
Minimum wins: 6 (after weeks 10 through 13, 16)
Week 1 comment: Unimpressive on Monday Night Football, but the schedule lines up for them to succeed. Philip Rivers is still elite, so expecting them to only go 8-7 the rest of the way is probably more of a knock on them than anything else. A healthy Ryan Mathews back will help.

The Chargers schedule was ridiculously easy, but they lost to the Browns, Saints, and Panthers, and couldn’t beat the Ravens, Bengals, or Bucs. The decline of Philip Rivers from elite quarterback to throw-it-out-of-bounds master is depressing, and it’s easy and probably appropriate to point the blame at the general manager. Going into 2013, San Diego will have a new head coach and GM, and we’ll see if that is what was needed to resurrect Rivers’ career.

It’s not easy to remember, but the Chargers were actually 3-1. At that point, I wrote: An unimpressive 3-1 team with a struggling offensive line. I really wanted to keep them at 8 wins, but their schedule is too easy and Philip Rivers — even in a down year — is good enough to lead them to a .500 record the rest of the way.

But by the time they were 3-4, I had already started with the “I can’t think of anything positive to say about the Chargers right now” comments. I summed up the Chargers season after week 13, when I wrote: This team started 2-0 but hasn’t beaten anyone but the Chiefs since then.

Of course, San Diego being San Diego, the Chargers did finish with 7 wins, but it was another disappointing season for the franchise. It’s hard to think back to September, but Vegas really did project the Chargers to win this division.
[continue reading…]

{ 4 comments }

In 2011, the Broncos scored 309 points and allowed 390 points. Despite being outscored by 81 points, the Tim Tebow express still made it into the post-season. In June, I speculated that the 2012 Broncos might set the record for the largest increase in pass completions in one year, and they did just that on Sunday. They also moved into fourth place on another list.

With 481 points and 289 points allowed, Denver outscored its opponents by 192 points in 2012. Peyton Manning and Von Miller have turned the Broncos into one of the best teams in the league a year after they were one of the worst (at least, as measured by points differential). Denver improving their points differential by a whopping 273 points this year relative to 2011, the fourth largest increase in football history.

RankYearTeamPFPADiffN-1 PFN-1 PAN-1 DiffImpr
11999St. Louis Rams526242284285378-93377
21929New York Giants3128622679136-57283
32001Chicago Bears338203135216355-139274
42012Denver Broncos481289192309390-81273
51998Minnesota Vikings556296260354359-5265
61975Baltimore Colts395269126190329-139265
72004San Diego Chargers446313133313441-128261
82006New Orleans Saints41332291235398-163254
91965Chicago Bears409275134260379-119253
102008Baltimore Ravens385244141275384-109250
111955Washington Redskins24622224207432-225249
121976New England Patriots376236140258358-100240
131963Oakland Raiders36328281213370-157238
141997New York Jets34828761279454-175236
151923Columbus Tigers119358424174-150234
161987Indianapolis Colts30023862229400-171233
171991Cleveland Browns293298-5228462-234229
181967New York Giants369379-10263501-238228
191969Atlanta Falcons2762688170389-219227
202010Detroit Lions362369-7262494-232225
211976Chicago Bears25321637191379-188225
222001Cleveland Browns285319-34161419-258224
231999Indianapolis Colts42333390310444-134224
242000New Orleans Saints35430549260434-174223
252010St. Louis Rams289328-39175436-261222
{ 1 comment }

NYT Fifth Down: Post-week 15

A double post at the New York Times this week.

Did you know that Alex Smith is seven attempts away from qualifying for eligibility for certain rate-based statistics? If Jim Harbaugh wants to game the system — and this is Harbaugh — he could ptobably that Smith breaks the completion percentage record, set by Drew Brees in 2011.

I also looked at how the playoff field will be very familiar this year:

With two weeks remaining in the N.F.L. regular season, seven teams have clinched a playoff berth and several more can clinch this weekend. Chances are, two weeks from now, the teams in the playoffs will look pretty familiar to N.F.L. fans.

In the A.F.C. in 2011, the Patriots, the Ravens, the Texans and the Broncos won the East, North, South and West Divisions. New England, Houston and Denver have already clinched their divisions in 2012, and even the free-falling Ravens are still the favorites to win the A.F.C. North. That would give the conference four repeat division winners, a first since the league moved to the four-division format in 2002.

Last year, the Pittsburgh Steelers and Cincinnati Bengals were the two wild-card teams. Well, those two teams are currently battling for a wild-card spot, and it would be a surprise if both teams are left out of the playoffs. That would leave one spot in the A.F.C., which is most likely going to go to the Indianapolis Colts. The Colts did not make the playoffs in 2011 — in fact, the team had the worst record in the league — but they did make the playoffs every year from 2002 to 2010.

From 2009 to 2011, half of the conference — the Ravens (6), Jets (6), Patriots (5), Steelers (4), Colts (4), Broncos (2), Texans (2), and Bengals (2) — played in 31 of the A.F.C.’s 33 playoff games, and barring the miraculous (the 6-8 Dolphins are technically still alive), that won’t change this year. The last time a Tom Brady-led team didn’t make the playoffs was in 2002; the last time Peyton Manning’s team missed out on the postseason was in 2001. In the A.F.C., some things never change.

The N.F.C. features only slightly more turnover. Green Bay is going to the playoffs for the fourth straight season while Atlanta will be there for the fourth time in the five-year Matt Ryan/Mike Smith“>Mike Smith era. San Francisco has a good chance of securing a first-round bye for the second year in a row. That leaves just three remaining spots.

Seattle, winner of a playoff game just two years ago, is likely to be back in the postseason as well. The Giants, winners of two of the last five Super Bowls, will make the playoffs if they win their final two games. Chicago and Dallas are no strangers to the playoffs, and one might make it again this year. The real “surprise” teams in the N.F.C. are Minnesota — which did go to the N.F.C. championship game three years ago — and Washington. Andrew Luck and Robert Griffin III were the first two picks in the draft and may power their teams to the playoffs this year. When it comes to the 2012 season, that qualifies as unpredictable.

Your weekly updates on Adrian Peterson and Calvin Johnson

At this point, it’s getting impossible to write a statistical column without talking about Adrian Peterson“>Adrian Peterson. The Vikings gained just 322 yards against the Rams on Sunday, but Adrian Peterson“>Adrian Peterson ran for 212, accounting for 66 percent of the Minnesota offense. It was the fourth time this season — and in the last two months — that Peterson has rushed for at least 8 yards per carry on 15-plus carries; since 1960, only Barry Sanders (5) and Peterson have accomplished such a feat in a season.

In one of the most incredible stats of this or any year, Peterson has rushed for 1,313 yards in his last eight games, the most by a player in an eight-game stretch since at least 1960. From 1960 to 2011, only four men rushed for 1,200 yards in that span. In 1977, Walter Payton rushed for 1,221 yards over an eight-game stretch; three years later, Earl Campbell rushed for 1,245 yards in half a season. In 2005, Kansas City’s Larry Johnson gained 1,244 rushing yards in the last eight games of the year. Before Peterson, Eric Dickerson held the record for rushing yards in an eight-game stretch; Dickerson rushed for 1,292 yards in the last five games of the ’84 season and the first three games of 1985.

For more on Peterson and Calvin Johnson, along with some interesting week 15 stats, check the full article here.

{ 0 comments }

NYT Fifth Down: Post-week 12

My article for the New York Times this week takes a look at one interesting statistic for each of the eight division winners.
 

Atlanta Falcons – Record in Close Games
In 2010, Atlanta raced to a 10-2 record on the strength of an improbable 7-1 record in games decided by 7 or fewer points. How a team fares in close games has a heavy impact on a team’s final record, but statisticians agree that such a metric holds little predictive value. The Falcons earned the No. 1 seed in the N.F.C. thanks to their success in close games, but ranked only seventh in the Football Outsiders advanced statistical rankings and 21st in the Advanced NFL Stats efficiency ratings. Atlanta lost badly in its playoff opener, not surprising to those who felt the Falcons’ record was more mirage than reality.

This season, Atlanta has raced to a 10-1 record on the strength of an improbable 7-1 record in games decided by 7 or fewer points. Football Outsiders ranks the Falcons 12th, and according to its founder, Aaron Schatz, the Falcons have by far the worst efficiency rating of any of the 18 teams that have started 10-1 since 1991. Advanced NFL Stats is slightly more generous, placing the Falcons fifth, although the gap between the fifth and 12th teams in its rating is miniscule. The takeaway: Don’t get caught up in the Falcons’ record. It will give Atlanta a bye, but no other guarantees come with it.

San Francisco – Top Pass Defense in the N.F.L.

Last season, the 49ers’ reputation for having an elite defense was built on their superb run defense, which ranked first in rushing yards allowed, rushing yards per carry allowed and rushing touchdowns allowed. But the 49ers were not dominant against the pass, ranking ninth in net yards per pass attempt allowed. This season, the San Francisco defense is without weakness.

The 49ers (8-2-1) actually lead the N.F.L. in net yards per pass attempt allowed. In the process, the 49ers lead the N.F.L. in points allowed, and their defense ranks in the top three in both first downs allowed and Pro-Football-Reference’s Expected Points Added statistic. The run defense remains stout, ranking in the top four in yards, yards per carry and touchdowns allowed, but the improvement in the pass defense makes this an even better defense than the 2011 version. As long as San Francisco continues to shut down opposing passers, it won’t matter very much whether Coach Jim Harbaugh picks Alex Smith or Colin Kaepernick at quarterback.

Chicago – 11th in Points Scored Without an Offense

As a technical matter, the Bears (8-3) rank 11th in points scored. Just don’t let anyone tell you that in the context of a story about how Chicago’s offense is underrated. The Bears have scored eight non-offensive touchdowns this season — seven on interception returns, one on a blocked punt — and their great defense and special teams consistently set up the offense for success even when those units aren’t scoring touchdowns. Chicago is in the bottom five in Net Yards per Attempt, Adjusted Net Yards per Attempt, total yards and sacks allowed. The Bears’ running game benefits from a high number of carries, but ranks below average in both yards per carry and PFR’s Expected Points Added statistic.

The defense is excellent, but a poor offensive line and mediocre wide receiver talent behind Brandon Marshall leave the Bears with one of the worst offenses in the N.F.L. — regardless of how many points they’ve scored. Advanced NFL Stats ranks the Bears’ offense as the second worst in the league.

You can read the full article here.

{ 5 comments }

The San Francisco 49ers were the breakout team of the 2011 season, going from 6-10 in 2010 to 13-3 last year. The Cincinnati Bengals were the surprise team of the AFC, jumping from four to nine wins and earning a playoff berth. The Houston Texans, Detroit Lions, and Denver Broncos all made the playoffs after notching four more wins in 2011 than they had in 2010. But could you have known after just one week that those teams were on track for such breakout seasons? Let’s review.

San Francisco 49ers 33, Seattle 17

The 49ers were Super Bowl contenders as long as Ginn was returning punts.

This was an odd game, and Jason McIntyre explains why:

San Francisco had just 12 first downs and 209 yards … but still beat the Seahawks by 16 points. The real reason the 49ers won was because Ted Ginn ran a punt and kickoff back for touchdowns in a span of 59 seconds. But offensively, Frank Gore averaged 2.7 ypc and Alex Smith threw for just 124 yards. San Francisco had the ball for 31 minutes and mustered only 12 first downs. As bad as the 49ers looked offensively, the defense did sack T-Jack five times and generate three turnovers. But if the 49ers couldn’t move the ball against a mediocre Seahawks defense … what will they be able to do against the Cowboys, which annihilated the Jets’ offensive line Sunday night? The 49ers have opened as 3-point dogs against Dallas next weekend … I humbly suggest loading up on Romo in that one. No word if San Fran will be without Michael Crabtree.

The 49ers offense wasn’t impressive, but San Francisco’s defense and special teams were dominant. That formula proved to work all season, although few expected it to work against teams better than Seattle. At the time Seattle was considered one of the worst teams in the league (they were a 14-point underdog in Pittsburgh the following week), which made the victory look even less impressive. After week one, Jason Lisk unveiled his Week 1 Power rankings, placing NFL teams into seven tiers. The 49ers were placed in Tier 6 with the comment “When you need two returns by Ted Ginn to put away the Seahawks, you are not good.” ESPN’s power rankings placed San Francisco at #22.

Cincinnati 27, Cleveland 17
This was an ugly game that caught almost nobody’s attention. The big stories of the game were the officiating and the performance of Bruce Gradkowski, who came and led Cincinnati to a win after Andy Dalton was injured. Many in Cleveland blamed the referees, as the Browns were flagged for 11 penalties, compared to just three for Cincinnati. And on the game’s pivotal play — a 41-yard touchdown to A.J. Green — the Browns were still in their defensive huddle at the start of the play, and later argued that the quick snap wasn’t a legal play. The Bengals defense was excellent, shutting down Peyton Hillis and Colt McCoy, but many thought that was simply a product of the schedule. Suffice it to say, no one was boarding the Bengals’ bandwagon after week one. Lisk placed Cincinnati in Tier 5: “Still not sold here, especially if Bruce Gradkowski is QB. Haden shut down Green until the play where he was uncovered at the snap, and Benson’s numbers boosted by a late TD run.” ESPN ranked the Bengals 30th… and the Browns 32nd. The Bengals would lose in Denver and in San Francisco the next two weeks, dropping to 1-2.
[continue reading…]

{ 1 comment }

Largest increase in pass completions

And then John said to Peyton, 'Tim Tebow.'

Fifteen days into its infancy, Football Perspective has published fifteen posts. If you are enjoying the site, be sure to check back every day for a new post. You can also become one of the 850+ people to “like” Football Perspective on Facebook. You can also follow me on twitter. Enough of a site update: on to today’s post.

Unlike most sports writers, I don’t know a lot about what will happen this season. But there’s one thing I do know: the Denver Broncos aren’t going to rank 32nd again in pass attempts again. The Tebow Broncos, an offense with an inexperienced quarterback and a confused offensive coordinator, completed just 217 passes last season. That was the lowest in the league, and the lowest since the ’09 Jets, a team that boasted the number one rushing attack and defense in the league — and Mark Sanchez.

Setting aside those years where the league scheduled more games in the following season, the table below shows the teams with the largest increase in completions from one year (that’s the year listed in the table) to the next:

YearTmCmp NCmp N+1DifferenceQB Year NQB Year N+1HC Year NHC Year N+1
1978SFO190361171Steve DeBergSteve DeBergPete McCulley [1]In 1978, the 49ers fired McCulley after 9 games and Fred O'Connor coached the rest of the season.Bill Walsh
2000TAM237362125Shaun KingBrad JohnsonTony DungyTony Dungy
2004ARI299419120Josh McCownKurt WarnerDennis GreenDennis Green
1998CHI284404120Erik KramerShane MatthewsDave WannstedtDick Jauron
1993NWE289405116Drew BledsoeDrew BledsoeBill ParcellsBill Parcells
2000CIN207322115Akili SmithJon KitnaDick LeBeau [2]In 2000, Bruce Coslet was the Bengals coach to start the season, but he resigned after three straight blowouts to begin the year.Dick LeBeau
1957PHI99214115Bobby ThomasonNorm Van BrocklinHugh DevoreBuck Shaw
2006ATL222336114Michael VickJoey HarringtonJim MoraBobby Petrino
1983MIA254367113Dan MarinoDan MarinoDon ShulaDon Shula
1994DET250362112Dave KriegScott MitchellWayne FontesWayne Fontes
1978BAL202313111Bill TroupGreg LandryTed MarchibrodaTed Marchibroda
2008MIN267377110Gus FrerotteBrett FavreBrad ChildressBrad Childress
2008SEA262372110Seneca WallaceMatt HasselbeckMike HolmgrenJim Mora
1989HOU295399104Warren MoonWarren MoonJerry GlanvilleJack Pardee
2001SEA258361103Matt HasselbeckMatt HasselbeckMike HolmgrenMike Holmgren
1988NWE199302103Doug FlutieSteve GroganRaymond BerryRaymond Berry
1979HOU195296101Dan PastoriniKen StablerBum PhillipsBum Phillips
1996SEA26135998Rick MirerWarren MoonDennis EricksonDennis Erickson
1999PHI23533196Doug PedersonDonovan McNabbAndy ReidAndy Reid
1993MIN31540994Jim McMahonWarren MoonDennis GreenDennis Green
1985CLE22231593Bernie KosarBernie KosarMarty SchottenheimerMarty Schottenheimer
1993NOR27436692Wade WilsonJim EverettJim MoraJim Mora
1992DEN25835092John ElwayJohn ElwayDan ReevesWade Phillips
1972PHI18427591John ReavesRoman GabrielEd KhayatMike McCormack
1950GNB14023191Tobin RoteBobby ThomasonGene RonzaniGene Ronzani
2011DEN217Tim TebowPeyton ManningJohn FoxJohn Fox

[continue reading…]

References

References
1 In 1978, the 49ers fired McCulley after 9 games and Fred O'Connor coached the rest of the season.
2 In 2000, Bruce Coslet was the Bengals coach to start the season, but he resigned after three straight blowouts to begin the year.
{ 5 comments }