≡ Menu

Atlanta had a really, really good offense this year. My favorite statistic: the Falcons had 59 drives end in a punt or a turnover, and 58 end in a touchdown.  Atlanta averaged 3.03 points per drive this year, and yet, the offense has been even better in the playoffs.

There was no stopping Matt Ryan and the Falcons against Green Bay, as the group scored 44 points on 9 drives in the NFC Championship Game. In the division round, the Falcons scored 36 points on 9 or 10 drives against Seattle, depending on whether you want to treat the Falcons final drive of the game as a real drive.  In two NFC playoff games, Atlanta’s offense has scored 10 touchdowns, seen 5 drives end on punts, 3 end on field goals, with zero turnovers and one drive end with the clock running out.

Scoring 80 points on 18 or 19 drives translates to an average of 4.21 or 4.44 points per drive. Take an average of those two numbers, and the offense is still averaging a whopping 4.32 points per drive. How remarkable is that? Well, it’s the best average for any of the 102 Super Bowl teams in their pre-Super Bowl playoff games.

The NFL has not historically recorded drive stats, so I previously wrote how one can estimate the number of offensive drives a team has in a game or season.  I used that formula to measure the best playoff offenses entering the Super Bowl; unsurprisingly, the 1990 Bills were the previous hottest offense.

Against Miami in the division round, Buffalo had between 10 and 12 drives, depending on how you treat the final drives of the half (the Bills received the ball with 14 seconds left on their own 32, and took a knee) and the game (Buffalo received the ball with just over one minute to go, and ran three times for a first down to run out the clock). Those other ten drives ended as follows, in order: Touchdown, Field Goal, Field Goal, Touchdown, Touchdown, Interception, Field Goal, Touchdown, Touchdown, Punt. That’s 44 points on 10 real drives.

The next week, in the AFC Championship Game against the Raiders, the Bills had 11 or 12 drives, as the final drive of the game featured Buffalo taking a pair of knees to close out a 51-3 victory. The first 11 drives went: TD, TD, Interception, TD, missed FG, TD, TD, Punt, TD, FG, Punt.  That’s 44 points (Buffalo also scored on a pick six, and one extra point was missed) on 11 drives. [continue reading…]

{ 14 comments }

Additional Thoughts On The 2016 Falcons Offense

Atlanta had “only” 175 drives on offense this year, tied with Washington for the fifth fewest drives in the NFL. That’s partially because the offense was so good — Atlanta had the 2nd fewest number of drives end in a 3-and-out, behind only New Orleans — but also because the defense was below average, keeping the offense off the field.

Despite that, Atlanta scored a whopping 540 points. But here’s another way to think about it: the Falcons had just 11 turnovers and 48 punts, meaning just 59 drives ended in a punt or a turnover. That’s the fewest in modern history, one fewer than the 2007 Patriots (who had just 167 drives). And Atlanta scored 58 offensive touchdowns, meaning the offense had nearly as many drives end in a touchdown as a punt or turnover. And that’s just, well, crazy: [continue reading…]

{ 40 comments }

Matt Ryan Is Having A Historically Great Season

Matt Ryan leads the NFL in the following categories:

  • Touchdown Rate, at 6.8%
  • Yards per Attempt, at 9.3
  • Adjusted Yards per Attempt, at 10.0
  • Yards per Completion, at 13.3
  • Passer Rating, at 115.5
  • Net Yards per Attempt, at 8.21
  • Adjusted Net Yards per Attempt, at 8.90

Ryan also ranks 3rd in passing yards and 3rd in passing touchdowns, despite leading in the rate versions of those categories, because Ryan only ranks 18th in pass attempts, and that’s despite not missing any games. The Falcons rank 27th in pass attempts.  The Falcons rank 12th in rushing attempts, but only rank 25th in total plays.

Why is that? Well, Atlanta only ranks 27th in offensive drives.  And why is that? One reason is that the Falcons defense isn’t good at getting off the field. The Falcons defense is allowing 6.1 plays per drive, at a 2:45 minute clip per drive, and resulting in 2.18 points per drive. All three of those metrics place Atlanta in the bottom quarter of the league, as does Atlanta’s 41.6% third down rate.  Even worse, the Falcons have the worst red zone defense in the league.

The Falcons have also scored 5 return touchdowns this year, which negated five potential possessions for the offense.  But there’s another reason Atlanta has so few drives and plays this year: the offense is really, really good. Just 55 drives have ended in a punt or turnover this year, the fewest in the league.  The Falcons are also the only team to have over half of its drives end in a score. If Atlanta had more three-and-outs, they’d have more drives and maybe more plays, but completed passes keep the clock running.

If the Falcons had a better defense, Ryan would probably have more pass attempts this year, and he might be producing some better raw numbers. If he had 5,200 passing yards, it would be clearer to the average fan that this is a historically great season. And because Atlanta tends to run near the goal line, the team ranks 3rd in rushing touchdowns, which depresses Ryan’s touchdown totals (though provides some assistance to his yards per attempt numbers). Instead, we have to focus on his rate numbers.  So, which league-leading rate number is the best? [continue reading…]

{ 109 comments }

This week at the New York TimesPeyton Manning is now being carried by his defense.

The Denver Broncos have been synonymous with offensive success since Peyton Manning joined the team in 2012. In Manning’s first three years in Denver, the Broncos scored 1,569 points, 100 more than any other team in football. But this year, the Broncos are 5-0 despite ranking 30th in offensive yards, 27th in yards per pass, and 31st in yards per carry. That’s because Denver’s success has been powered by a dominant defense.

It starts with the defense’s production on a per-play basis, where the defense leads all teams. The Broncos are allowing just 4.3 yards per play to opposing offenses; if that holds, it would be the lowest average allowed by any defense since the 2009 Jets. The Broncos are allowing a league-low 4.7 yards per pass attempt, thanks in part to an incredible 22 sacks, the most by any defense through five weeks. And there is no weakness to this unit, as the rush defense ranks in the top quarter of the league in both yards and yards per carry. Situation defense? The Broncos are covered there, too, as Denver’s third down defense has been the best in the league, allowing first downs just 29.7% of the time.

You can read the full article here

I also wrote this week about Devonta Freeman on Thursday at the Times.

In his first 18 N.F.L. games, Freeman had never gained more than 84 yards from scrimmage. In his first three starts, he has gained at least 149 yards in each one, making him the first Falcons player since Jamal Anderson (1998) with such a streak. He is currently the N.F.L. leader in yards from scrimmage (645) and total touchdowns (eight). And he is one of the best bargains in the N.F.L., too, costing the Falcons only $631,106 in salary cap dollars.

You can read the full article here.

{ 3 comments }

The NFC South is upside down

The NFC South is upside down.

The Atlanta Falcons began the season with a 2-6 record.  In the second half of the year, the team was 4-7 and then 5-9.  The Carolina Panthers began the year with a 3-8-1 record. One of these two teams will make the playoffs.

I’m not even sure what else there is to say.  The phrase “left for dead” is probably too kind.  Carolina fell to 3-8-1 in embarrassing fashion; the team’s 8th loss came in a game where the Vikings returned two blocked punts for touchdowns, and the Panthers body language read “checked the #*$! out.”

From October 6th to December 6th, the Carolina Panthers did not win a game.  Through week 13, the Panthers ranked 28th in points differential.  The Panthers may turn out to be the most unlikely playoff team in NFL history. [continue reading…]

{ 2 comments }

Antone Smith and Long Touchdowns

Allow me to present to you Atlanta running back Antone Smith’s 2014 play-by-play log in its entirety:

Week 1 vs. NO
QtrTimeScoreDown/DistYardlineDescription
211:400 - 132nd-and-10own 20rushed for 2 yards
209:160 - 131st-and-10opp 31rushed for 5 yards
300:3317 - 202nd-and-9own 46caught pass for 54 yards TOUCHDOWN
Week 2 vs. CIN
QtrTimeScoreDown/DistYardlineDescription
214:49417011st-and-10own 28caught pass for 4 yards
201:14417083rd-and-4own 38target of incomplete pass
410:23417221st-and-10opp 35caught pass for 15 yards (first down)
400:54419361st-and-10own 41target of incomplete pass
Week 3 vs. TB
QtrTimeScoreDown/DistYardlineDescription
104:21367081st-and-9opp 9rushed for 4 yards
209:0028 - 01st-and-10opp 11rushed for 10 yards (first down)
302:3649 - 01st-and-10opp 36rushed for -2 yards
301:5949 - 02nd-and-12opp 38rushed for 38 yards TOUCHDOWN
Week 4 vs. MIN
QtrTimeScoreDown/DistYardlineDescription
105:230 - 73rd-and-2opp 29rushed for 2 yards (first down)
104:470 - 71st-and-10opp 27rushed for 3 yards
214:55418342nd-and-10own 31rushed for 9 yards
301:4021 - 271st-and-10opp 48rushed for 48 yards TOUCHDOWN
Week 5 vs. NYG
QtrTimeScoreDown/DistYardlineDescription
103:420 - 71st-and-10opp 23rushed for 2 yards
214:59418273rd-and-4opp 4caught pass for 1 yards
212:33419191st-and-10own 25caught pass for 8 yards
305:5113 - 103rd-and-4own 26caught pass for 74 yards TOUCHDOWN

That’s four long touchdowns on 17 offensive touches.  On his four scoring plays, Smith has gained an incredible 214 yards.  That’s the most in the NFL so far, with Steve Smith (162 yards) and Jordy Nelson (160) rounding out the top three.  Perhaps even more incredible is that Smith has gained 214 yards on scoring plays despite gaining only 63 yards on non-scoring plays.  Here’s a chart I tweeted a couple of days ago, showing yards gained on TDs on the X-axis and yards gained on all other plays on the Y-axis: [continue reading…]

{ 5 comments }

In January, I calculated the AV-adjusted age of every team in 2013. In February, I looked at the production-adjusted height for each team’s receivers. Today, we combine those two ideas, and see which teams had the youngest and oldest set of targets.

To calculate the average receiving age of each team, I calculated a weighted average of the age of each player on that team, weighted by their percentage of team receiving yards. For example, Anquan Boldin caught 36.7% of all San Francisco receiving yards, and he was 32.9 years old as of September 1, 2013. Therefore, his age counts for 36.7% of the 49ers’ average receiving age. Vernon Davis, who was 29.6 on 9/1/13, caught 26.5% of the team’s receiving yards last year, so his age matters more than all other 49ers but less than Boldin’s. The table below shows the average age for each team’s receivers (which includes tight ends and running backs) in 2013, along with the percentage of team receiving yards and age as of 9/1/13 for each team’s top four receiving leaders: [continue reading…]

{ 6 comments }

Predictions in Review: NFC South

During the 2013 offseason, I wrote 32 articles under the RPO 2013 tag. In my Predictions in Review series, I review those preview articles with the benefit of hindsight. Previously, I reviewed the AFC West, the NFC West, and the the AFC South. Today, the NFC South.

Who Will Win 2013 Head Coach of the Year, July 25, 2013

For reasons that are not quite clear to me, I have an unusual fascination with the Coach of the Year award. There’s no harder award to predict in all of sports, since the winner is essentially the coach of the team that had the least predictable (in a good way) season. Still, I threw my hat into the ring in 2014 and predicted that Sean Payton would win Coach of the Year. Here is what I wrote in July:

Rob Ryan is now in charge of a defense that ranked last in yards allowed, net yards per attempt allowed, rushing yards allowed, rushing yards per carry allowed, first downs allowed, Expected Points Added, and defensive DVOA. The 2012 Saints also ranked 31st in points allowed. Ryan himself won’t fix that, but first round pick Kenny Vaccaro should begin to help the problem secondary.

But the real reason for optimism is the always explosive Saints offense. Drew Brees, Jimmy Graham, and Darren Sproles are three of the more unique players in the NFL, and help give the Saints an outstanding passing offense. Of course, New Orleans passing attack was great before either Graham or Sproles arrived, as the Brees/Payton engine (with a dash of Marques Colston and Lance Moore) is at times unstoppable. …

Predicting who will win AP Coach of the Year is a fool’s errand, but I’m willing to put my chips on Brees and Payton leading the Saints to the playoffs in a “bounceback” year. The real question is whether that will be enough to convince the voters to select Payton.

As it turned out, Payton did lead a resurgent Saints team from 7-9 in 2012 to 11-5 in 2013; unfortunately for him, a playoff berth was not enough to get him Coach of the Year. That honor instead went to Ron Rivera, although in my eyes, Andy Reid was an immensely more deserving choice.

What can we learn: In week 16, the Panthers defeated the Saints on a touchdown pass with 28 seconds left in the game; had New Orleans won that game, the Saints would have finished 12-4 and won the division and a first round bye, knocking Rivera’s Panthers down to the 5 seed. Would that have been enough to swing the COTY award to Payton? Probably not, although it likely would have meant Reid would have won the honor. The Coach of the Year award remains impossible to predict.
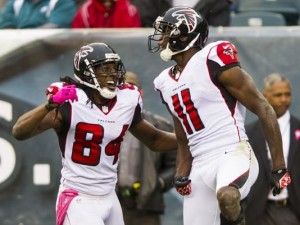
Did you just grab my torch?

Did you just grab my torch?.

Julio Jones and Roddy White star in Stealing The Torch, July 31, 2013

My other three NFC South posts were more walks down memory lane than predictions. The Falcons post was a look at other star wide receiver tandems that were similar to Julio Jones and Roddy White in 2012. This was a fun way to look at comparable receivers, but there was nothing fun about the Atlanta offense in 2013.  Jones averaged 116.0 yards per game last year, but that came over just five games. A foot injury suffered against the Jets in week 5 ended what looked to be a special season: Jones was leading the league in receptions (41) and was second in receiving yards (580) at the time. White, meanwhile, had an absymal start to his season that dragged on for months.

Hamstring and ankle injuries caused White to miss three full games and hampered his production in most of the others. At the end of November, he just 20 catches for 209 yards; at that point, the Falcons were 2-9, and I won’t fault you if you put Atlanta on “ignore” for the rest of the year. But White exploded with 43 catches for 502 yards in December, joining Josh Gordon (658) and Alshon Jeffery (561) as the only players with 500+ receiving yards in December 2013.

The Steve Smith Post, August 7, 2013

In August, I decided to compile the loose odds and ends I had collected on Steve Smith over the years. When the time comes, I plan on using that post to augment Smith’s Hall of Fame case. Unfortunately for Smith, the time may be coming sooner than he’d like. On December 1st, I wrote that Smith’s poor production may have been a reason for why Cam Newton’s numbers had declined.

Smith has had largely the same role in the Panthers offense for years, so it’s not unreasonable to compare his advanced metrics from each of Newton’s seasons.  In 2013, Smith caught 58.2% of his targets, which is in line with his production from 2012 (52.9%) and 2011 (61.2%). However, Smith started running much shorter routes — according to NFLGSIS, his average reception came just 8.9 yards downfield in 2013, compared to around 12 yards over the prior two years. Smith’s YAC also decreased (which is unusual, as shorter passes tend to lead to more YAC, making this another bad sign); as a result, his yards per target dropped from 10.8 in 2011 to 8.5 in 2012 to just 6.8 in 2013.  It was a down year in a Hall of Fame caliber career. Smith turns 35 in May; unfortunately, it seems safe to suggest that the best is behind him.

Can Tampa Bay Win the NFC South With the Worst Passing Attack?, August 13, 2013

Just about everyone assumed the Bucs would have the worst starting quarterback in the NFC South. What interested me was the rest of the team. The question I posed was more trivia than analysis: how often does the team with the worst passing attack in the division wind up winning the division?

The answer: Since 1950, only nine teams pulled off that feat, with nearly half of them coming since the league moved to a four-teams-per-division-for-each-division format in 2002. No team pulled off that feat in 2013, although the Panthers ranked 3rd in the NFC South in Adjusted Net Yards per Attempt. The team that ranked last in the division was, of course, the Bucs.

The Bucs ranked 32nd in NY/A and finished the year 4-12. But remember: Tampa Bay faced the hardest schedule in the league in 2013. Early DVOA estimates project the Bucs for 7.7 wins in 2014, and there are reasons for optimism in Tampa Bay in 2014.

{ 3 comments }

Jets, Falcons pull off rare feat

Is a left-arm-only Geno better than Sanchez?

Next on First Take: Is a left arm only Geno better than Sanchez?

Under Mark Sanchez, the Jets were never very good at completing passes, because of, well, Mark Sanchez. The Jets ranked 29th, 30th, 24th, and 30th from 2009 to 2012 in completion percentage. Over that four year period, no team completed fewer passes (1,080) or had a lower completion percentage (55.2%) than the Jets. But as bad as the Jets offense has been at completing passes, the defense was even more extreme at preventing completions. Over the last four full years, the top two single seasons in completion percentage allowed were recorded by the ’09 and ’10 Jets. The 2011 Jets ranked 4th in completion percentage allowed, while last year’s team ranked second. From 2009 to 2012, no team allowed fewer completions (1,069) or at a lower rate (52.6%) than the Jets. In fact, the 2nd best team at completion percentage allowed over that period, the Packers at 56.9%, were closer to the 18th best team in opponent’s completion percentage than they were to the Jets.

If you average the completion percentages of the Jets and their opponents over that four year period, you get an average completion percentage in Jets games of 53.8%, easily the lowest rate in the league (Arizona, Kansas City, and Oakland are next at 57.6, 57.7, and 57.7%).

Under Geno Smith and without Darrelle Revis, things hadn’t changed much.  Through four weeks, the Jets defense ranked — you guessed it, 1st in completion percentage allowed at 51.4%, while the Jets offense ranked 26th in completion percentage.

Switching gears for a second, only three games in NFL history had ever seen both teams complete 80% of their passes in a single game. What were the odds, then, that the 2013 Jets would be involved in the fourth such game? I have no idea, but I know they were really, really, really low. Yet on Monday Night against the Falcons, that’s exactly what happened.
[continue reading…]

{ 6 comments }

Did you just grab my torch?

Did you just grab my torch?

Randy Moss and Cris Carter. Torry Holt and Isaac Bruce. Reggie Wayne and Marvin Harrison. From time to time, a franchise with a star wide receiver manages to draft another one. At that point, we just wait and see how long it takes the young pup to steal the spotlight. Everyone succumbs to age, and eventually, the torch will be passed to the younger receiver. Even the GOAT wasn’t immune to Father Time (well, at least while he was in SF), as Terrell Owens eventually surpassed Jerry Rice as the 49ers top wideout.

Last year, Julio Jones and Roddy White both finished in the top 12 in fantasy points scored by wide receivers (using the formula 0.5 point per reception, 0.1 points per yard, and 6 points per touchdown). Since 1970, there have been 20 different pairs of wide receivers who met the following criteria:

  • Each wide receiver finished in the top 12 in fantasy points (using a 0.5 PPR scoring system)
  • The receivers were at least four years apart in age; and
  • The younger receiver was 26 year old or younger.

2012 FalconsJulio Jones (23) and Roddy White (31) (Matt Ryan)

Let’s start with the most recent entry.  At just 23 years old, Jones has established himself as one of the game’s best wide receivers.  White is presumably on the downside of his career, but he’s had a remarkable run.  Wide receiver numbers must be adjusted for era, but here’s a fun stat: White has topped 80 catches, 1100 yards, and 6 touchdowns in six straight seasons (2007-2012), a feat previously accomplished by only Marvin Harrison and Jerry Rice.
[continue reading…]

{ 7 comments }

More division wins than non-division wins

The Rams finished with the best division record in the NFC West last year at 4-1-1, but St. Louis went only 3-7 in games against non-NFC West opponents. The Jaguars were 0-10 in non-division games last season, but beat both the Colts and Titans to finish 2-4 against the AFC South. Since the merger, three teams have won six more games against division rivals than against non-division opponents. Two of those teams did so in 1998, when the Cowboys went 10-6 thanks to a 8-0 record against the NFC East and a 2-6 mark against the rest of the league (in the playoffs that year, Dallas lost to an NFC East team, a choke that was presumably not Tony Romo’s fault). Over in the AFC, the Titans finished 7-1 against the AFC Central and 1-7 against the rest of the NFL. Technically, the ’82 Dolphins went 7-1 against the AFC East and 0-1 against Tampa Bay during the strike-shortened season, so they fit the criteria, too.

In the new eight-division, four-teams-per-division format, each team plays six games against division opponents and 10 games against non-division opponents. The table below shows all teams since 2002 that won more at least 1.5 more games against division rivals than non-division opponents:
[continue reading…]

{ 0 comments }

And then he said, what's your deal?

And then he asked me what my deal was.

A couple of interesting notes, courtesy of Mike Sando on ESPN.com. The first is a good bit of trivia: Jim Harbaugh joins George Seifert, Barry Switzer and Rex Ryan as the only head coaches to reach the AFC or NFC Championship Game in each of their first two seasons as an NFL head coach. The second piece of information provides a possible clue as to how the game might unfold for Atlanta. Including the playoffs, the Falcons have allowed 8.9 yards per rush to quarterbacks this season, the worst rate in the NFL (excluding kneel downs).

To be fair, only three quarterbacks have done anything of note on the ground against the Falcons this year. Michael Vick rushed 7 times for 42 yards in a 30-17 loss. Vick had two first down carries that went for four yards, two third and long carries that went for 10 total yards but no first downs, and then three runs on 3rd and 3 or 4 where he picked up the first down. That’s not good, but not too alarming.
[continue reading…]

{ 5 comments }

Yesterday, I previewed Saturday’s games with um, mixed results (skip the Denver-Baltimore preview and just read the San Francisco-Green Bay breakdown twice). Let’s take another crack at it by examining Sunday’s matchups.

Seattle Seahawks (11-5) (+1) at Atlanta Falcons (13-3), Sunday, 1:00PM ET

An offense where the star eats Skittle is a young one

Did you know Marshawn Lynch eats Skittles?

Once again, Atlanta is tasked with facing a dominant wildcard team. Is this the year Matt Ryan finally silences his critics?

Atlanta is only a one-point favorite, just the seventh time a home team has been given such little respect this late in the season since 2000. Home teams are 3-3 when underdogs or small favorites over that span in the divisional conference championship rounds, although one of those losses came by the Falcons in 2010 against the Packers when Atlanta was a 1.5-point favorite. But let’s focus on these two teams, because the stats might surprise you.

Russell Wilson edges Matt Ryan in Y/A (7.9 to 7.7), AY/A (8.1 to 7.7), and passer rating (100.0 to 99.1), despite having a significantly worse set of receivers. Ryan does have the edge in NY/A (7.0 to 6.8) but the two are deadlocked in ANY/A at 7.0. Both quarterbacks led four 4th quarter comebacks this year, and Wilson led 5 game-winning drives while Ryan led six. Considering one quarterback has Roddy White, Julio Jones, and Tony Gonzalez, and the other is a 5’10 rookie, I consider this pretty remarkable.
[continue reading…]

{ 5 comments }

Matt Ryan is about to throw a touchdown or an interception, depending upon the month

Matt Ryan is about to throw a touchdown or an interception, depending upon the month.

For the second time in three years, the Atlanta Falcons are the NFC’s number one seed. Just like in 2010, the Falcons started this season 13-2 but ended the year with only 11 Pythagorean wins. In 2010, Atlanta lost its first game to the #6 seed Packers, who sported the highest SRS of any NFC team in 2010. This year, Atlanta hosts the #6 seed Seahawks, who finished 2012 with highest SRS of any NFC team. History suggests that this is a difficult challenge for Atlanta, regardless of the Falcons’ lofty record.

One of the obvious topics the mainstream media has hit on this week has been Matt Ryan’s inability to win in the playoffs. As everyone knows, Atlanta is 0-3 in the playoffs in the Mike Smith/Matt Ryan era. As Ryan prepares for his fourth playoff start on Sunday, history offers some comfort: four other quarterbacks (since 1950) have been in exactly the same situation, entering their fourth playoff start with an 0-3 record. Those quarterbacks went 3-1 in their fourth game. Let’s stroll down memory lane.

  • At age 37, Y.A. Tittle and the New York Giants went to Soldier Field to battle the famed 1963 Bears. Tittle had gone 0-3 in his previous three NFL playoff games, and had lost his lone playoff game in the AAFC, too. In 1957, Tittle was on the wrong side of the most famous comeback in playoff history prior to Bills/Oilers. In that game, Tittle threw three touchdowns against the Lions as San Francisco opened up what looked to be an insurmountable 27-7 lead. But Tittle finished the day with three interceptions, and the Lions came back and won, 31-27. In 1961, Tittle was with the Giants, and was part of an embarassing 37-0 shutout on the quite literal frozen tundra of Lambeau Field. Tittle was a miserable 6/20 for 65 yards with 4 interceptions. The next year, the Giants and Packers met again, this time at a frozen and windy Yankee Stadium, with the Packers again topping the Giants. [1]This was the first game Ed Sabol filmed for the NFL, under the label Blair Motion Pictures. So you can imagine that when Tittle and the Giants had to travel to Soldier Field in 1963 — the Giants third straight year in the title game — Tittle probably carried the choker label. With a wind chill of -11 degrees, the weather was again miserable, and the result was more of the same for Tittle and New York. The Giants lost 14-10, and Tittle threw 1 touchdown against 5 interceptions.
  • Jack Kemp took the Chargers to the AFL title game in the league’s first two seasons. On New Year’s Day 1961, Kemp was outplayed by Houston’s George Blanda, and Billy Cannon put the final nail in the coffin as the Oilers won, 24-16. The Oilers and Chargers met again in the title game the following year — this time in San Diego — but Kemp had a miserable game, throwing 4 interceptions as the Chargers lost, 10-3. By 1963, Kemp was with the Bills, and Buffalo had finished the year tied with the Patriots, setting up a one-game playoff for the division title at War Memorial Stadium. But Kemp struggled and was benched for Daryle Lamonica at halftime, as the Bills lost 26-8. In 1964, the Bills went 12-2, and entered the AFL title game against Kemp’s old team, San Diego. At this time, Kemp had an 0-3 post-season record, and surely Chargers fans taunted the citizens of Buffalo by calling Kemp the Mayor of Chokesville. While Kemp did not produce stellar numbers, the Bills managed to defeat the Chargers and capture their first AFL championship. The hero of the game may have been Mike Stratton, who produced the “hit heard round the world” early in the game, knocking out San Diego’s Keith Lincoln. In any event, the Mayor of Chokesville was able to abdicate his throne.
  • [continue reading…]

References

References
1 This was the first game Ed Sabol filmed for the NFL, under the label Blair Motion Pictures.
{ 5 comments }

Checkdowns: Deja vu for the Falcons?

Mike Smith's team either just converted a 4th-and-1 or won another one-point game.

Mike Smith's goal in 2013 is to face a bad #6 seed for a change.

Much has been written this season arguing that the Falcons are not as good as their 13-3 record. Conversely, the Seahawks have emerged as a favorite among some in our advanced statistical community: Brian Burke ranks Seattle as the third most efficient team, Aaron Schatz ranks them number one, and Pro-Football-Reference ranks Seattle second in the SRS behind only the Patriots.

Here’s a quick way to summarize the Falcons-Seahawks game on Sunday: Atlanta won two more games than Seattle this season but the SRS says that the Falcons are 5.7 points worse than the Seahawks. That’s based on the fact that (1) Seattle has outscored opponents its by 2.9 more points per game than Atlanta outscored its opponents this year, and (2) Seattle faced a schedule that was 2.8 points per game harder than Atlanta’s schedule.

How often does it happen that a home team in the playoffs won 2+ more games than its opponent but was at least 5 points worse than that opponent in the SRS? This is just the second time such a matchup has occurred in the last 10 years… and the first involved the 2010 Falcons. In fact, this scenario has only unfolded five times since 1970:

YearBoxscoreTmOppRdSRS TMSRS OPPSRS DIFFWIN TMWIN OPPWIN DIFFPFPAW/L
2012BoxscoreATLSEAD6.512.2-5.713112
2010BoxscoreATLGBD611-5131032148L
1999BoxscoreTENBUFW17.2-6.2131122216W
1982BoxscoreRAINYJD5.310.7-5.48621417L
1976BoxscoreRAIPITC8.515.3-6.813103247W

[continue reading…]

{ 1 comment }

Season in review: AFC and NFC South

Last week I reviewed the seasons of the teams in the AFC East and NFC East and in the AFC North and NFC North. Today we’ll review the interesting seasons from the AFC and NFC South divisions.

In the AFC South, I had the bottom three teams projected for between 5 and 6 wins for a five week stretch starting after week two. As we now know, that was resolved quite definitively by the end of the year:

AFC South

Houston Texans

Pre-season Projection: 10 wins
Maximum wins: 14 (after week 15)
Minimum wins: 10 (after week 1)
Week 1 comment: Going to win the AFC South going away; this team could win 12 games, but concerns about injuries and the potential to rest starters late keep them at 10 wins for now.

A miserable December ruined what should have been a marvelous season in Houston. At no point did I project any of the other AFC South teams to finish within even three games of the Texans. When they were 5-0, I wrote: Not only do the Texans still have 6 home games remaining, but they have 4 more games against the AFC South and get the Bills and Lions. Even without Brian Cushing, I don’t see why they don’t win 8 more games.

The Texans schedule was easy, but they also had dominant seasons out of J.J. Watt and Andre Johnson. Left Tackle Duane Brown was outstanding, and Houston is as good as any other team in the league when they’re at their their best. Unfortunately, they might be undermanned in a gunfight with the Broncos or Patriots, and it looks like now they’ll have to beat both of those teams to get to New Orleans. Still, I give the Texans a fighting chance; Matt Schaub has struggled in primetime games, but that doesn’t really mean anything. In the end I think the week 17 loss submarined their playoff hopes, and the team will be left wondering how good they could have been if Cushing stayed healthy.

Indianapolis Colts

Pre-season Projection: 5.5 wins
Maximum wins: 10 (after week 12 through the end of the year)
Minimum wins: 4 (after week 1)
Week 1 comment: There will be growing pains in Indianapolis. But nobody feels bad for their fans, nor should they; the Colts will be contenders each year for a decade, starting next season.

I never got on board with the Colts this year and it only looks worse in retrospect. On the other hand, even though Indianapolis finished 11-5, they were still outscored by 30 points in 2012. They struggled to beat Brady Quinn and the Chiefs and split with the Jaguars. The Colts won just two game by more than a touchdown.

While I missed on the Colts overall, I was on board the Andrew Luck bandwagon early on even when his numbers were terrible. I wrote this before the Colts-Packers game: Andrew LuckAaron Rodgers I won’t steal the spotlight from Tom BradyPeyton Manning XIII; by the time these two teams play again in four years, we may be looking at the best two quarterbacks in the league. I highlighted how Luck was being undervalued by conventional statistics after week 7, and wrote this after week 8: A wildcard darkhorse? I don’t think the Colts are very good — they’re just 29th according to Football Outsiders — but a win over Miami this weekend puts them in the driver’s seat. I finally projected them at 10 wins after week 12, and noted: Basically clinched a playoff berth with win over Buffalo and Steelers loss. Hard not to like this team.

They may not be very good, but they certainly are likeable. Even after the upset win over the Texans, Houston is just the 10th team to make the playoffs after being outscored by at least 30 points.
[continue reading…]

{ 2 comments }

Game Scripts, Part III – 2012 results

Last week, I introduced the concept of Game Scripts in Part I and Part II of this series. The short explanation is that a team’s Game Script score is simply the average score during each second of every game. Today, we’re going to look at some data from the 2012 season, although I have not yet included the data from this past weekend (week 13).

Let’s start with a look at the game scripts for each team this season.

TeamGScript
Patriots118.3
Texans114.8
49ers114.8
Bengals113.9
Bears113.8
Falcons113.6
Chargers113.3
Giants112.8
Buccaneers112.5
Ravens112.3
Redskins112.1
Packers112.1
Seahawks111.7
Steelers111.4
Vikings110.8
Broncos110.5
Saints110.2
Dolphins11-0.1
Colts11-1
Panthers11-1.6
Bills11-1.9
Cardinals11-2
Rams11-2
Browns11-2.1
Lions11-2.2
Cowboys11-3.4
Titans11-4
Jets11-4
Jaguars11-4
Eagles11-5.1
Raiders11-7.4
Chiefs11-7.6

There aren’t too many surprises on there. The Patriots are 8-3 (in this data set) with a record-setting offense; they have had a number of blowout victories and their three losses came by a combined four points. The Texans and 49ers also have impressive Game Script scores, and many would consider those three the three best teams in the league. Cincinnati might be a little surprising up at the top, but the Bengals were 10th in points differential through eleven games and third in points differential in the first half. Remember, the Game Script score is designed to be descriptive, not predictive; it’s not saying that Cincinnati is the 4th best team, it’s simply revealing the fact that the Bengals have, on average, led by 3.9 points in each second of every game they’ve played this year. That’s mostly because Cincinnati has been a great first half team.
[continue reading…]

{ 7 comments }

NYT Fifth Down: Post-week 12

My article for the New York Times this week takes a look at one interesting statistic for each of the eight division winners.
 

Atlanta Falcons – Record in Close Games
In 2010, Atlanta raced to a 10-2 record on the strength of an improbable 7-1 record in games decided by 7 or fewer points. How a team fares in close games has a heavy impact on a team’s final record, but statisticians agree that such a metric holds little predictive value. The Falcons earned the No. 1 seed in the N.F.C. thanks to their success in close games, but ranked only seventh in the Football Outsiders advanced statistical rankings and 21st in the Advanced NFL Stats efficiency ratings. Atlanta lost badly in its playoff opener, not surprising to those who felt the Falcons’ record was more mirage than reality.

This season, Atlanta has raced to a 10-1 record on the strength of an improbable 7-1 record in games decided by 7 or fewer points. Football Outsiders ranks the Falcons 12th, and according to its founder, Aaron Schatz, the Falcons have by far the worst efficiency rating of any of the 18 teams that have started 10-1 since 1991. Advanced NFL Stats is slightly more generous, placing the Falcons fifth, although the gap between the fifth and 12th teams in its rating is miniscule. The takeaway: Don’t get caught up in the Falcons’ record. It will give Atlanta a bye, but no other guarantees come with it.

San Francisco – Top Pass Defense in the N.F.L.

Last season, the 49ers’ reputation for having an elite defense was built on their superb run defense, which ranked first in rushing yards allowed, rushing yards per carry allowed and rushing touchdowns allowed. But the 49ers were not dominant against the pass, ranking ninth in net yards per pass attempt allowed. This season, the San Francisco defense is without weakness.

The 49ers (8-2-1) actually lead the N.F.L. in net yards per pass attempt allowed. In the process, the 49ers lead the N.F.L. in points allowed, and their defense ranks in the top three in both first downs allowed and Pro-Football-Reference’s Expected Points Added statistic. The run defense remains stout, ranking in the top four in yards, yards per carry and touchdowns allowed, but the improvement in the pass defense makes this an even better defense than the 2011 version. As long as San Francisco continues to shut down opposing passers, it won’t matter very much whether Coach Jim Harbaugh picks Alex Smith or Colin Kaepernick at quarterback.

Chicago – 11th in Points Scored Without an Offense

As a technical matter, the Bears (8-3) rank 11th in points scored. Just don’t let anyone tell you that in the context of a story about how Chicago’s offense is underrated. The Bears have scored eight non-offensive touchdowns this season — seven on interception returns, one on a blocked punt — and their great defense and special teams consistently set up the offense for success even when those units aren’t scoring touchdowns. Chicago is in the bottom five in Net Yards per Attempt, Adjusted Net Yards per Attempt, total yards and sacks allowed. The Bears’ running game benefits from a high number of carries, but ranks below average in both yards per carry and PFR’s Expected Points Added statistic.

The defense is excellent, but a poor offensive line and mediocre wide receiver talent behind Brandon Marshall leave the Bears with one of the worst offenses in the N.F.L. — regardless of how many points they’ve scored. Advanced NFL Stats ranks the Bears’ offense as the second worst in the league.

You can read the full article here.

{ 5 comments }

Why trust this guy?

Falcons head coach Mike Smith made a couple of interesting decisions in the 4th quarter of Atlanta’s loss to the Saints on Sunday. And by interesting, I mean conservative. The first strategic blunder came when his team scored a touchdown with 13 minutes remaining, to cut the lead to 28-23 pending the point after. Smith’s absurd reasoning doesn’t merit discussion, and according to Bill Barnwell and the footballcommentary folks, Atlanta should have gone for it if they had just a 23% chance of converting.

Jason Lisk highlighted what was likely in Smith’s head: we don’t know who is going to kick the next field goal. Sure, if it’s the Falcons, then you want to go for two, but if it would be New Orleans (the team about to gain possession) then we’re in a 7-point game situation, so the extra point is the conservative right play.

But here’s the easy shorthand: if the downside to missing the two-point conversion is limited to you needing a two-point conversion later to even things up, then going for it is usually the correct call.

What is the advantage to being down 3 vs. being down 4? Well a field goal ties the game, and even if the opponent kicks a field goal, a touchdown will win it for you.

What is the disadvantage to being down 5 vs. being down 4? Well, a field goal is meaningless in either case (or, if it’s not meaningless, one field goal still leaves you one field goal away from taking the lead). The big disadvantage is that if New Orleans scores, the Falcons would have been down 8 as opposed to being down 7. But in coach-speak, being down 8 is one-possession game just like being down 7 is! That’s obviously not true, but in this case, the downside to going for 2 is essentially cut in half, because you get a second bite at the apple.

In other words, 50% of the time that you ‘go for two’ following a touchdown when trailing by 11, you will be down by 3 and glad you were aggressive; 25% of the time you go for 2 you will have some short-term discomfort, but this will be alleviated when you convert the next touchdown (which you need anyway if you don’t go for two). Only 25% of the time will this move blow up in your face. This is exactly the same logic that dictates that a team, down by 14, should go for two after scoring the first touchdown.

Considering Atlanta’s odds of converting the two-point attempt had to be greater than 50/50, considering that’s roughly the league average, Atlanta’s offense is great, and New Orleans’ defense is terrible, that makes going for two the obvious correct call.

Of course, Smith also made an ugly mistake when he kicked a field goal from the Saints’ two-yard-line when trailing by 4 points with nine minutes left. Had he gone for 2 earlier, I could at least understand the logic of kicking the field goal, even if I wouldn’t do it. But down by 4, he passed up a 50/50 chance to take a three-point lead to cut the lead to 1? Even if he missed, the Saints would have been backed up near the own goal, and a three-and-out would have likely put the Falcons a first down or two away from getting that precious field goal.

{ 2 comments }

Sunday morning, I noted that the Falcons had a 2.4% chance of going undefeated and that the team most likely give them their first loss was the Dallas Cowboys. After Atlanta’s victory on Sunday night, they halfway to perfection. This is the first time in franchise history the Falcons have started off 8-0, although star tight end Tony Gonzalez once played on a 9-0 team and Matt Ryan went 8-0 in 2007 at Boston College. After the victory over the Cowboys, what is the current probability that Atlanta goes 16-0?

First, we need to calculate SRS standings. Neil gave us his Weighted SRS Ratings earlier today, but the table below shows the vanilla SRS ratings:

RkTeamGMOVSOSSRS
1San Francisco 49ers810.81.111.8
2Chicago Bears814.5-2.811.7
3New England Patriots812.3-1.510.7
4Houston Texans811.8-2.19.6
5Denver Broncos87.51.69.1
6New York Giants97.318.4
7Atlanta Falcons89.6-2.37.4
8Green Bay Packers95.41.67
9Seattle Seahawks92.13.25.3
10Tampa Bay Buccaneers85.1-1.83.3
11Dallas Cowboys8-3.15.72.6
12Pittsburgh Steelers84.1-2.12.1
13Miami Dolphins83.4-2.31
14Detroit Lions81.3-0.50.7
15Baltimore Ravens82.9-2.20.7
16Carolina Panthers8-3.94.50.6
17Washington Redskins9-2.11.2-0.9
18Minnesota Vikings90.4-1.3-0.9
19Arizona Cardinals9-3.62.1-1.5
20New Orleans Saints8-1.4-0.3-1.7
21San Diego Chargers83.5-5.3-1.8
22New York Jets8-4.82.6-2.1
23St. Louis Rams8-6.94.3-2.6
24Philadelphia Eagles8-6.31.1-5.2
25Cincinnati Bengals8-3.6-1.9-5.5
26Indianapolis Colts8-4.8-1.9-6.6
27Cleveland Browns9-5-2.6-7.6
28Oakland Raiders8-7.3-0.7-7.9
29Buffalo Bills8-7.8-0.8-8.5
30Jacksonville Jaguars8-12.81-11.7
31Tennessee Titans9-14.31.9-12.4
32Kansas City Chiefs8-13.4-1.3-14.7

[continue reading…]

{ 3 comments }

In this post by Neil, he provided a formula to predict each team’s likelihood of winning a game based on the Vegas point spread. With the help of the SRS, we can come up with a projected point spread for each game, and therefore figure out which team is most likely to give the Falcons their first loss.

The table below shows the SRS rating for Atlanta and each of their remaining opponents, along with the projected point spread in the game (based on the difference between the two SRS scores and home field) and the concomitant projected win probability. Note that in the Dallas game, the projected line is Atlanta -8.6, which would yield a 73.2% win probability; since the actual line is Atlanta -4, for the purposes of that game, I will be using the real line and not the projected one.

WkOppATL SRSOPP SRSProj LineWin Prob
9Dallas Cowboys7.51.9-461.3%
10@New Orleans Saints7.5-3.3-7.871.3%
11Arizona Cardinals7.5-0.6-11.178.8%
12@Tampa Bay Buccaneers7.53.1-1.454%
13New Orleans Saints7.5-3.3-13.884%
14@Carolina Panthers7.5-1-5.565.4%
15New York Giants7.510-0.551.4%
16@Detroit Lions7.5-0.5-564.1%
17Tampa Bay Buccaneers7.53.1-7.470.3%

As you can see, the Falcons are projected to be a favorite in every remaining game, with the Giants game looming as the most difficult challenge. The probability of Atlanta winning each of their remaining 9 games is only 2.4%.

But figuring out which team is most likely to be the first to defeat the Falcons is a trickier question. The Cowboys are the obvious pick, in part because they’re up first and in part because they’re one of the most challenging remaining opponents for the Falcons. What are the odds that the Giants become the first team to knock off the Falcons, like they did to the Patriots in ’07 and the Broncos in ’98? For that to happen, the Giants would need to beat Atlanta (51.4%) plus the Falcons would need to beat Dallas, Arizona, Tampa Bay, Carolina, and New Orleans twice before their game with New York. The probability of Atlanta winning all of those games is just 10.2%, so there is only a 1-in-20 chance that New York performs its giant-killer act again.

To calculate the odds of the opponent in each week being “the team” to knock off the Falcons, we simply have to perform the same math. Therefore, the table below shows the likelihood of Atlanta first losing (in each week) to each team:

WkOpponentProb
9Dallas Cowboys38.7%
10New Orleans Saints17.6%
12Tampa Bay Buccaneers15.9%
11Arizona Cardinals9.3%
14Carolina Panthers5.4%
15New York Giants5%
13New Orleans Saints3%
16-0Undefeated2.4%
16Detroit Lions1.9%
17Tampa Bay Buccaneers1%

Even though they’re not favored to win the game, since we can’t pick “the field”, the Cowboys are the team most likely to ruin the Falcons’ perfect season. As of today, New Orleans is next with a 20.6% chance thanks to two bites at the apple; meanwhile, the Falcons are more likely to go undefeated than they are to go 14-0 only to have the Lions ruin perfection.

{ 2 comments }