≡ Menu

The Chargers Had The Worst Fumble Luck In 2019

Every season, I like to look at each team’s fumble recovery data. The evidence suggests that when the ball is on the ground, teams aren’t better or worse at recovering those fumbles; in other words, the recovery is driven more by randomness than skill.

Let’s begin with looking at fumbles from the perspective of the offensive team. The New Orleans Saints had the fewest fumbles in the league last season, at just 9. Even more impressive, the Saints lost just two fumbles all year! Of course, that luck didn’t hold up in the postseason: New Orleans lost a critical fumble in the team’s opening playoff game, contributing to the surprise loss to the Vikings.

On average, the fumbling team recovered (or the ball went out of bounds, so the fumbling team retained possession) 53.5% of all fumbles in 2019. No team was “luckier” at recovering their own fumbles than the Saints, but the Broncos actually gained the biggest advantage due to having fumbled much more often. Denver fumbled 21 times last season; that means we would “expect” the Broncos to lose 9.75 of those fumbles. In reality, the team lost just 6 fumbles, meaning Denver recovered 3.75 more fumbles than we would have been expected. Non-QBs for the Broncos fumbled 10 times, but they lost just 2 of those fumbles.

The least fortunate team was the Colts. In 2019, Indianapolis fumbled 18 times, and lost 11 of them! Jacoby Brissett himself lost 5 of 7 fumbles. The table below shows the full fumble data for each offense in 2019: [continue reading…]

{ 3 comments }

The Vikings Had The Worst Fumble Luck In 2018

The Vikings and Falcons were two of the most disappointing teams in the NFL in 2018. They happened to be the two teams with the worst fumble recovery rates last year, which is largely driven by luck. On the other side, the Seahawks and Rams had the best two fumble recovery rates, and were two of the most overachieving teams in football last year.

The table below shows the fumble numbers for each team last year when they were the ones with the football. Seattle and Washington had the best fumble recovery luck in this state of the world (i.e., teams on offense). The Seahawks and Redskins each had 18 fumbles, and only lost 4 fumbles. That’s a 78% offensive fumble recovery rate, the best in the league. The average team recovered 57% of their own fumbles. The final column, therefore, shows the number of own fumbles a team recovered over expectation. For Seattle and Washington, they each recovered 3.8 more fumbles than we would expect, since they had 18 fumbles (we would have expected them to recover 10.2 own fumbles, but actually recovered 14). The full list below: [continue reading…]

{ 1 comment }

The Saints Had The Worst Fumble Luck In 2017

There were 644 fumbles during the 2017 season, with 276 being recovered by the opposing team. That’s a 43% fumble recovery rate for the defense, and a 57% fumble recovery rate for the offense; in other words, exactly 3 out of every 7 fumbles were recovered by the opposing team, and 4 out of every 7 fumbles were recovered by the fumbling team.

The Baltimore Ravens fumbled 19 teams, but only lost 4 of those fumbles. So the Ravens offense recovered 79% of those fumbles, when we would have “expected” them to recover 10.9 of those fumbles. Therefore, Baltimore recovered 4.1 more fumbles than we would have expected. On defense, Baltimore’s opponents had 22 fumbles, and Baltimore recovered 12 of those 22 fumbles. So the Ravens defense recovered 55% of all fumbles by opponents, when we would have “expected” them to recover 9.4 of those fumbles; therefore, Baltimore’s defense recovered 2.6 more fumbles than expected. Add it up, and there were 41 times that the football hit the ground during Ravens games, and Baltimore recovered 27 of them, which was 6.7 more than expected.

On the other side of things we have the New Orleans Saints. Despite being one of the best teams in the NFL last season, New Orleans had really bad fumble luck (perhaps that’s why they “only” went 11-5 despite being the most efficient team in the league). On offense, the Saints had 19 fumbles but only recovered 9 of them; that’s 1.9 fewer fumbles recovered than expected. And on defense, New Orleans forced 20 fumbles but only recovered 5 of them, which was 3.6 fumbles below average! Together, the Saints recovered just 14 of 39 fumbles in all games, which was 5.4 fewer fumble recoveries than expected. [continue reading…]

{ 1 comment }

On average, the fumbling team has recovered 56% of all fumbles this year. But that hasn’t been the case with the Giants. New York has fumbled 11 times this year, which means you would expect them to recover 6.2 of those fumbles. But the Giants have 8 lost fumbles this year, which means the team has recovered only 3 of those 11 fumbles, or 3.2 fewer fumbles than expected.

That’s really bad, although not the worst in the league. Carolina has fumbled 7 times, so we would expect the Panthers to have recovered 3.9 of those fumbles. Instead? Carolina is 0-for-7, so the Panthers have recovered 3.9 fewer fumbles than expected.

But the Giants haven’t recovered the ball frequently when their opponent fumbles, either. New York’s opponents have 8 fumbles, so you would expect the Giants to have recovered 3.5 of them (or, stated another way, that their opponents should have recovered 4.5 of them). But Giants opponents have lost just one fumble this year, so New York has recovered 2.5 fewer fumbles than expected in this area of the game, too. Add it up, and that means the Giants have recovered 5.7 fewer fumbles than you would think. And that New York has recovered just 21% of all footballs to hit the ground in their games, regardless of the fumbling team

Here’s the data for all 32 teams through week 8 plus Thursday night. Here’s how to read the Steelers line. Pittsburgh has 9 fumbles of its own, but has only lost 2 fumbles, so the Steelers own fumble recovery percentage is a robust 78%, and Pittsburgh has recovered 2.0 more fumbles than expected. Meanwhile, Steelers opponents have 10 fumbles, and Steelers opponents have lost 5 of them, so the Steelers have recovered 50% of all fumbles here, too. [1]Note that “Opp FR%” means percentage of opponents fumbles that your team recovers. So Denver, at 72.7%, has recovered a lot of those fumbles. This means the Steelers have recovered 0.6 more fumbles than expected of their opponents, and therefore 2.6 more fumbles overall than expected. The final column shows that Pittsburgh has recovered 63.2% of all fumbles in play this year, second most to those always-lucky Browns. [continue reading…]

References

References
1 Note that “Opp FR%” means percentage of opponents fumbles that your team recovers. So Denver, at 72.7%, has recovered a lot of those fumbles.
{ 3 comments }

2014 Fumble Recovery Data

There are few statistics more random in all of sports than fumble recoveries. When a football is on the ground, it’s not the case that better teams are more likely to fall on the ball than bad teams: in the NFL, recovering fumbles is nearly all luck and little skill. This is a fact widely accepted by all statisticians, and I also ran a study which confirmed such intuition just last year.

The 49ers fumbled 18 times in 2014; San Francisco also forced 18 fumbles. When the 49ers fumbled, they managed to recover (or have the ball go harmlessly out of bounds) just six fumbles; when they forced a fumble, they… also only recovered just six times! So of the 36 times the ball hit the ground, San Francisco recovered 12 times, and lost it 24 times. [continue reading…]

{ 4 comments }

The Patriots won Super Bowl XLIX, and whatever your thoughts on the end of the game, there’s no doubt that New England was one of the top teams in the NFL in 2014. But it’s not quite so easy to identify why, at least when looking at the traditional per-play metrics. New England ranked 17th in Net Yards per Pass Attempt and 16th in Net Yards per Pass Attempt allowed, hardly the stuff of Super Bowl champions. The Patriots didn’t stand out as particularly excellent as a rushing offense or a rushing defense, either.

But those passing statistics belie the fact that the Patriots did, in fact, have a great offense this year. Part of the issue was the slow start and a meaningless week 17 game. Beginning in week 5, and excluding the week 17 game, New England scored 487 points, a 34.8 points per game average. That matches what the team did in 2012, when the Patriots had a historically lethal offense. And it’s not too far off from even the heights reached by the ’07 team.

The Patriots passing attack ranked 5th in TD rate, 3rd in INT rate, and 4th in sack rate; as a result, they jump from 17th to 6th when moving from NY/A to ANY/A. But the Patriots were even better at pure scoring. [1]While New England moves at a fast pace, they actually ranked 3rd in points per drive and 4th in overall points, because the Broncos had even more drives than New England. That’s been a trend for the team: during the Tom Brady era, New England has fared better in points scored than it has in ANY/A, and fared better in ANY/A than the team has in NY/A. And New England has generally been improving in all three statistics, too.

There is one area where the 2014 Patriots stand out as special. New England had just 13 turnovers all season: 9 Brady interceptions, three Brady fumbles, and one Brandon LaFell fumble. That is tied for the third best ever, although that sounds better than it is. The record for turnovers per game is 10 turnovers per 16 games, a feat accomplished by the 2010 Patriots and then the 2011 49ers. In 2014, the Packers also committed just 13 turnovers, and the Seahawks had just 14. As you might suspect, yes, this does mean that turnover rates have declined significantly in recent history. Take a look at the following graph, which depicts turnovers per 16 games for the average NFL team since 1970.  The purple line shows all turnovers; the blue and red lines are for interceptions and fumbles lost, respectively. [continue reading…]

References

References
1 While New England moves at a fast pace, they actually ranked 3rd in points per drive and 4th in overall points, because the Broncos had even more drives than New England.
{ 9 comments }

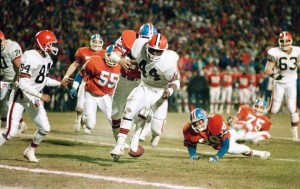
Take heart, Browns fans: there was a 50% chance Cleveland would recover this

Take heart, Browns fans: there was a 50% chance Cleveland would recover this fumble.

There are few statistics more random in all of sports than fumble recoveries. When a football is on the ground, it’s not the case that better teams are more likely to fall on the ball than bad teams: in the NFL, recovering fumbles is nearly all luck and little skill. This is a fact widely accepted by all statisticians, but I figured I would still crunch the numbers just to confirm.

I looked at all teams from 1990 to 2012. First, I looked at fumble recovery rates for teams on their own fumbles. The correlation coefficient between fumble recovery rate in Year N and fumble recovery rate in Year N+1 was 0.00. In other words, there is simply no correlation between fumble recovery rates from year to year. Nada. Zilch. (Of course, fumble recovery rates do vary by type, but that appears to be muted when analyzing fumbles in the aggregate.)

I then looked at fumble recovery rates for teams on their opponent’s fumbles. The correlation coefficient there from year-to-year was -0.02. In other words, there is simply no correlation between recovering your opponent’s fumbles in one year and the next. The best way to predict each team’s fumble recovery rate is to simply project teams to recover about half of all their fumbles. [1]Actually, the best number is usually just shy of fifty percent. If words like regression cause your eyes to roll over, consider this: from 1990 to 2012, the top 20 teams in fumble recovery rate recovered 75.4% of their own fumbles; the following year, they recovered 50.4% of their own fumbles.

With that disclaimer out of the way, who were the best and worst teams at recovering fumbles in 2013? Let me walk through the Cowboys as an example. Last year, Dallas fumbled on offense 18 times, and lost 8 of them. Based on the league-wide average 47.6% recovery rate last year, the Cowboys lost 0.6 fewer fumbles than expected (a negative number here means the team did not lose as many fumbles as they “should” have). Cowboys opponents fumbled 16 times and lost 13 of them; as a result, Dallas recovered 5.4 more fumbles than we would have expected. Overall, this means the Cowboys recovered 6.0 more fumbles than expected, the highest number from last season; overall, on the 31 fumbles in Cowboys games, Dallas recovered 67.6% of them. [continue reading…]

References

References
1 Actually, the best number is usually just shy of fifty percent.
{ 6 comments }

Tony Gonzalez is good at not fumbling

Gonzalez has made 13 Pro Bowls.

Gonzalez has made 13 Pro Bowls.

Do you remember Robert Thomas? He was selected by the Rams with the 31st overall pick in the 2002 draft. He started 30 games at linebacker for the team in three years, grabbed a cup of coffee in Green Bay, and then had three forgettable years with the Raiders during the nadir of the Al Davis era.

In week 16 of the 2006 season, the 7-7 Chiefs traveled to Oakland to face the 2-12 Raiders. Kansas City held a 10-6 lead when they took possession with 11:38 left in the second quarter. Trent Green completed a short pass to the right side of the field to Tony Gonzalez, who was tackled by Thomas. In the process, Thomas jarred the ball loose from Gonzalez, and Kansas City’s second-string tight end, Kris Wilson, pounced on the ball and recovered, keeping possession for the Chiefs. Kansas City eventually won 20-9, and clinched the playoffs by winning the following week against Jacksonville. Oakland finished 2-14 and was rewarded with JaMarcus Russell.

Thomas’ fumble wouldn’t even register as a footnote in the game recap, let alone seven years later. But here’s the thing: from the start of the 2000 season until that play began, Gonzalez had caught 547 passes and fumbled zero times. Since that fumble, Gonzalez has caught 526 receptions… and zero fumbles. Thomas’ forced fumble was the only time since 2000 that Gonzalez has ever let the ball hit the ground.

That crazy stat comes courtesy of Bill Barnwell on this podcast. After hearing about it, I decided to see look up career fumble rates. Excluding the postseason, Gonzalez has 6 career fumbles while recording 1242 receptions, 2 rushes, and one pass attempt. That’s a fumble rate of under half-a-percent per touch! That’s the second best rate of any player to enter the league since 1950, minimum 1,000 touches (defined as every time a player touched the ball).

Who is number one? The guy who can’t stop fumbling in the NFL playoffs. Before presenting the list of the players with the top 100 fumble rates, let me get in a quick disclaimer. Fumble rates, in general, are declining. And the fumble rates are dramatically different on returns relative to running plays, which have different fumble rates than quarterbacks on pass plays, which is way higher than the fumble rates on a reception by a receiver. But hey, if you just want a list of fumbles per touch, ignoring context, check out below:
[continue reading…]

{ 4 comments }

Regular readers surely recall my “What are the Odds of That” post from this summer. In that article, I referenced an obscured Jacoby Jones stat: in 2011, he gained three times as many receiving yards against teams at the back end of the alphabet as he did against the teams he faced in the front of the alphabet. Then I asked, “what are the odds of that?”

This is a very good reason why it’s often inappropriate to apply standard significance tests to football statistics. Surely Jones’ splits would pass any standard significance test, signaling that his wild split was in fact “real” even though we know it wasn’t. With a large enough sample, you would expect to have false positives, which isn’t a knock on standard significant testing. If something is statistically significant at the 1% level, that doesn’t mean you shouldn’t expect to see a false positive if you have 100 different samples…

Some in the statistical community refer to this as the Wyatt Earp Effect. You’ve undoubtedly heard of Wyatt Earp, who is famous precisely because he survived a large number of duels. What are the odds of that? Well, it depends on your perspective. The odds that one person would survive a large number of duels? Given enough time, it becomes a statistical certainty that someone would do just that. Think back to the famous Warren Buffett debate on the efficient market hypothesis. Suppose that 225 million Americans partake in a single elimination national coin-flipping contest, with one coin flip per day. After 20 days, we would expect 215 people to successfully call their coin flips 20 times out of 20. But that doesn’t mean those 215 people are any better at calling coins than you or I am. The Wyatt Earp Effect, the National Coin Flipping Example, and my Splits Happen post all illustrate the same principle. Asking “what are the odds of that?” is often meaningless in retrospect. If you look at enough things, enough players’ splits, enough 4th quarter comeback opportunities, enough coin flips, or enough roulette wheel spins, you will see some things that seem absurdly unlikely.

In December, I highlighted Matt Schaub’s struggles in night games compared to day games as yet another example. Well now, Ray Rice is the latest protagonist in What are the Odds of That? In case you missed it, Rice fumbled twice in Baltimore’s playoff win over Indianapolis, with the Colts recovering both times. Rice has struggled with fumbles in the playoffs in the past, but he’s always been outstanding during the regular season at holding on to the ball. In 2012, he lost just one fumble — which went harmlessly out of bounds — giving him a clean record for the season. So what’s going on? Here’s what Bill Barnwell wrote earlier this week:
[continue reading…]

{ 5 comments }

Yesterday, I took a comprehensive look at offensive fumbles and the associated fumble rates. Let me first say that going through eleven years of play-by-play logs is an impossible one-man task, which means you need to write a lot of code to sort your way through the hundreds of thousands of plays.

Its pretty easy to do that for offensive fumbles; coding is not nearly as effective or efficient when it comes to unique fumbles. I’ve done my best to be both exhaustive and accurate, but am not particularly confident that I met either such goal. I’d love to hear from others who have studied fumbles by defensive and special teams players and compare notes — just drop a note in the comments or shoot me an e-mail. With that said….

Defensive Fumbles

According to my database, there were 115 interceptions where the defender fumbled on the ensuing return. The passing team wound up get the ball back 52 times (45.2%). The most memorable of these was when Marlon McCree intercepted a Tom Brady pass in a playoff game following the 2006 season; on the return, Troy Brown forced a fumble and Reche Caldwell recovered, keeping New England’s hopes alive. This, of course, means that 63 times (54.8%) the intercepting and fumbling team would retain possession after the turnover.

As you might imagine, trying to locate plays where a team recovered a fumble and then the recovering player fumbled is not one that was particularly easy to identify. Without spending an inordinate amount of time on this, I did look at all rushing and passing plays that appeared to have two fumbles. I surely missed some, but I found 37 examples. Only nine times (24%) did the team on offense get the ball back.

Kickoffs

If anyone could point me to a study on fumbles on special teams plays, I’d appreciate it. Parsing through the data was not easy, so I’m not going to pretend that I am 100% confident that I did this correctly. Note that I excluded all onside kicks and kickoffs where the receiving team was executing laterals.

There were 940 kickoffs that resulted in fumbles or muffs. The kickoff team recovered the ball 305 times, while the receiving team retained possession 635 times (67.6%). There were a total of 30,230 kickoffs, which means that roughly 3.1% of all kickoffs resulted in fumbles, and roughly 1% of the time the kicking team ended up gaining possession.

Punt returns

There were 30,777 punts in my database, and 1,085 punts where the returning team muffed or fumbled the punt return. Usually, the punt returning team would keep the ball — 731 times or 67.4% of the time to be exact. That leaves 354 times where the punting team would retain possession, or on 1.15% of all punts.

Punts/Kicks

My database shows only 45 field goal attempts (or possibly fakes) that were nixed due to fumbles (out of over 11,000 attempts; obviously not all field goal attempts that went awry were labeled as fumbles in the game recaps.). It’s true that 35 times the kicking team recovered the fumble, but it was always a short-lived victory. In each of those cases, the kicking team did not gain enough yards to pick up a first down. In fact, Tony Romo had the best single play following a fumbled field goal attempt, by rushing for 7 yards. And people say he’s not clutch! The other 22% of the time the defensive team recovered, and three times they scored a touchdown on that play.

My database shows only 35 fumbles by punters before punting — again, no doubt that some punts have been excluded from the sample. In any event, 70% of the time the punter or punting team recovered. Again, the important thing here is that regardless of who recovers, it would be extremely rare for the punting team to actually get a first down (only three in my database).

Note: There is a small miscellaneous category — things like fumbles on onside kicks, fumbles following blocked field goals, fumbles on laterals on the last play of the game, — that my brain begged itself to ignore.

{ 7 comments }

The definitive analysis of offensive fumbles

This post is intended to be more exhaustive than groundbreaking, more like an encyclopedia than a fiction novel. If you’re at this website, you’re probably into advanced statistics, and if you’re into advanced stats, you probably know that turnover rates are generally pretty inconsistent from time period to time period. But I wanted to get more granular than that, and to break down turnover rates into three specific components. The all-encompassing word ‘turnovers’ in itself is not helpful, because there are three types of turnovers:

— Interceptions
— Offensive fumbles
— Special teams/defensive fumbles

The word turnovers makes sense from an explanatory standpoint. If a team has three turnovers, it doesn’t matter all that much how they occurred. An interception returned for a touchdown is the same as a fumble returned for a touchdown. But when it comes to analyzing turnovers from a predictive standpoint, the word itself only serves to confuse. I’m going to put interceptions to the side for now — I wrote about them last Monday — and today focus on offensive fumbles.

The six types of offensive fumbles

We’ve known for awhile that fumbles are pretty random for year to year, particularly on the defensive side of the ball (see this article by Jim Armstrong showing that forcing fumbles was almost entirely a function of luck and not skill). Even the word “fumbles” is too broad from a predictive standpoint, as there are many different types of fumbles. On offense alone, I grouped all fumbles from 2000 to 2011 into one of six types:

— Quarterback/center exchange fumbles

— Quarterback sack fumbles

— Quarterback fumbles on running plays

— Quarterback fumbles on non-sack plays behind the line of scrimmage (this could be on bad handoffs, simply dropping the ball, etc.)

— Fumbles on running plays (non-QB)

— Fumbles following completed passes

In addition, there are four possibilities following a fumble. The ball could harmless go out of bounds [1]Technically, it could go harmfully go out of bounds, too. There were a few examples where the ball went out of bounds for a safety, or a team driving for a touchdown fumbled out of the other … Continue reading, it could be recovered by the fumbler, it could be recovered by one of the other ten players on offense, or it could be recovered by the defense. And as you might expect, the recovery rates are different depending on the type of fumble. I’ve done all the heavy lifting for you. The graph below shows the recovery rates associated with each of the six different types of offensive fumbles. The stacked columns are color coded: yellow represents fumbles that go out of bounds, blue is for fumbles recovered by the fumbler (“RBF”), blue is for plays where a different offensive player recovered, and red shows when the defense gained possession.

I like to see things in graphs, but for the more numbers-oriented folks out there:

CategoryNumber%ofOffFumOut of BoundsRec by FumblerRec by OffRec by DefDef rec of FIP
Aborted Snaps136718.2%2.6%43.2%29.8%24.4%44.9%
QB Sacks244032.5%2.3%13.8%33.2%50.8%60.5%
QB Running plays2623.5%12.6%27.1%14.9%45.4%75.3%
QB Negative runs1081.4%6.5%43.5%16.7%33.3%66.7%
Non-QB Runs174123.2%5.6%13.3%18.9%62.1%76.7%
Fumbles on Receptions158821.2%17.3%9.9%12.8%60.0%82.4%
Total7506100.0%6.7%19.1%24.1%50.1%67.6%

As an example, look at the second to last row which shows fumbles following completed pass plays. This tells us that 21% of all offensive fumbles come on these types of plays. A good chunk of them go out of bounds (17%), and one in ten are recovered by the fumbler. The far right column tells us that of the remaining fumbles that are recovered but not by the fumbler — Fumbles In Play — 82% of them are recovered by the defense.

Again, this isn’t meant to be “shocking” as it is to be informative. The goal here is to understand how fumbles generally operate to better understand how likely specific events are to be predictive. A receiver fumbling downfield who then has a teammate recover the fumble is a lot luckier than a quarterback who fumbles the snap and then recovers it. To me, knowing exactly how much luckier is valuable information.

For example, there were 5 offensive fumbles in the Chargers-Chiefs game yesterday. We can analyze them using the above info:

  • In the first quarter, Jamaal Charles fumbled on a run, and San Diego’s Shaun Phillips recovered. So San Diego recovered 1.0 fumbles, instead of the 0.60 fumbles usually recovered by the defense on a rushing play.
  • Early in the second quarter, Phillips sacked Matt Cassel, but Cassel recovered. The quarterback only recovers the fumble on 14% of sacks, so this was atypical of most fumbles. The defense recovers the fumble 51% of the time, and San Diego recovered 0.0 fumbles instead of the expected 0.51 fumbles.
  • On Kansas City’s next drive, Charles fumbled again on a run, and Corey Liuget recovered. Again, San Diego gets credit for 1.0 fumbles instead of the expected 0.60 fumbles. On these three Kansas City fumbles, San Diego recovered 2.0 fumbles when we would expect them to recover 1.71 fumbles in these situations. So we could argue that they were lucky to recover an extra 0.29 fumbles.
  • On the next play, Philip Rivers had an aborted snap and fumbled out of bounds (assuming the game book is accurate) — a very rare play (2.6% of the time). But in general, we would expect San Diego to retain possession on 76% of aborted snaps, so they are +0.24 fumbles on this play, and +0.53 on the day.
  • The last fumble came in the fourth quarter, when Shaun Draughn fumbled and Atari Bigby of the Chargers recovered. Again, this is another +0.40 fumble situation for the Chargers.

In total, San Diego recovered four of the five offensive fumbles on the day, and that represents 0.93 more fumbles than we would expect. That’s an example of how I envision people using the above table.

References

References
1 Technically, it could go harmfully go out of bounds, too. There were a few examples where the ball went out of bounds for a safety, or a team driving for a touchdown fumbled out of the other team’s end zone for a touchback.
{ 16 comments }