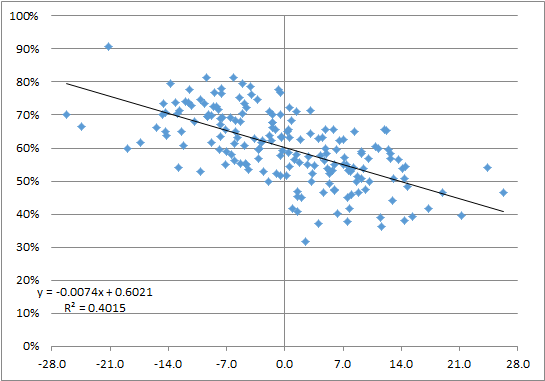
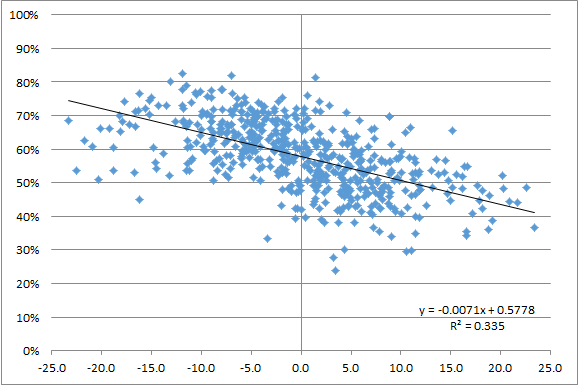
The graph below shows all 512 team games played in the 2018 season. On the X-Axis is the Game Script; on the Y-Axis is the percentage of plays that were passing plays for that team. As you can see, there’s a pretty clear correlation between Game Script — which is the average points differential over the course of the game — and Pass Ratio. The higher the Game Script, the lower the Pass Ratio:

Here is the best-fit linear formula to estimate a team’s Pass Ratio in 2018, assuming you know the Game Script:
58.76% minus 0.71 * Game Script
In other words, for about every 4 points of Game Script, you would expect a team’s Pass Ratio to decline by nearly 3 percent. A team with a Game Script of +8.0 would be expected to pass on 53.1% of plays, while a team with a -8.0 Game Script would be expected to pass on 64.4% of plays.
Once we know how often a team is expected to pass, we can then figure out which games were the biggest outliers. As it turns out, the Pittsburgh Steelers — playing the season without Le’Veon Bell — had the three most pass-happy games of the season. Playing the Broncos on November 25th, Pittsburgh had a Game Script of -1.5, so we would expect the Steelers to pass on 59.8% of all plays; instead, Pittsburgh threw on a whopping 78.9% of plays. That was the most pass-heavy game of the season once you account for Game Script.
The table below shows the Game Script, expected Pass Ratio, Actual Pass Ratio, and the difference between those two figures for all 512 team games in 2018. [continue reading…]


