≡ Menu

Was Smith's fast finish a sign of things to come?

Was Smith's fast finish a sign of things to come?

In Geno Smith’s first 12 NFL starts, he completed 179 of 327 passes (54.7%) for 2,256 yards, with 8 touchdowns and 19 interceptions. Those numbers translate to a 6.9 yards per attempt average, quite respectable for a rookie, and a 4.8 Adjusted Yards per Attempt average, abysmal for anybody. But over the last four weeks of the year, Smith went 68/116 (58.6%) for 790 yards with 4 touchdowns and 2 interceptions. His yards per attempt actually went down slightly to 6.8, but he averaged 6.7 AY/A, much closer to league average. Touchdowns and interceptions are less sticky statistics than yards per attempt, but Jets fans looking for reasons for optimism would cling to the massive flip in touchdown-to-interception ratio over the final quarter of the season.

The real question is whether any of that matters. In general, I’m a Splits Happen type of analyst, but I thought I would run some numbers. As it turns out, perhaps there is some reason to think Smith’s strong December (subject to the caveats below) is a sign of good things to come.  Here’s what I did:

From 1990 to 2013, there were 51 quarterbacks who threw at least 224 passes during their rookie season. Toss out the 2013 rookies (EJ Manuel, Smith, and Mike Glennon), along with the nine quarterbacks who threw fewer than 100 passes in year two (Jimmy Clausen, Ryan Leaf, Kyle Orton, Chad Hutchinson, Andrew Walter, Bruce Gradkowski, Chris Weinke, Ken Dorsey, and Matt Stafford), and that leaves us with 39 quarterbacks who threw at least 224 passes as a rookie since 1990 and then at least 100 passes in their second season. For those quarterbacks, I calculated their Y/A and AY/A averages over their final 4 games of the season, and their Y/A and AY/A averages over the first 1-12 games of the season (with the 224 pass attempts minimum, I felt pretty confident that we would have a large enough sample on the “early” portion of the season).  Then I looked at how those 39 quarterbacks fared in their second years.

The table below shows all 39 quarterbacks, plus the 2013 rookies.  Here’s how to read the table below.  Heath Shuler, a rookie for Washington in 1994, had 150 “early” season attempts, defined as all pass attempts before the final 4 games of the season.  His early year Y/A average was 5.0 and his AY/A average was 2.8.  Shuler had 115 “late” season attempts, defined as pass attempts in the final four games.  His Y/A in the late part of the season was 7.9, and his AY/A was 7.8.  As a result, Shuler improved his Y/A by 3.0 and his AY/A by 5.0 over the final four games of the season.  In Year N+1 — i.e., 1995 for Shuler — he had 125 pass attempts, and averaged 6.0 Y/A and 3.9 AY/A. [continue reading…]

{ 10 comments }

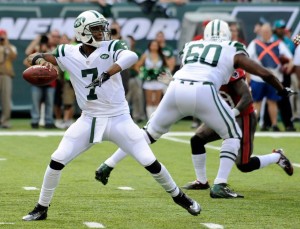
Smith against the Bucs

Smith looks to go deep against the Bucs.

We were very spoiled last year. Andrew Luck, Robert Griffin III, and Russell Wilson had outstanding rookie seasons in 2012, and perhaps that set expectations a bit high for the 2013 class. No one will confuse those three with EJ Manuel, Geno Smith, and Mike Glennon, all of whom struggled for most of their rookie seasons. But while Smith and Glennon didn’t produce excellent numbers, they produced very interesting ones.

Among the 35 quarterbacks with the most pass attempts, Glennon finished a very pedestrian 27th in Adjusted Net Yards per Attempt. But he did it in a very unique way: Glennon had an outstanding 19/9 touchdown-to-interception ratio, but he ranked dead last in Net Yards per Attempt. One reason for that is Glennon averaged only 10.6 yards per completion, the 3rd worst average among the 35 passers.

Smith finished 34th in ANY/A, largely due to his horrific 12/21 TD/INT ratio. He was a bit better in NY/A, ranking 28th, but what’s interesting about the Jets quarterback is that he ranked 7th in yards per completion. That metric is not a particularly effective measure of passer quality — after all, Matt Ryan ranked 35th — but it is a pretty good way to describe a quarterback’s style. While both Glennon and Smith were below average, they were below average in very different ways. [continue reading…]

{ 10 comments }

Instant Analysis: Jets top Tampa Bay in week 1

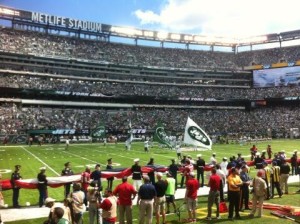
Jets BucsThirteen months ago, Tampa Bay head coach Greg Schiano said that he didn’t ever want to be the least penalized team in the league. I don’t think Sunday’s game was exactly what Schiano had in mind.

The Jets and Bucs battled in one of the closest games on Sunday, if not necessarily one of the most well-played ones. I was at the game, rooting on the home team, and can file this game under “all’s well that ends well.” While there are many takeaways from the game, the Bucs’ discipline problems will dominate discussion in Tampa Bay this week.

The Buccaneers looked unprepared at the start of the game and sloppy throughout. The Bucs were having some problems with Josh Freeman’s headset, which might explain why the team had to call timeout after an incomplete pass on the fourth snap of the game. But Tampa Bay followed that timeout with a delay of game (how?), which was followed by another delay of game (how??). That was followed by a sack, a false start, and then another false start.

The discipline problems continued throughout the game. Freeman wasn’t prepared for a Jeremy Zuttah snap, which resulted in a safety (and another penalty when Freeman kicked the ball out of the end zone). New Buc Dashon Goldson committed a brutal personal foul on Jets tight end Jeff Cumberland on one drive; on the next, the other safety, Mark Barron, was flagged for unnecessary roughness on an eight-yard pass to Jeremy Kerley on 3rd-and-21. That gave the Jets a first down, and let to New York’s only offensive touchdown of the game, a seven-yard throw from Geno Smith to ex-Buc Kellen Winslow.

Leading 14-12 in the fourth quarter, the Jets had 3rd-and-6 from their own 27. Smith couldn’t find anyone and ran out of bounds, but a defensive holding kept the drive alive (which led to a field goal). But despite all the penalties, Tampa Bay still managed to gain the lead in the game’s final minute. With 15 seconds remaining, the Jets had the ball at their own 45, a good 15-20 yards away from field goal range. Geno Smith scrambled and ran out of bounds with seven seconds left, placing the Jets at the Tampa Bay 45-yard line. But after the play, second-year linebacker Lavonte David was flagged for a personal foul, putting the Jets in field goal range. Nick Folk connected from 48 yards out, and David’s blunder is up there with Dwayne Rudd‘s helmet toss as the most costly penalties of the last 15 years.
[continue reading…]

{ 10 comments }

Projecting the 2013 Jets

Let’s start with a picture showing just how ugly the Jets passing game has been over the last four years. The chart below displays where New York has ranked in Net Yards per Attempt, Adjusted Net Yards per Attempt, passer rating, Football Outsiders DVOA, and ANS’s Pass EPA/Play in each season starting in 2009. The black line shows an average of the team’s ranks in those five metrics. On the left, is the team’s rank from 1 to 32.

Jets passing

There are a few things that should be pretty obvious: all data points reside in the bottom half of the picture. New York ranked 18th in passer rating in 2011, its highest ranking in any of the five passing measures over the last four years. The Jets passing game was bad last year and looks to be bad this year, but we’re only talking about measures of degrees. The 11-5 Jets in 2010 ranked 20th in ANY/A and made it to the AFC Championship Game. In Mark Sanchez’s rookie year, the Jets ranked 27th in ANY/A and were leading the Colts at halftime of the AFCCG in Indianapolis.

One interpretation is that Sanchez was steadily improving, as he made gains in most metrics in both 2010 and 2011. I don’t think that’s the correct interpretation, however. Yes, the Jets ranked 18th in passer rating and in the top 20 other three other categories, but the real story is that New York only finished 25th in NY/A. The discrepancy between the statistics is the result of a fluke season with respect to passing touchdowns, which are ignored in NY/A but a part of passer rating, ANY/A, DVOA, and EPA. The Jets ranked 2nd in red zone scoring percentage in 2011, but ranked 17th (2009), 28th (2010), and 25th (2012) in that metric the other three years. Sanchez threw 14 touchdowns from inside the ten-yard line that year, more than double his performance in any other season. Some credited his red zone performance in 2011 to offensive guru Tom Moore’s tenure with the team that year, others believed it was due to the addition of Plaxico Burress, while still more thought it was a sign of Sanchez’ improvement as a passer. In retrospect, I think we can chalk most of that up red zone success up to good old fashioned luck and small sample size.
[continue reading…]

{ 3 comments }

Smith throws a pass in between checking twitter.

Smith throws a pass in between refreshing Twitter.

As Jason Lisk has pointed out, quarterbacks drafted first overall tend to be much more successful than other quarterbacks, even those drafted just a few picks later. If a quarterback is an elite prospect — think John Elway or Peyton Manning or Andrew Luck (the Colts got three of those for one Jeff George) — he’ll go first overall, while lesser-skilled quarterbacks might get “overdrafted” because of the position they play. There are counter-examples, of course — think Matt Ryan and Joe Flacco in 2008 — but I agree with Jason on the general theory.

One could argue that if you group together all quarterbacks drafted in the first three rounds (after removing the top five or ten picks), you won’t find any significant relationship between draft slot and performance. That’s not where this post is going, though. Instead I’ll take a narrower view and note that Geno Smith became the 44th quarterback drafted in the second half of the first round or the first half of the second round since 1978. Those cut-offs should give us a good look at quarterbacks ignored by teams picking in the top half of the first round but quarterbacks who were otherwise good enough to be drafted relatively early. This analysis generally applies to EJ Manuel, too, although he technically misses the cut-off as the 16th pick of the first round. Once we leave out the quarterbacks drafted since 2009 — Brandon Weeden, Andy Dalton, Colin Kaepernick, Tim Tebow, Jimmy Clausen, Josh Freeman, and Pat White — we’re left with 36 quarterbacks.

The table below shows each of those quarterbacks, along with the year they were drafted, the round, the overall pick, and the team that selected them. How did they turn out? I’ve included their number of seasons starting, number of games and games started, career passing yards and passing touchdowns, and also their number of Super Bowl wins, Super Bowl appearances, and Pro Bowls. The final row shows the median for each category (and for the last three columns, the average). Obviously this will shortchange some of the active quarterbacks, but you get the general idea.
[continue reading…]

{ 2 comments }

Will Geno Smith fall in the draft?

Would you risk your job on this man?

Would you risk your job on this man?

I have no inside information and I’m not a draftnik, but that won’t stop me from trying to read the tea leaves. I’m of the opinion that Geno Smith will fall to the late first round of the draft next week. I’m not a huge Smith fan — a passer-friendly system boosted his admittedly impressive numbers — but I wouldn’t label myself a Smith hater, either. So why do I think he’ll slide? Part of the reason is that Smith simply isn’t a slam dunk pick, much to the chagrin of several teams in the top five. Another factor is that following the delusional quarterback carousel last month, no team has a pressing need for a quarterback to start in week 1, a stark contrast to where the Redskins and Colts were this time last year. Finally, while Smith may be the top quarterback prospect on most boards, I’m sure some teams think selecting Matt Barkley, E.J. Manuel, Ryan Nassib, Tyler Wilson, Mike Glennon, Tyler Bray, or Landry Jones in rounds two, three, or four, is preferable to spending a high first round pick on Smith. If those picks miss, the cost is lower, and team won’t feel the immediate need to thrust them into the lineup like they would with Smith.

Looking at the teams drafting in the top ten, and I don’t see any landing spot that is particularly likely for Smith. Consider:
[continue reading…]

{ 7 comments }

Quarterbacks wearing #12 have won 14 Super Bowls

Quarterbacks wearing #12 have won 14 Super Bowls.

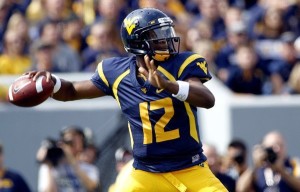
What does it mean that Geno Smith comes from a long line of Mike Leach/Dana Holgorsen star quarterbacks? I don’t know. At a minimum, it means he’s part of a very interesting and distinguished set of college quarterbacks. Because few players have dominated college football over the last 15 years like quarterbacks under Mike Leach and Dana Holgorsen.

Leach is one of the most fascinating characters in recent college football history, and he’s been one of the most influential coaches in the modern passing game. That’s what tends to happen when your quarterbacks produce video game numbers practically every season. Leach was the offensive coordinator under Hal Mumme at Kentucky in 1997 and 1998, which is when the Air Raid offense arrived on the national radar. At the time, there hadn’t been any Wildcats drafted in the first round since running back George Adams in 1985. Twenty-six months after Leach and Mumme arrived in Lexington, Tim Couch was the first pick in the NFL draft.

Leach then spent a year as the offensive coordinator for the Oklahoma Sooners with Josh Heupel at quarterback. Heupel led the conference with 3,460 passing yards and 30 touchdowns, and also sported the highest completion percentage (62.0%) in the conference. Those were big numbers in a conference where only four players threw for even 1900 yards, and was enough to land Leach the head coaching job at Texas Tech after only a season in Norman. When Leach moved to Lubbock, Texas in 2000, the quarterback cupboard appeared bare. He took unheralded sophomore quarterback Kliff Kingsbury and shaped him into the player that led the NCAA in pass attempts in 2000, 2001, and 2002. Klingsbury led the Big 12 in passing yards in both 2000 and 2001, and then as a senior, became just the third player in college football history to pass for 5,000 yards in a season (after Ty Detmer and David Klingler). Klingsbury went on to have an unremarkable career in the NFL before excelling as an assistant coach with the Houston Cougars. He followed then-head coach Mike Sumlin to Texas A&M after the 2011 season, and after turning Johnny Manziel into a Heisman Trophy winner, Kingsbury is now the new head coach at his alma mater.
[continue reading…]

{ 4 comments }

The Chiefs play the Baylor game on an endless loop for the other 31 teams.

The Chiefs play the Baylor game on an endless loop for the other 31 teams.

A few weeks ago, I discovered cfbstats.com, which has made available for download an incredible amount of college football statistics from the last eight seasons. Thanks to them, I plan to apply some of the same techniques I’ve used on NFL numbers over the years to college statistics. If you’re a fan of college football, you’re probably already reading talented writers like Bill Connelly and Brian Fremeau, but hopefully I can bring something new to the table for you to enjoy.

There are many differences between college and professional football, but many of the same stats still matter. For quarterbacks, Adjusted Net Yards per Attempt is still the king of the basic stats [1]For the uninitiated, ANY/A is calculated by starting with passing yards per attempt, adding 20 yards for each touchdown and subtracting 45 yards for each interception, and subtracting sack yards lost … Continue reading, and it is arguably even more important in college where teams play at varying different paces.

There’s a small problem, however, if you want to calculate ANY/A at the college level: the NCAA counts sacks as rush attempts and sack yards lost as negative rushing yards. I manually overrode [2]Unfortunately, some estimation was involved. The player game logs at cfbstats do not identify quarterback sacks, but the team game logs do. So for each quarterback, we know how many passes he threw … Continue reading that decision in my data set, so going forward, all rushing and passing data will include sack data in the preferred manner (keep this in mind when you compare the statistics I present to the “official” ones).
[continue reading…]

References

References
1 For the uninitiated, ANY/A is calculated by starting with passing yards per attempt, adding 20 yards for each touchdown and subtracting 45 yards for each interception, and subtracting sack yards lost from the numerator and adding sacks to the denominator.
2 Unfortunately, some estimation was involved. The player game logs at cfbstats do not identify quarterback sacks, but the team game logs do. So for each quarterback, we know how many passes he threw in the game and how many times his team was sacked. For quarterbacks who threw 100% of their team’s passes in a game, this is easy. However, for quarterbacks who threw fewer than 100% of their team’s passes, they were assigned a pro-rata number of their team’s sacks.
{ 10 comments }