≡ Menu

Guest Post: Adam Steele on Quarterback MVP Shares

Adam Steele is back for another guest post. You can view all of Adam’s posts here. As always, we thank him for contributing.


In this post, I will attempt to estimate how many MVP awards each QB has “deserved” over the course of his career. I wanted to accomplish this task using very basic statistics, so the only inputs are pass attempts, passing yards, and TD passes. I can’t stress enough that this is aimed at providing rough estimates and not definitive answers.

Methodology

The metric I will use for this study is my own creation, Positive Yards Per Attempt (PY/A). I chose this over ANY/A for several reasons:

  • It is available back to the early days of the NFL, whereas ANY/A only goes back to 1969; I prefer to employ a uniform measurement for players of every era.
  • Sacks (invalid) and interceptions (unstable and invalid) are poor measures of QB performance, while Y/A and TD% are both statistically valid. (Proof)
  • If I used ANY/A, a number of unworthy seasons would appear MVP caliber due to fluky INT rates (looking at you, Damon Huard).
  • MVP voters typically focus on yards, TD passes, and wins (shame on them), but largely ignore interceptions and sacks.

With my justifications out of the way, let’s get to the actual formula:

  1. PY/A = (Passing Yards + TD Passes *20) / Attempts.
  2. Each QB season is compared to league average, giving us Relative PY/A (RPY/A). At this juncture, all seasons below +1 RPY/A are discarded, as I consider that the minimum baseline for a great season.
  3. I don’t want anyone receiving MVP Shares for lighting it in limited action (Todd Collins in 2007, for example), so I added a minimum threshold for attempts in a season. From 1978-present, the minimum is 300 attempts, and from 1950-1977 the minimum is 200 attempts. I purposely did not prorate 1982 and 1987 because I don’t think MVP awards in shortened seasons should be worth as much as full seasons.
  4. I excluded the AFL and AAFC because those leagues had watered down competition, and also because I’m lazy. Seasons before 1950 are excluded for the same reasons.
  5. I want to emphasize QB’s who play all or most of a season, which is accomplished by subtracting the minimum baseline from each QB’s attempts in a season. For example, a modern QB who attempts 525 passes in a given year will have his attempts adjusted down to 225 (525-300). This ensures that a QB who plays excellently over 2/3 of a season doesn’t get too much credit, but still gets some (such as Kurt Warner in 2000).
  6. RPY/A is multiplied by adjusted pass attempts to calculate MVP Value.
  7. League MVP Value is summed in each season, and each quarterback’s MVP Value is divided by the league total. This is his MVP Share. The divisor is capped at 500 and floored at 200, which results in some seasons producing more or less than one MVP Share. This last modifier was necessary due to vast discrepancies in yearly MVP Value totals, as I don’t want historically great seasons penalized too much for occurring within a loaded field (such as 2011 or 1976). The 68 seasons from 1950-2017 produced a grand total of 60.2 MVP Shares, which feels quite reasonable (we can pretend the other 7.8 MVP awards went to non-quarterbacks).

Here are the top 100 MVP Share seasons since 1950:

QuarterbackYearTeamAttYardsTDPY/ALgPY/ARPY/AMVPValMVPShare
Steve Young1994SFO46139693510.137.542.59256.01.00
Dan Marino1984MIA56450844810.727.972.75462.00.92
Steve Young1993SFO4624023299.967.402.56252.70.90
Peyton Manning2004IND49745574911.147.943.20433.40.87
Matt Ryan2016ATL53449443810.688.012.67390.80.85
Aaron Rodgers2011GNB50246434511.048.052.99402.00.80
Kurt Warner2001STL54648303610.167.542.62398.50.80
Boomer Esiason1988CIN38835722810.657.702.95171.60.77
Lynn Dickey1983GNB48444583210.538.042.49274.20.76
Y.A. Tittle1963NYG36731453610.538.621.9161.00.31
Tom Brady2007NWE57848065010.047.692.35375.30.75
Earl Morrall1968BAL31729092610.828.032.7930.40.11
Joe Namath1972NYJ3242816199.867.692.1728.10.14
Kurt Warner1999STL49943534110.377.542.83364.20.73
Peyton Manning2013DEN6595477559.988.001.98351.80.70
Brett Favre1995GNB5704413389.087.561.52140.40.70
Johnny Unitas1964BAL30528241910.508.182.326.60.03
Fran Tarkenton1967NYG3773088299.737.911.8263.10.30
Sonny Jurgensen1961PHI41637233210.498.571.92106.70.35
Steve Young1992SFO4023465259.867.632.23125.50.63
Philip Rivers2008SDG4784009349.817.722.09194.00.59
Ken Anderson1975CIN3773169219.527.522.0077.00.25
Bert Jones1976BAL34331042410.457.443.0186.40.17
Craig Morton1969DAL30226192110.067.962.102.20.01
Norm Van Brocklin1954RAM26026371311.148.292.85-74.0-0.37
Dan Fouts1985SDG4303638279.727.861.86111.80.56
Daunte Culpepper2004MIN54847173910.037.942.09270.30.54
Carson Palmer2015ARI53746713510.008.171.83196.70.54
Roger Staubach1973DAL28624282310.107.422.68-23.5-0.09
Ken Stabler1976OAK29127372711.267.443.82-25.4-0.05
Tom Brady2011NWE6115235399.848.051.79245.70.49
Drew Brees2011NOR6575476469.748.051.69246.30.49
Jim Kelly1991BUF4743844339.507.611.89154.90.49
Philip Rivers2010SDG5414710309.827.871.95229.00.48
Joe Montana1989SFO38635212610.477.952.52130.70.48
Boomer Esiason1986CIN4693959249.467.781.68114.90.47
Aaron Rodgers2014GNB5204381389.898.101.79173.80.47
Mark Rypien1991WAS4213564289.807.612.19144.00.45
Drew Brees2009NOR5144388349.867.812.05224.70.45
Peyton Manning2005IND4533747289.517.561.95145.40.45
Warren Moon1990HOU5844689339.167.841.3290.90.45
Terry Bradshaw1977PIT3142523179.127.281.8411.80.05
Johnny Unitas1965BAL28225302310.608.532.07-19.3-0.10
Vinny Testaverde1996BAL5494177338.817.461.3587.20.44
John Brodie1970SFO3782941249.057.561.4938.20.19
Brett Favre1997GNB5133867358.907.461.4493.70.43
Norm Van Brocklin1960PHI28424712410.398.242.15-18.4-0.08
Daunte Culpepper2000MIN4743937339.707.522.18205.30.41
Philip Rivers2009SDG4864254289.917.812.10204.60.41
Randall Cunningham1998MIN42537043410.327.692.63203.80.41
Jim Everett1989RAM5184310299.447.951.49106.80.39
Ken Stabler1974OAK3102469269.647.242.4014.00.03
Peyton Manning2012DEN5834659379.267.921.3496.20.38
Trent Green2002KAN4703690268.967.511.4576.50.38
Peyton Manning2006IND5574397319.017.641.3795.10.36
Tony Romo2014DAL43537053410.088.101.98132.30.36
Otto Graham1953CLE25827221111.407.473.93-123.1-0.26
Tony Romo2007DAL5204211369.487.691.79173.80.35
Milt Plum1960CLE25022972110.878.242.63-81.5-0.35
Drew Brees2008NOR6355069349.057.721.33110.60.34
Don Meredith1966DAL3442805249.557.811.7432.60.10
Johnny Unitas1957BAL30125502410.078.401.670.70.00
Y.A. Tittle1962NYG37532243310.368.981.3828.50.14
Steve Young1998SFO5174170369.467.691.77167.10.33
Dan Marino1986MIA6234746449.037.781.2580.80.33
Steve McNair2003TEN4003215249.247.421.8282.00.32
Terry Bradshaw1978PIT3682915289.447.501.9463.90.32
Ben Roethlisberger2009PIT5064328269.587.811.77158.60.32
Ken Anderson1974CIN3282667189.237.241.9927.70.07
Len Dawson1971KAN3012504159.327.531.790.80.00
Johnny Unitas1959BAL3672899329.648.291.3523.50.12
Greg Landry1971DET2612237169.807.532.27-49.5-0.19
Craig Morton1981DEN3763195219.617.851.7657.80.29
Norm Snead1967PHI4343399299.177.911.2634.80.16
Steve Young1997SFO3563029199.587.462.1262.70.29
Frank Ryan1966CLE3822974299.307.811.4940.20.13
Russell Wilson2015SEA4834024349.748.171.57104.30.28
Aaron Rodgers2012GNB5524295399.197.921.2768.00.27
Terry Bradshaw1979PIT4723724268.997.681.3153.30.27
Vince Ferragamo1980RAM4043199309.407.881.5254.10.27
Drew Brees2006NOR5544418268.917.641.2768.60.26
Steve Beuerlein1999CAR5714436369.037.541.49132.80.27
Norm Van Brocklin1950RAM23320611810.397.792.60-107.2-0.54
Jared Goff2017RAM4773804289.157.851.3053.10.27
Steve Grogan1979NWE4233286289.097.681.4150.40.25
Dan Fouts1978SDG3812999249.137.501.6351.00.26
Otto Graham1951CLE2652205179.607.841.76-26.6-0.13
Boomer Esiason1985CIN4313443279.247.861.3849.80.25
Roger Staubach1978DAL4133190258.937.501.4348.60.24
Bob Griese1977MIA3072252228.777.281.493.40.02
Kurt Warner2000STL34734292111.097.523.57120.80.24
Aaron Rodgers2009GNB5414434309.307.811.49118.10.24
Joe Ferguson1975BUF3212426259.127.521.6012.60.04
Fran Tarkenton1964MIN3062506229.638.181.452.70.01
Billy Wade1958RAM3412875189.498.161.3313.50.07
John Hadl1973RAM2582008229.497.422.07-44.9-0.17
Roger Staubach1979DAL4613586278.957.681.2743.50.22
Norm Van Brocklin1953RAM2862393199.707.472.23-17.2-0.04
Bobby Thomason1953PHI3042462219.487.472.014.00.01
Donovan McNabb2004PHI4693875319.587.941.64108.20.22

And now the MVP Share career list (the Seasons column represents the number of different seasons each QB received more than zero MVP Shares):

QuarterbackMVPShareSeasons
Peyton Manning3.5711
Steve Young3.156
Johnny Unitas2.146
Aaron Rodgers2.005
Drew Brees1.968
Tom Brady1.927
Brett Favre1.808
Kurt Warner1.794
Philip Rivers1.684
Boomer Esiason1.504
Norm Van Brocklin1.506
Dan Fouts1.446
Y.A. Tittle1.354
Ken Stabler1.305
Dan Marino1.293
Daunte Culpepper1.163
Terry Bradshaw1.165
Roger Staubach1.135
Tony Romo1.126
Ken Anderson1.105
Fran Tarkenton1.084
Craig Morton1.024
Carson Palmer0.864
Joe Montana0.853
Matt Ryan0.851
Lynn Dickey0.812
Joe Namath0.782
Jim Kelly0.773
Sonny Jurgensen0.762
Earl Morrall0.742
Trent Green0.744
Otto Graham0.734
Bob Griese0.715
Ben Roethlisberger0.645
John Brodie0.592
Bert Jones0.571
Jim Everett0.562
Vinny Testaverde0.542
Russell Wilson0.523
Don Meredith0.502
Greg Landry0.463
Mark Rypien0.451
Warren Moon0.451
Billy Wade0.432
Randall Cunningham0.411
Steve McNair0.382
Frank Ryan0.362
Milt Plum0.351
Donovan McNabb0.333
Steve Grogan0.313
Len Dawson0.301
Norm Snead0.291
John Hadl0.282
Steve Beuerlein0.282
Chris Chandler0.274
Vince Ferragamo0.271
Jared Goff0.261
Eli Manning0.252
Jeff George0.252
Bart Starr0.242
Joe Ferguson0.241
Bobby Layne0.233
Matt Schaub0.232
Bill Nelson0.222
Bobby Thomason0.221
Chad Pennington0.201
Alex Smith0.181
George Ratterman0.171
Jake Delhomme0.171
Tommy Kramer0.171
Matt Hasselbeck0.162
Bob Berry0.142
Jay Schroeder0.141
Joe Theismann0.141
Neil Lomax0.141
Andy Dalton0.131
Ken O'Brien0.121
Rudy Bukich0.121
Jeff Garcia0.111
Ron Jaworski0.111
Carson Wentz0.101
Charley Johnson0.101
Danny White0.091
Robert Griffin0.091
Steve Bartkowski0.091
Troy Aikman0.091
Mark Brunell0.081
Wade Wilson0.071
Chris Miller0.061
Elvis Grbac0.061
Matthew Stafford0.061
Michael Vick0.061
Mike Livingston0.061
Nick Foles0.061
Billy Kilmer0.052
Brian Griese0.052
Jim Harbaugh0.051
John Elway0.051
Adrian Burk0.041
Bobby Hebert0.041
Brad Johnson0.041
Dave Krieg0.042
Marc Bulger0.041
Richard Todd0.041
Bernie Kosar0.031
Jim Hart0.031
Tommy Maddox0.031
Bob Lee0.021
David Garrard0.011
Doug Flutie0.011
Steve Spurrier0.011
Jeff Hostetler0.001

I’ll leave the commentary up to you guys!

{ 37 comments }

Guest Post: The Patriots’ League-Best Kickoffs

Today’s guest post comes from Miles Wray, a long-time reader of the site. He’s written an interesting post on special teams today, but you may know him as the host of the daily NBA podcast The 82 Review. You can also find him on Twitter @mileswray. What follows are Miles’ words: as always, we thank our guest writers for their contributions.


Bill Belichick Found Another Way to Bleed Yards From Opponents

Gostkowski, probably not kicking a touchback

Anytime the New England Patriots are at the top — or the bottom — of a league-wide leaderboard, no matter how insignificant that leaderboard is, it’s worth taking notice. The odds are that Bill Belichick and Ernie Adams are thinking a few steps ahead of every other team in the league, and are leveraging yet another corner of the game to their advantage.

Since the Patriots offense remains incredibly explosive, it’s pretty reasonable that they would be near the top of the league in the total number of kickoffs returned (i.e., opponent kickoff returns). New England has 47 kickoffs this year, or nearly double the number of a struggling offense like the Cleveland Browns (26). But how about this: the Patriots are dramatically ahead of everybody else in the league in the percentage of their kickoffs that are returned.

Since kickoffs were moved from the 30- to the 35-yard-line in 2011, it’s more common than ever to see a kickoff boomed out the back of the endzone. These plays have become so routine it’s basically part of the commercial break now. But not for the Patriots. The Patriots seem to be inviting their opponent to return their kicks.

I went through the kickoff statistics for each team in the league, and discarded any onside kicks, any short kicks in the last 10 seconds of the first half (which are often intentionally squibbed), and any kicks where the just-scored/kicking-off team had been penalized, moving the kickoff to the 30-, 25-, or 20-yard line. The remaining “clean” kickoffs give the best indication of a team’s intentional special teams strategy over time.

This season, most teams have about a third of their kickoffs returned. Only three teams have had over half of their kickoffs returned; the Patriots are alone at over 60%: [continue reading…]

{ 16 comments }

Longtime commenter Jason Winter has chimed in with today’s guest post. Jason is a part-time video game journalist and full-time sports fan. You can follow him on twitter at @winterinformal.

As always, we thank Jason for contributing. Note that this was written before last night’s game.


If you’re making predictions as to who will win each division on the eve of this 2017 NFL season, you’ve probably got New England to once again win the AFC East. I mean, look at the rest of that division. Seriously.

As for the other seven divisions, how many teams do you have repeating as champions? Or, let me put it to you this way: Suppose I bet you that at least half of the divisions in the NFL – the AFC East included – will have new winners in 2017. So if there are four or more new division winners, I win; if there are fewer, you win. Would you take that bet?

If we’d done that bet every year since the NFL went to its current eight-division format, I’d have won 12 out of 14 times. So you definitely shouldn’t take that bet.

But sure, that gives me an advantage: You win if 0, 1, 2, or 3 divisions have new winners (four outcomes), and I win if 4, 5, 6, 7, or 8 do (five outcomes). So fine, I’ll give you an extra chance. I only win if more divisions (5+) have new winners in 2017, so you’ll win if exactly half (4) or fewer divisions have new champions. Now what chance do I have to win?

If we did this every year since 2003, I’d still be ahead in the money, with 9 out of 14 wins. Always bet on chaos.

[continue reading…]

{ 7 comments }

Guest Post: Passing Volume vs. Passing Efficiency

Today’s guest post comes from Ben Baldwin, a contributor for Field Gulls and Bryan’s site, http://thegridfe.com. You can find more of Ben’s work here or on Twitter @guga31bb. What follows are Ben’s words.


Arguing on the internet

A common argument on the internet (e.g. Twitter, where I spent too much time) is that the efficiency of players like Dak Prescott and Russell Wilson in their rookie seasons (and subsequent seasons, for Wilson) was not impressive because they were not asked to throw the ball as much. Once they are asked to throw more often, the argument goes, we can expect their efficiency to fall off. Here is one of many, many examples:

Do quarterbacks really look good because they throw less? [continue reading…]

{ 17 comments }

Today’s guest post comes from hscer, a frequent commenter here at Football Perspective. Hscer is starting a project on his website, MVPQB.Blogspot.com, where he is working on his most valuable quarterback for each season since 1951. Here’s a sample chapter today: as always, we thank our guest posters for their contributions.


 “When .500 is a Miracle” – The Giants trade a number of picks for Fran Tarkenton and immediately go from a one-win team to a .500 club.

The Stats

Unitas (AP1): 255-436 (58.5%) 3428 yards (7.86 y/a) 20 TD 16 INT, 83.6 rating, 7.13 AY/A, 11-1-2 record in starts (4 4QC, 3 GWD). Rushing: 89 yards on 22 attempts (4.0 avg.), 0 TD, 4 fumbles.

Tarkenton (MVQB): 204-377 (54.1%) 3088 yards (8.19 y/a) 29 TD 19 INT, 85.9 rating, 7.46 AY/A, 7-7 record in starts (2 4QC, 2 GWD). Rushing: 306 yards on 44 attempts (7.0 avg.), 2 TD, 4 fumbles.

The Argument

For older selections, I’ve often deferred to the AP when they pass over a quarterback on a weaker team to give their All-Pro nod to an established star on a great squad. I won’t do that here.

The 1966 Giants went 1-12-1. Much of that was due to a putrid defense which allowed 501 points, many of them in an infamous 72-41 loss to the Redskins. But the offense could not be absolved from blame. Gary Wood, Earl Morrall, and Tom Kennedy split time at quarterback, and no rusher exceeded 327 yards. As a result, New York was 12th in the 15-team NFL with 263 points scored, and 8th in yards. Just two seasons later, Morrall would be putting up Unitas-like numbers on Unitas’ own team.

In ’66, New York’s top 5 pass receivers were Homer Jones, Joe Morrison, Aaron Thomas, Chuck Mercein, and Bobby Crespino. In ’67, they were Thomas, Jones, Morrison, Ernie Koy, and Tucker Frederickson, the last two of which were also on the ’66 squad. Four starting offensive linemen returned, and the only new one was 1966 eighth-round pick RT Charlie Harper. [continue reading…]

{ 9 comments }

Today’s guest post comes from hscer, a frequent commenter here at Football Perspective. Hscer is starting a project on his website, MVPQB.Blogspot.com, where he is working on his most valuable quarterback for each season since 1951. Here’s a sample chapter today: as always, we thank our guest posters for their contributions.


“Say What?” – Was Ken O’Brien really better than Dan Marino at any point in time? For one season, he at least had an argument.

The Stats

Marino (AP1): 336-567 (59.3%) 4137 yards (7.30 y/a) 30 TD 21 INT, 84.1 rating, sacked 18-157, 6.21 ANY/A, 12-4 record in starts (4 4QB, 6 GWD). Rushing: -24 yards on 26 attempts (-0.9 avg.), 0 TD, 9 fumbles.

O’Brien (MVQB): 297-488 (60.9%) 3888 yards (7.97 y/a) 25 TD 8 INT, 96.2 rating, sacked 62-399, 6.60 ANY/A, 11-5 record in starts (1 4QC, 1 GWD). Rushing: 58 yards on 25 attempts (2.3 avg., 0 TD, 14 fumbles.

The Argument

Yes, really. Even though Ken O’Brien took far too many sacks in ’85—62 to be exact, losing 399 yards—when he got the ball off, he was better than Marino. Even when he didn’t, his passing edge was large enough to secure a higher ANY/A than The Man in Miami. Dan Fouts was another reasonable selection despite missing four games by throwing for 3638 yards and 27 TD with a league-leading 7.02 ANY/A in the games he did play, but this year comes down to Marino and O’Brien.

Dan Marino was coming off of the greatest season an NFL quarterback has ever enjoyed in 1984, still the best ever in my opinion. This likely helped his cause. It didn’t help O’Brien’s cause that he had one of the ugliest season debuts you can imagine. In a 31-0 loss to the Raiders, he was 16-29 for 192 yards, 0 TD, 2 interceptions, and sacked a whopping 10 times for -61 yards, producing an adjusted net yards per attempt of 1.05. In the final 15 games, his ANY/A was 7.14, but the first game counts all the same. [continue reading…]

{ 17 comments }

Today’s guest post comes from hscer, a frequent commenter here at Football Perspective. Hscer is starting a project on his website, MVPQB.Blogspot.com, where he is working on his most valuable quarterback for each season since 1951. Here’s a sample chapter today: as always, we thank our guest posters for their contributions.


“When Fifth is First” – Maybe fifth is unkind to Gannon’s 2000 season, but he certainly wasn’t the best or even top three.

The Stats

Let’s begin with a look at the stats from six of the top quarterbacks from 2000: Rich Gannon, Peyton Manning, Daunte Culpepper, Kurt Warner, Jeff Garcia, and Brian Griese.

QuarterbackCmp-Att-(%)-YdY/ATDINTPassRtSk-SkYdANY/AW-L4Q/GWRshYd-Rsh-YPC-TDFumDYARDVOA
Gannon (AP1)284-473-(60.0%)-34307.25281192.428-1246.7312-43/4529-89-5.9-49105221.4
Manning (MVQB)357-571-(62.5%)-44137.73331594.720-1317.2210-62/3116-37-3.1-15188838.3
Culpepper297-474-(62.7%)-39378.3133169834-1817.2811-53/4470-89-5.3-711135230.1
Warner235-347-(67.7%)-34299.88211898.320-1157.978-31/217-18-0.9-0492328.0
Garcia355-561-(63.3%)-42787.63311097.624-1557.346-100/0414-72-5.8-47164231.8
Griese216-336-(64.3%)-26888194102.917-1397.797-30/1102-29-3.5-15106234.7

The Argument

Gannon’s win here is baffling when you look at the stats in this context: he ranks 5th in DYAR, and 6th in Y/A, ANY/A, Passer Rating, and DVOA. So why did the Associated Press, along with Pro Football Weekly / Pro Football Writers of America and The Sporting News select Gannon as their first-team All-Pro quarterback?

Well, four teams went 12-4 or better, including Gannon’s Raiders. The other three teams had Kerry Collins, Steve McNair, and the
Tony BanksTrent Dilfer combo at quarterback, and Gannon had the best numbers of that group. But even for media types, it usually takes a little more than wins to clinch these awards. McNair, with 2847 yards and 15 TD on the 13-3 defending AFC Champion Titans, was likely not considered by anyone. [continue reading…]

{ 30 comments }

Today’s guest post/contest comes from Thomas McDermott, a licensed land surveyor in the State of California, a music theory instructor at Loyola Marymount University, and an NFL history enthusiast. As always, we thank him for his hard work. You can view all of his work at Football Perspective here.


If you can get five people in a room to agree on what a sports dynasty is, you’ll probably have achieved the most miraculous agreement in history since the Congress of Vienna. We know a sports dynasty when we see one (the current Patriots, the New York Yankees, 1990s Bulls, etc.), but it becomes less clear once we attempt to actually define it:,When does the dynasty start? How long must it last? What are the requirements?

In this article on NFL dynasties, FiveThirtyEight does a nice job of negotiating the quagmire by just listing the “best team over any number of years”. [1]Their definition of “best” being their ELO ratings. I’m going to do the same thing here, but focusing solely on NFL defenses since the merger (regular season only). The metric is points allowed by the defense (meaning: fumble, interception, kick and punt return touchdowns, and safeties aren’t included), adjusted for era and strength of schedule (basically, SRS ratings). Regular readers may recall that I published these results back in August 2015. To differentiate this stat from Pro-Football-Reference’s DSRS, I’ll call it “DfSRS”.

Below is a table of defensive dynasties, ranging from 1 to 15 years: [continue reading…]

References

References
1 Their definition of “best” being their ELO ratings.
{ 15 comments }

Longtime commenter Jason Winter has chimed in with today’s guest post. Jason is a part-time video game journalist and full-time sports fan. You can follow him on twitter at @winterinformal.

As always, we thank Jason for contributing.


Two years ago, I started a little experiment. I saw that many NFL prognosticators were posting mock drafts for 2016 just a few days after the 2015 draft concluded. I found as many as I could and, when the 2016 draft rolled around, rated all of them on their predictive prowess.  Regular readers may recall that last year’s article was posted here at Football Perspective.

I did the same for the 2017 draft, recording the same people’s drafts – along with a couple others – right after the 2016 draft, so it’s time to see how they did this year. Were the same people good (or bad) at predicting the draft a year out? Or was it an exercise in guesswork and randomness?

This year, I had 12 different sources to draw from – the same 10 from last year, along with a pair of new entries: Steve Palazzolo from Pro Football Focus and Todd McShay from ESPN. To recap my scoring methods:

I applied two different scoring systems to each mock draft. The first, which I call the “Strict” method, better rewards exact or very close hits: 10 points for getting a pick’s position exactly right; 8 points for being 1 pick off; 6 for being 2 off; 4 for being 3-4 off; 3 for being 5-8 off; 2 for being 9-16 off; and 1 for being 17-32 off. [continue reading…]

{ 13 comments }

Adam Steele on Negative Yards per Attempt

Adam Steele is back for another guest post. You can view all of Adam’s posts here. As always, we thank him for contributing.


On Monday, I updated my ever-evolving Positive Yards Per Attempt metric. Today’s post will serve as an introduction to its contra metric, Negative Yards Per Attempt (NegY/A). The very simple formula is as follows:

NegY/A = ( – sack yards – INT * 45) / dropbacks

The result will always be either zero or negative, but less negative (i.e., closer to zero) numbers are better. I chose to exclude fumbles because I want to maintain an apples to apples comparison with PY/A, so NegY/A covers passing plays only. I want to be very clear – NegY/A is NOT intended to be a comprehensive measure of QB play and should never be cited on its own. Its primary purpose, as with PY/A, is to estimate the relative importance of the different components of the passing game.

I won’t bore you with more words, so lets get straight to the numbers. Similar to the PY/A table, NegY/A is presented as both value over average and relative to league average on a per play basis. I wanted to cover the same timeframe as the previous article, so this includes all QB seasons since 1992 of at least 224 dropbacks (n = 829). [continue reading…]

{ 3 comments }

Last Tuesday, James “Four Touchdowns” Hanson posted a great article on the support that Peyton Manning, Tom Brady, Drew Brees and Aaron Rodgers have enjoyed throughout their careers. Two days later, he posted Part 2, and both articles were extremely well-received.  Today is the third part in his series. As always, we thank our guest posters for contributing. What follows are James’ words.


Elite Quarterbacks: Measuring Team Support by Wins & Losses

Last time, I took a look at the overall support received by four elite quarterbacks – Peyton Manning, Tom Brady, Drew Brees and Aaron Rodgers – throughout the course of their careers. [continue reading…]

{ 113 comments }

Positive Air Yards per Attempt: 2017 Update

Adam Steele is back for another guest post. You can view all of Adam’s posts here. As always, we thank him for contributing.


Positive Yards Per Attempt: 2017 Update

If I could only share one thing from my time doing football analytics, it would be the following principle: Positive plays carry more weight than negative plays in determining the winner of a football game. I’ve already written a couple of articles on this subject and hope to further the cause with this update.

Overview

For those of you who don’t feel like reading the previous two posts, I’ll give you the basic gist. Since passing has a far greater impact on winning than running, I’ve focused my research on quarterbacks, but the principle applies to the entire offense (defense, not so sure). Despite everyone constantly harping on turnover avoidance, a potent passing offense is usually able to overcome giveaways. Conversely, avoiding turnovers is normally not enough to overcome a weak passing game. Furthermore, turnovers are highly random and situation dependent, so it follows that turnovers are a very poor method of gauging quarterback performance. Even though sacks are largely the quarterback’s fault, they are also very context dependent and only contribute a small amount in determining game outcomes. More importantly, the majority of signal callers trade sacks for interceptions or vice versa, so it’s no really fair to include one but not the other. [continue reading…]

{ 119 comments }

On Tuesday, James “Four Touchdowns” Hanson posted a great article on the support that Peyton Manning, Tom Brady, Drew Brees and Aaron Rodgers have enjoyed throughout their careers. That was Part 1, and it received over 100 comments, so give it (and the comments section) a read. Today comes Part 2. As always, we thank our guest posters for contributing.  What follows are James’ words.


Team Support by Traditional Stats and Expected Points

About 35% to 55% of all offensive plays (depending on game script, offensive philosophy, personnel, etc.) are running plays, so there is value in looking at what each quarterback’s running game produced. Even if teams tend to run more after building a lead, it’s still a key part of closing out games. I’ve included their average league-wide ranks so we can get a better idea of how many seasons they enjoyed with great rushing support.

I’ve also included turnovers minus interceptions, which I assume are fumbles from the WRs, RBs, QBs, and Special Teams – but since I can’t determine who is responsible for what, I’ve included that information here under the assumption that most fumbles aren’t from the quarterback.

I should also note that while the rushing yards and touchdowns have had the quarterback’s contributions subtracted, the rushing first downs and expected points include any first downs gained by quarterback sneaks and scrambles.

The light green indicates the leader in that category, while the pink indicates the least amount of support in that metric.


In general, it looks like Brady and Brees have enjoyed the most rushing support while Rodgers has suffered the least amount of support by conventional metrics – and remember, those TD and first down totals include ones he picked up himself, meaning his support in those areas is likely even worse than the numbers indicate. Manning and Brady have had a top ten run game in 7 seasons, while Brees has had one 3 times and Rodgers has had a top ten running game in 2 seasons. [continue reading…]

{ 169 comments }

Today’s guest post comes from James “Four Touchdowns” Hanson, a relative new reader to the site. As always, we thank our guest posters for contributing.


Elite Quarterbacks: Measuring Overall Team Support

It’s easy for football fans to buy into the mainstream logic that if you have an elite quarterback, your team will have a winning record, enjoy trips to the post-season and even win a few championships. The better the quarterback, the more wins and titles you can expect… right?

But that logic doesn’t always hold up.  Dan Marino, Fran Tarkenton, Warren Moon, Dan Fouts, Jim Kelly, Sonny Jurgensen, Philip Rivers, and so on, provide examples to the contrary. And while his talents have been unfairly portrayed at times, the fact that Terry Bradshaw has four Super Bowl rings while superior passers have none presents a disconnect if you think great quarterback talent is measured by titles.

If we go by an average time of possession of 30 minutes per team, that means that half the time, a team’s quarterback isn’t even on the field. And if 35% to 55% of your team’s offensive plays are running plays… doesn’t that mean the quarterback really only affects 22% to 33% of the total game time? And once you get into other factors that affect a passer’s game, like play design and coaching, offensive line talent, receiving talent, quality of opposition, etc., attributing credit and blame gets pretty murky.

So while we have a general feeling that some quarterbacks receive more support than others, so how do we go about measuring it through metrics? Unfortunately, due to the nature of passing stats, I don’t know of a way to separate a quarterback from his receivers, pass blocking, scheme and play-calling. Whether it’s passer rating, ANY/A, or passing EPA, none of them can tell you which percentage of the credit (or blame) should be shared with those external factors.

That said, we can measure a quarterback’s support by looking at the numbers produced by his running game, defense and special teams. While I’d love to run these numbers for all quarterbacks, my ability to collect them is fairly limited (basically, cutting and pasting from Pro Football Reference – I don’t know enough about Python or R to run a spider to scrape them all in one go), so I will be focusing on four quarterbacks that are perceived to be “elite” by general mainstream consensus – Peyton Manning, Tom Brady, Drew Brees and Aaron Rodgers.

Due to length, I will be looking at these numbers in three separate articles. This one will focus on what support they received in these areas overall and the second will take a look at team support relative to the quarterback’s performance – how often their teams win when they have below-average performances and how often they lose when they perform at a high level (as measured by stats, natch).

Overall ANY/A, Passer Rating, & Expected Points Metrics

So let’s dig into the numbers. Here are the quarterbacks’ average stats per game for their overall careers including playoff games (which is why you may notice a difference between these and career averages that only include the regular season). The cells shaded blue indicate that quarterback is the leader among the four in that metric. While all of these metrics should be familiar to readers of the site, I have also included a metric I’m calling Relative Passer Rating (rPR) and it’s essentially the same concept as Relative ANY/A – it measures passer rating compared to the average for that season. For example, if the average is 80.0 and the passer earns a 90.0, his rPR would be +10.0.

As Peyton Manning is the only one of the four to suffer a physical decline in a career ending season, I have included his pre-2015 averages for the efficiency metrics in parenthesis next to his actual averages, though this will not affect any of the analysis from this point on – it’s more of a “nice to know”.
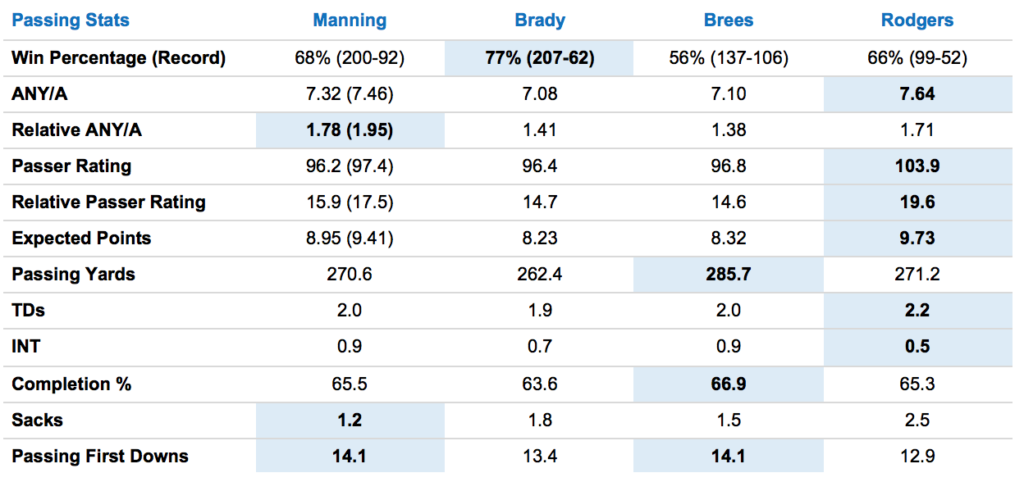
Great numbers across the board, as to be expected by elite players but it’s amazing how much higher Brady’s win percentage is than the other players despite not producing any clear statistical advantage in the efficiency or traditional metrics – and how much lower Brees’ win percentage is than the others despite his numbers being on par with the other three QBs.

Additionally, as their success in the playoffs makes us the biggest difference in the way people perceive these players, I will break out their playoff numbers in a separate table –
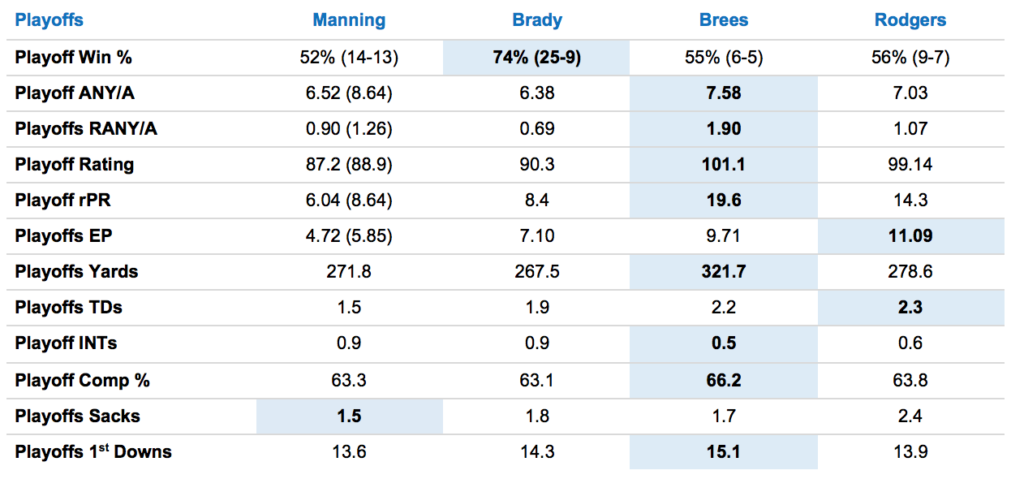
The numbers here probably come as a surprise – I know I didn’t expect Brees to sweep nearly every passing metric for the playoffs. While his smaller sample size comes into play, it doesn’t seem to have affected his win percentage, which is about on par with everyone except Tom Brady.

So there’s our starting point – we can see how each player has performed relative to the others, and while there are some clear leaders in the playoffs, they’ve produced at a similar level overall throughout their careers. Now let’s see how their teams have supported them.

Team Support Measured by Expected Points

As they’re the metrics that seem mostly closely tied to the margin of victory and defeat, I figured we’d start with Expected Points. Mike from Sports Reference defines Expected Points as a way to “break down the contributions each team’s various squads made to the margin of victory.” Those last few words are key; EP are applicable to the margin of victory – or defeat.

With that in mind, I went about measuring the EP of each quarterback’s passing offense against the rest of the team – running game, defense, and special teams. The sum of those three squads make up the Total Support EP number while the point differential is the average margin of wins and losses across their careers.

The EP Gained / Lost metric represents the average EP each quarterback’s running game, defense, and special teams have added or subtracted per game from the passing EP they generated. I also felt that per game average didn’t fully illustrate what effect those added or subtracted points had over the course of each player’s career, so I included the sum or difference in Total EP Gained / Lost.

Finally, since EP is tied to the margin of victory or defeat, I included the Point Differential to give the numbers some context. I also showed what each QB’s passing EP as a percentage of the average point differential in Pass EP % of Outcome so we could see how much credit or blame each quarterback should take for his team’s outcomes on average.

Red indicates negative EP while green indicates positive EP; dark green and dark red indicate who finished first and last in each category respectively.

First off, it’s clear that these players’ passing offenses have been the driving force behind their teams’ success. Compare their passing EP to the average margin of victory and you see that it’s each quarterback’s passing game that has created most or all of that point differential – it looks like most of the time, these guys carry their teams.

That said, we can see the EP support (AKA negative plays) has been very different for one player compared to the other three – Brady is the only one to have positive EP support in any category and amazingly has positive EP in ALL support categories. It’s said that the quarterback affects all other players on the field and while that may be true, we’re not seeing it in these results – every other QB has a higher EP average per game than Brady but gets worse support than him.

If we were to round the numbers, it looks like Manning’s and Rodgers’ team support have cost their teams around a field goal in points, on average, while Brees loses roughly 5 points. Meanwhile, Brady’s support has been worth an extra point to his Patriots. We shouldn’t misinterpret these numbers to suggest that somehow Brady is being carried by great support – it’s clear that Brady’s passing game is the engine that drives the Patriots’ success as a team but he’s the only quarterback of the four whose supporting elements haven’t cost him points.

This has led to his teams actually adding positive EP to his games overall, giving Brady nearly 264 expected points to his overall point differential over the course of his career. Manning and Brees, on the other hand, has had their teams cost them over 1,000 expected points and at the rate Rodgers’ offenses have been producing, Rodgers will likely join them by the end of his career.

Of course, there’s only so much we can see from these per game averages – let’s see what that EP looks like spread out over the course of their careers. After all, a team that provides -5 EP in five games and a team that provides +5 EP in two games and -20 EP in three games will both average out to -5 EP per game. But the first team had five straight bad games while the second team had three good games and two catastrophically bad games. Clearly, not the same thing.

So let’s look at how many games each passer and team have provided positive and negative support – and then let’s see how often that support has created a two-possession lead or deficit (9 points), three-possession lead or deficit (17 points), and while I know 24 points is technically three possessions, I think the odds of any team getting three TDs with three two-point conversions is very low – so I set 3 TDs (21 points) as my threshold for three-possessions. Additionally, we should see how often our QBs do the same, so those passing EP numbers are also included.

The leaders in passing EP are marked blue, the leaders in support EP are marked green, and ones with the least EP in each category are highlighted in red –
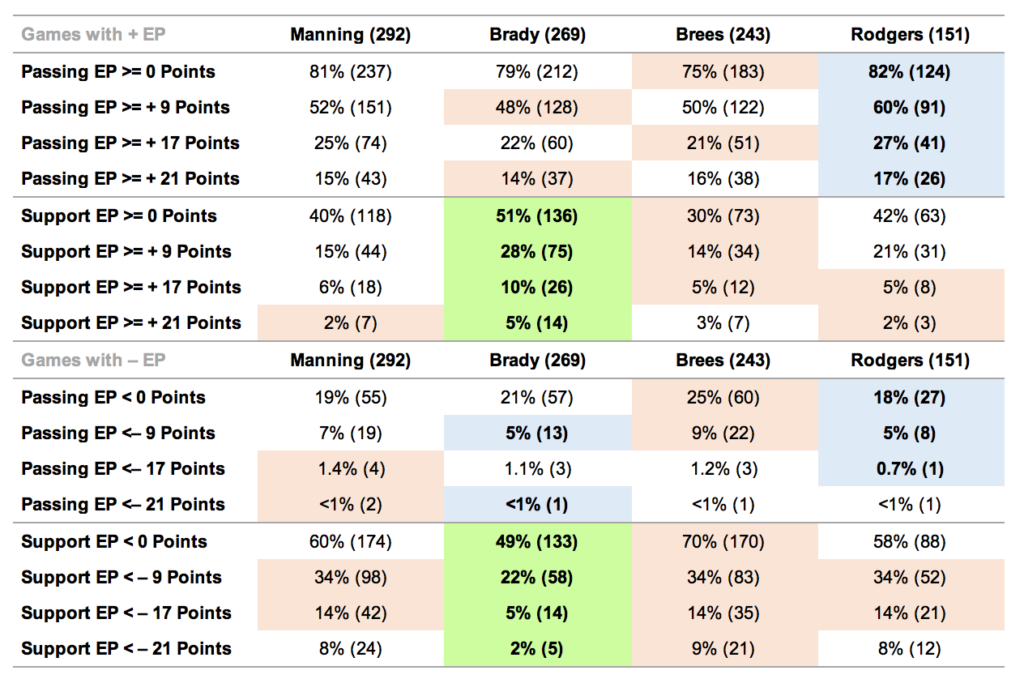
The numbers reflect what we’ve seen before – Aaron Rodgers leads in almost all categories with passing EP, having the largest number of games with positive EP and the fewest with negative EP. Meanwhile, Brady has the most games with positive support and the fewest games with negative support across all categories by a substantial margin, though he’s tied for the lead with Rodgers for the fewest games with negative EP over 9 points.

That all said, when you look at the actual number of games with negative passing EP, it’s really only a handful of difference between these players – they’re all incredible, posting positive EP in the vast majority of their games and two possessions worth of positive EP in about half of their games. These guys are considered the elites of the sport for a reason and these numbers bear that out.

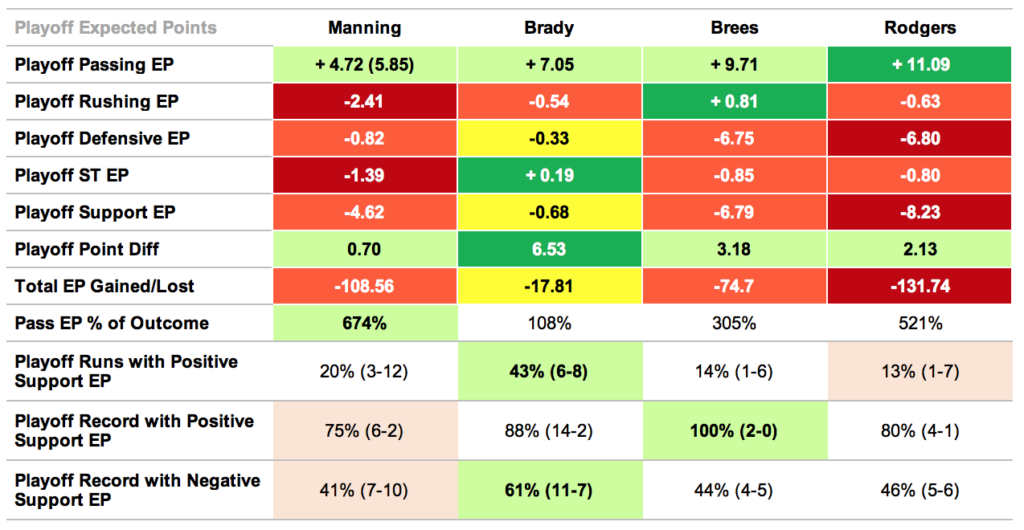
As before, I included their playoff numbers since that’s the core difference in how fans perceive them. One difference here from the previous chart, though – since none of them enjoyed totally positive playoff support, the QB with the smallest deficit of supporting cast EP is highlighted in yellow–
If you think about it, it’s kind of amazing that despite Manning, Brady and Brees playing over 240 games (Rodgers at 151), a small fraction of them determine how the general public sees these players — the playoff games. Manning has played 292 games and the outcome of 27 will determine how he’s remembered. Brady has played 269 and 34 are what makes him the GOAT to most of the public. Brees has played 243 and the outcome of 11 is what keeps him out of most people’s conversation for GOAT. Kinda nuts – but at least Rodgers still has a lot of his career ahead of him. Hopefully, Green Bay will get the man some help!

With that in mind, I decided to add three rows to this column since we’re dealing with such a small sample size for the playoffs so we can understand the narrative behind the averages a little better – how many playoff appearances they had with positive support EP, their record with that support, and then their record with negative support. While they all had negative support in the playoffs, Brady’s did the least amount of damage – despite both Brees and Rodgers having higher passing EP, their playoff point differential is less than half of Brady’s. Meanwhile, it seems Manning has to assume some responsibility for his lack of playoff success as his passing EP drops dramatically in the playoffs.

That said, in terms of win percentage, they all do better with positive support – Manning seems to do worst but still has an incredible 75% win percentage, way up from his 52% overall.

And while the results so far of this study have shown that Brady has received the most support while not always posting the best efficiency metrics or raw stat totals, we have to give him his due – he is the only QB of the four with a winning playoff record in games with negative EP support.

So how does this all translate to Super Bowls? Two of Manning’s three playoff runs with positive support netted him a Super Bowl title (his other was in 2014 when he was hindered by injuries that would ultimately end his career), while Brees’ and Rodgers’ only playoff run with positive support led to them winning a Super Bowl (Brees’ Special Teams EP in his Super Bowl was nearly 10 points alone!). On the other side, Tom Brady has won three Super Bowls with positive support and two Super Bowls with negative support (though all Super Bowl runs featured at least one game with positive support that contributed more to the margin of victory than passing EP), which certainly adds some credibility to the idea that he’s got a bit more “clutch” to him than the other three quarterbacks.

All that said, we can see how much more the other three quarterbacks lost due to poor playoff support – despite having the lowest passing EP by far, Manning also contributed the most to his team’s point differential, suggesting that overall, they would have done much worse without him.

Below, we see the numbers that tell the story of Manning’s playoff struggles – he’s generated the fewest games with positive EP and the most games with negative EP as a percentage and his poor games have been more catastrophic than the others, while his great games have been more dominant than the others. His passing offenses seem to be “feast or famine” in the playoffs. Beyond that, the story stays the same for the other QBs – Rodgers and Brees generate the best playoff passing EP but suffer the worst support EP of the four QBs, while Brady’s great EP performances seem to be hindered the least by his supporting squads.
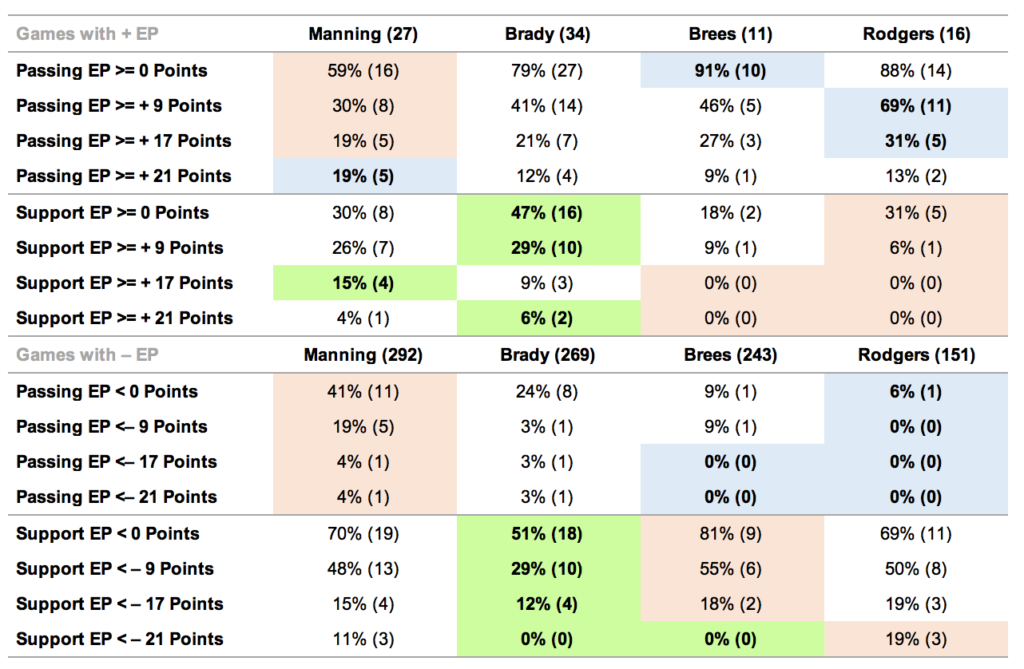
So, what is the deal with Manning in the playoffs? We’ve established his support was poor in general, but poor support hasn’t hindered the other QBs as much as it has Peyton (though both Brees and Rodgers playoff sample size is much smaller than Manning’s). It’s a question many have asked and for my money, probably most satisfyingly answered in Scott Kacsmar’s two-part article on Football Outsiders, which you can read here and here.

His critics seem to feel that the pressure and anxiety caused by the high-stakes “lose and you’re out” playoffs format causes Manning to play worse. Perhaps this is true – but I find it hard to believe that he can, for example, run the same “levels” play over and over in the regular season but once the playoffs start, he suddenly can’t make the reads and throws he’s made literally thousands of times before. I’d need to see film study done to believe this theory – if someone can show me that Manning consistently made more bad reads and missed open receivers in the playoffs, while under the same amount of pressure as usual, I can believe it was psychological.

But there are other possible explanations. The first is that the small number of playoff games can skew numbers due to a high degree of variability found in small sample sizes. Perhaps Manning was just unfortunate that he had a higher percentage of his poor games in the playoffs than the other QBs. After all, his career efficiency averages, even when adjusted for opponent like DVOA, suggest he’s had the same percentage of bad games overall as the other three QBs. I find this plausible but perhaps a bit unsatisfying.

Ultimately, it’s something we won’t be able to figure out here, so let’s move on to looking at support measured by traditional metrics.  That will come in Part II.

{ 148 comments }

Today’s guest post comes from Damon Gulczynski, a longtime reader, Seattle sports fan, and part-time writer. He also wrote this book on baseball names. As always, we thank our guest posters for contributing.


A journeyman quarterback appears here

When the New York Jets exercised an option to void the contract of quarterback Ryan Fitzpatrick in February, they paved the way for yet another stop on his already lengthy tour through the cities of the NFL.  If the hirsute Harvardian plays in at least one game this upcoming season with a new team, it will mark the seventh time he has done so.  To my knowledge, this would tie the all-time record among NFL quarterbacks.  That is, unless his replacement in New York takes a snap before him.  Josh McCown has already played with seven different NFL teams; the Jets will be his eighth.

At this point, both McCown and Fitzpatrick have surely already attained the venerated title of “journeyman,” but it goes beyond this.  I contend that by the end of the 2017 NFL season, McCown and Fitzpatrick will be the two journeyman-est quarterbacks in NFL history.  To support this contention, I introduce a new metric I developed called Journeyman Score (JM score). [continue reading…]

{ 23 comments }

Today’s guest post comes from James “Four Touchdowns” Hanson, a relative new reader to the site. As always, we thank our guest posters for contributing.

[Editor’s note: There were a couple of minor bugs in the original data. This post has now been updated.]


There may be no two quarterbacks more often measured against each other than Tom Brady and Peyton Manning. One simply has to do a Google search of the topic to see that fans and sports writers have compared the two numerous times, using a vast array of criteria from the simple counting of championships to using advanced analytics to make their case.

So it’s surprising to me that I still haven’t come across a comparison of Manning and Brady against the same defenses. It’s an idea that occurred to me when Manning critics pointed out that much of his record-breaking 2013 season came against the mediocre teams of the 2013 NFC East and AFC South, while Tom Brady’s record-breaking 2007 was against a tougher strength-of-schedule. [1]While I am a Peyton Manning fan, I feel the point is valid and logical. We compare stats so often but don’t always take into account that most of those numbers were earned against different teams … Continue reading If we’re genuinely after the fairest assessment possible – which is why I assume fans of advanced analytics prefer to measure individual players by their own production rather than team results like wins and championships – what better way to measure each player than by how they performed against the same competition?

So I decided to take a look at the seasons in which Manning and Brady were both active and played against the same teams in the same season. Of course, like any statistical analysis, this one comes with its own set of flaws. When the two quarterbacks play each other’s divisions or one plays the same team in the regular season and the playoffs, one of them may have played the same team twice or even three times in a single season while the other has played them only once.

This can be good or bad for the player’s results – sometimes it allows the opposing defense to learn from the first encounter and make life difficult for the passer the second time around. One example is Peyton Manning’s encounters with the Steelers in 2005; he defeated Pittsburgh with a 102.9 rating and 8.67 ANY/A during the regular season, only to see his performance suffer the second time around during the post-season with a 90.9 rating and 6.21 ANY/A in a loss. Meanwhile, Tom Brady’s single game against the Steelers, where he won with a 92.7 rating and 6.84 ANY/A, stands alone – could he have done better or worse in a second encounter? We’ll never know.

Other times, it can allow the quarterback another opportunity to do well against that defense. When Brady played the Jets for the first time in 2010, he earned a mediocre 72.9 rating and 5.11 ANY/A in a loss. He bounced back to win with an extraordinary 148.9 rating and 12.00 ANY/A in their second meeting and then fell somewhere in between when they met in the playoffs, losing with an 89 passer rating and 5.08 ANY/A. Meanwhile, Manning met the Jets just once in the post-season, where he suffered a loss despite earning a 108.7 rating and 8.85 ANY/A in his last game wearing a Colts uniform. How would he have done if he played the Jets three times? Again, we’ll never know.

In fact, the sometimes vast difference in which each QB has performed against the same defense in the same season should encourage us to take these results with a grain of salt – in-game conditions, game plans from coaches, the play from supporting casts, how one team’s strengths and weaknesses match differently with an opponent, playing at home or away, key injuries on either side, etc. can all effect a player’s performance in any given game.

And there’s always the possibility that Brady or Manning just had a bad day and their performance isn’t indicative of their true abilities: the small sample size of a football season made even smaller by singling out common opponents isn’t ideal in determining a fair and scientific measurement for how good each player actually is. On the other hand, it’s the only evidence we have available, so we’ll have to roll with it.

I bring this up because I don’t intend this to be a definitive attempt at determining which player is better – most people already have made up their minds (and I personally tend to rate quarterback on tiers anyway). Some say Manning would have more championships if he had Belichick and the Patriots organization at his side, while others say Brady would have bigger numbers if he had the receiving talent Manning had during his career. I think both can be true.

I’d also like to mention that I pulled this list manually and despite several reviews, there still may be errors in the data – this is unintentional and I welcome any corrections.

So without further ado, here’s a list of the common opponents they faced in each season, with both 2008 (Brady played one game) and 2011 (Manning was inactive) removed as both players weren’t active during those seasons:

• 2001: Jets, Bills, Dolphins, Raiders, Saints, Falcons, Broncos, Rams
• 2002: Dolphins, Jets, Steelers, Titans, Broncos
• 2003: Dolphins, Jets, Bills, Browns, Broncos, Jags, Texans, Titans, Panthers
• 2004: Ravens, Chiefs
• 2005: Steelers, Jaguars, Chargers
• 2006: Bills, Jets, Dolphins, Titans, Jags, Texans, Broncos, Bengals, Bears
• 2007: Chargers, Ravens, Jaguars
• 2009: Bills, Jets, Dolphins, Titans, Jags, Texans, Ravens, Broncos, Saints
• 2010: Chargers, Jets, Bengals
• 2012: Texans, Ravens
• 2013: Colts, Ravens
• 2014: Bills, Jets, Dolphins, Raiders, Chiefs, Chargers, Colts, Bengals, Seahawks
• 2015: Colts, Steelers, Chiefs

And here are their career averages against common opponents from 189 total regular season and playoff games played (93 Manning, 96 Brady):

Except for interception percentage, Manning seems to have a slight advantage across the board. Most differences are so small that I personally consider them basically even in most categories. The biggest differences seem to be that Manning’s interception rate is substantially higher, while Brady’s sack numbers are substantially higher – and in Brad Oremland’s TSP and Career Value metrics, where Manning holds a commanding lead.

To delve a little further into the numbers, let’s look at the advanced stats of each player by season. The highlights indicate which player did better that year in each metric, while the bolded numbers indicate that season’s number marks a career best (against common opponents) –

The leader in both ANY/A and Passer Rating match in every season, with Manning’s rates beating Brady’s in 8 of the 13 seasons compared. QBR results are also is very similar, with the only difference being Brady having the edge in 2014, putting them even at 4-4.

Interestingly, it seems that for most seasons, one player clearly played better against common opponents by a substantial amount – in Passer Rating, the two only play at a similar level in 2001 and 2007, while the rest of the time the winner often beats the other by ten points or more! What’s really surprising to me is that Manning surpasses Brady in every metric for 2007, which was when Brady led perhaps the greatest offense of all time to a record-breaking season and an AFC Championship.

I also wanted to compare their performances against common opponents in each season by TSP but since it’s a raw sum instead of an average like the other advanced stats, I needed to take each season’s statistical averages and multiply them to get 16 games worth of production. The results were –

The first thing that jumps out at you is Manning’s preposterous 2013 prorated across 16 games – over 6,500 yards and 75 TDs with only 5 INTs. That alone tells us to take these results with a grain of salt.

But accepting the numbers for what they are, we see that the leader in TSP for each season matches the leader in Passer Rating and ANY/A. We also see that Manning’s highs and lows are quite extreme in comparison to Brady’s – Brady doesn’t have a season that matches Manning’s 2004 and 2013, but Brady’s TSP never dips into negative numbers as Manning’s does in 2002 and 2015.

And again, Manning’s 2007 results manage to top Brady’s numbers for his most legendary statistical season (though that probably means nothing since the sample size we’re working with is so small).

So what does this all prove? Well, nothing really. As said, I think the majority of people already have their opinions set for these players – this is just for fun. Hope you enjoyed!

References

References
1 While I am a Peyton Manning fan, I feel the point is valid and logical. We compare stats so often but don’t always take into account that most of those numbers were earned against different teams of varying quality – after all, it’s not fair to compare passing numbers if one guy is going up against the 2002 Bucs while the other is playing the 2015 Saints, right?
{ 207 comments }

Adam Steele is back to recap his Wisdom of Crowds work. As always, we thank him for that. Football Perspective wouldn’t be what it is without contributions like this from folks like Adam.


I’d like to thank everyone who voted in this year’s Wisdom of the Crowds, and I also appreciate your patience in waiting for the long overdue recap article. I’m not much for small talk, so let’s get right to it.

Originally, my plan was to simply tally the scores and use the totals for the QB ranking. However, it quickly became evident that this wasn’t going to work, as we had very large discrepancies in how voters allocated their points. Some people awarded 25 points to their pick for best ever, while others didn’t give any QB more than six points. It would be just plain wrong for one voter’s GOAT to be weighted four times more than the next voter. My solution (helmet knock to commenter hscer [1]I highly encourage you to check out hscer’s collection of Sporcle quizzes., since he came up with it) is to tabulate points in proportion to the highest score on each ballot. Thus, a QB who scores five points on a ballot with a 25 maximum receives 0.2 ranking points, while a five-pointer on a ballot with a maximum of six is awarded 0.83 ranking points. This levels the playing field for all ballots, and in my opinion yields a far more honest result than the simple tally method. Since the abstract concept of ranking points is tough to put in proper context, I’ve translated them into Share %, which is the percentage of possible points earned. We had 51 legal ballots submitted this year, so Share % = ranking points / 51.

Results

In order to qualify for a WOC ranking, a quarterback had to be listed on a minimum of three ballots, leaving us with 36 qualifying QB’s. The table below lists the quarterbacks’ Share %, ballot appearances, “pantheon” appearances (ballots where he received at least 0.5 ranking points), and ballots where he received the highest score (including ties). I also included the ranking each QB earned in the 2015 edition of this exercise, as well as the number of positions gained or lost from 2015 to 2017. [continue reading…]

References

References
1 I highly encourage you to check out hscer’s collection of Sporcle quizzes.
{ 50 comments }

Guest Post: Alternative Super Bowl MVPs

Today’s guest post comes from Damon Gulczynski, a longtime reader, Seattle sports fan, and part-time writer. He also wrote this book on baseball names. As always, we thank our guest posters for contributing.


White runs for a score against the Falcons

James White was fantastic in Super Bowl LI, setting records in receptions (14) and total points (20), but he did not win the MVP Award.  Instead the voters bestowed that honor on a player who reduced his team’s chances of winning by nearly 15% on a single play (Robert Alford’s pick-six).  That, of course, is a misleading statement — Tom Brady went on to finish the game with over 450 passing yards in leading his team to the greatest comeback in Super Bowl history — but it is completely accurate to say James White was fantastic.  It would not have been unreasonable in the least to pick him over Brady for game MVP.  Super Bowl LI was a case where it would have been more representative of the story of the game to give out two MVP awards — or better yet to have a “three stars” of the game system, like hockey, so that Trey Flowers (2.5 sacks) could have been recognized along with Brady and White.

With this in mind, for fun, I decided to go through each of the 51 Super Bowls and retroactively select the three stars of the game.  In making these selections I relied on box scores, play-by-play logs, news articles, and video clips from past Super Bowls.  My full list is given below.  The actual Super Bowl MVPs are denoted with a + sign after their name; players on the losing team are denoted with a ~ after their name.  In 30 of the 51 cases the MVP was my first star of the game, which means I think the voters “got it wrong” 21 times.  And in six cases I think they really got it wrong, as the player they chose for MVP did not even qualify as my third star of the game. [continue reading…]

{ 29 comments }

Brad Oremland is a longtime commenter and a fellow football historian. Brad is also a senior NFL writer at Sports Central. There are few who have given as much thought to the history of quarterbacks and quarterback ranking systems as Brad has over the years. What follows is Brad’s latest work on quarterback statistical production.

Author’s Note: This is a very long post, but I discourage you from skimming it. Wait to read it until you can go over it without feeling distracted.

Two years ago, I wrote an exhaustive series on the greatest quarterbacks of all time. That was a subjective ranking, but I also discussed the formula for Quarterback Total Statistical Production, QB-TSP. This post concerns that stat, QB-TSP, so you may want to read that link if you haven’t already.

I’ve made three minor adjustments to the formula since that writing: [continue reading…]

{ 122 comments }

I’m very short on time, so Bryan Frye agreed to help keep the streak alive here by asking me to reproduce his All-Time 53 Man NFL Roster. What follows is a reproduction of his work here on his all-time 53 man roster. Given that I am short on time, maybe you are long on time (is that how time works?), in which case — get ready for a great read.

******************

Sometimes when I am bored, I make football lists or rosters in my head (what is the all-time Steelers team, what is the current all-NFC South team, what is the all-time Hispanic team, etc.). Of all the whimsical thought experiments in which I have engaged, the one with the most decisions and revisions has been my all time 53 man NFL roster (with coaching staff).

The purpose of building an all time 53 man NFL roster is not to simply pluck the best 53 players out of history. If I did that, I’d end up with an unbalanced roster, with as many as seven quarterbacks. Having seven Hall of Fame passers would be nice, but it’s completely unnecessary. The important thing to me is depth, which means I value versatility from the players on the roster. Yes, Jan Stenerud was a great kicker, but why put him on the team when I can have Gino Cappelletti kick, return kickoffs and punts, take handoffs, and catch passes? You get the idea. I will make exceptions for most starters, but I want most of my backups to contribute in more than one area.

Having read the comments sections in some popular sports sites, I feel that it is necessary to make the following disclaimer: Players will be picked, in large part, based on how they performed in their respective eras. Danny Fortmann was one of the great interior offensive linemen of his generation, but it would be insane to posit that he could be plucked out of 1941 and be a star guard today at 6’0” and 210 pounds. That’s smaller than RG3. [continue reading…]

{ 58 comments }

Wisdom of Crowds: Quarterback Edition (2017)

Adam Steele is back with some Wisdom of Crowds work. As always, we thank him for that.


In 2015 we ran a pair of Wisdom of the Crowd exercises, one for quarterbacks and one for running backs. Participation was high and the ensuing discussions were plentiful, so I decided to bring the idea back this year. First up are quarterbacks, but there will be new rules this time around. The previous edition asked voters to rank their quarterbacks 1-25, with points scored in linear fashion based on the ranking from each ballot. While that method was simple, it left a lot to be desired. Most notably, voters weren’t able to indicate the magnitude of difference between the QB’s on their lists, so the difference between 24th and 25th was worth the same as the difference between 1st and 2nd. That’s just plain wrong.

New Rules

1) Each voter will be allotted 100 Greatness Points to distribute to quarterbacks as he or she wishes, with a few caveats.

2) The maximum points given to a single QB may not exceed 25.

3) Ballots must include a minimum of ten quarterbacks, with a maximum of 40.

4) Points must be assigned as whole numbers.

Just as before, you are free to use whatever definition of Greatness you see fit. If you have trouble getting started, it’s helpful to list every quarterback that you consider Great, then distribute points based on the relative standing among the quarterback you listed. In order for this exercise to work properly, please submit your ballot before reading anyone else’s; we want each opinion to be as independent as possible. Your ballot will not be counted if the points don’t add up to exactly 100, although I will let you know and give you a chance for revision. Here is an example of how I’d like your ballot to look (of course yours may include more quarterbacks): [continue reading…]

{ 279 comments }

Today’s guest post/contest comes from Thomas McDermott, a licensed land surveyor in the State of California, a music theory instructor at Loyola Marymount University, and an NFL history enthusiast. As always, we thank him for his hard work. You can view all of his work at Football Perspective here.


I wrote this article last year, when I generated the statistics and then ranked all starting quarterbacks in 2015 based on how well they played in “clutch” [1]Note that throughout this post, anything that happens within this situation is termed “clutch”; as in “clutch yards”, “clutch plays”, “clutch touchdown”, etc. situations. I used a simple definition: if it occurred in the 4th quarter or overtime, when the game was tied or the quarterback’s team was trailing by as much as one score (8 points), then it was a clutch situation.

The main metric used was Bryan Frye’s Total Adjusted Yards per Play, and today we’ll use the same methodology [2]In my post last year, I included a 2-point conversion bonus of 15 yards which I’m going to leave out for now. Besides not really adding much to the study, when I started collecting the data for the … Continue reading to find the 2016 Clutch Value Leader as well as the single season leaders since 1994. Here’s Bryan’s TAY/P formula, which Chase supports as an all-encompassing basic measure of quarterback performance:

(passing & rushing yards + (touchdowns * 20) – (interceptions * 45) – (fumbles lost * 25) – ( sack yards)) / (pass attempts + rush attempts + sacks) [3]Note that Bryan uses a 25-yard penalty for all fumbles (lost or recovered) while this study uses that penalty for lost fumbles only (which are the only ones being counted here).

The other change I’m making from the previous post, is that I’ll be using a 3-year rolling league average, as opposed to a single year league average, when adjusting for era. Thanks to Bryan (through his great website GridFe) for providing me with that information.

So let’s get to it. Below are the quarterbacks in 2016 who had at least 30 clutch action plays, [4]For 2015, I used 24 actions plays as the cutoff, after looking at the numbers more when doing the single-season rankings, 30 seemed more appropriate. and here’s how to read the table: [continue reading…]

References

References
1 Note that throughout this post, anything that happens within this situation is termed “clutch”; as in “clutch yards”, “clutch plays”, “clutch touchdown”, etc.
2 In my post last year, I included a 2-point conversion bonus of 15 yards which I’m going to leave out for now. Besides not really adding much to the study, when I started collecting the data for the single season and career leaders in this metric, I found that the data on 2-point conversions is somewhat spotty before 2005; in fact, in most cases before 1998, the players involved aren’t even mentioned. So, for those of you who read the last post, taking away that conversion bonus means Eli Manning is at the top for 2015 and not Jay Cutler.
3 Note that Bryan uses a 25-yard penalty for all fumbles (lost or recovered) while this study uses that penalty for lost fumbles only (which are the only ones being counted here).
4 For 2015, I used 24 actions plays as the cutoff, after looking at the numbers more when doing the single-season rankings, 30 seemed more appropriate.
{ 23 comments }

Guest Post: Wide Receivers and the Hall of Fame

Today’s guest post comes from one of the longest followers of this blog (and its predecessor), Richie Wohlers. Richie is 44-year-old accountant from Southern California who is a Dolphins fan despite never being to Florida. As always, we thank our guest posters for contributing.


Previously, I looked at linebackers and centers in the Pro Football Hall of Fame. With Andre Johnson’s recent retirement announcement, I thought it would be a good idea to take a look at wide receivers next. As before, I am just taking a look at post-merger players by using some objective factors to try to get a picture of what a typical HOFer looks like. Those factors are All-Pros, Pro Bowls, Weighted AV, Total AV, Super Bowl Appearances and Super Bowl wins). I am going to classify all players into a single position for simplicity. If you are interested in knowing the details of my calculation, see footnote. [1]Methodology: For All-Pros, Pro Bowls, Career AV and Total AV, I am looking at the average numbers for each player at his position. In an attempt to make the average HOFer at a position worth 100 … Continue reading

I explored the relationship between statistics (receptions, yards, touchdowns) and HOF induction for WRs, and it doesn’t improve the correlation. My “Career Score” is more aligned with HOF inductions than any single receiving statistic. The correlations are hurt by weak stats from HOFers like Swann and Hayes. And they are also hurt by big numbers from non-HOFers like Henry Ellard, Harold Jackson and Football Perspective hero Jimmy Smith. [continue reading…]

References

References
1 Methodology: For All-Pros, Pro Bowls, Career AV and Total AV, I am looking at the average numbers for each player at his position. In an attempt to make the average HOFer at a position worth 100 points, I am assigning a weight of 16.6 for each category (16.6 times 6 categories equals 99.6 points). If an average player had 5.7 All Pros I divided 16.6 to get 2.9. So each All Pro is worth 2.9 points at that position. Super Bowls are the exception. I’m just going with a straight points system. One appearance is 8 points, 2 appearances is 14 points, 3 appearances is 18 points, and then 2 more points for each additional appearance. Super Bowl wins are worth 12, 20, 26, 30 and then 2 more per additional win. I add them up for a “Career Score”.
{ 43 comments }

Adam Steele is back for another guest post. You can view all of Adam’s posts here. Adam is now on Twitter, and you follow him @2mileshigh. As always, we thank him for contributing.


In 2014, Football Perspective ran a pair of crowd sourcing exercises to determine the greatest quarterbacks and running backs of all time. These experiments were a lot of fun and generated a great deal of debate amongst the participants, so I thought it would be worthwhile to give crowd sourcing another shot. NFL quarterbacks are the most discussed and analyzed athletes in America, but we can’t properly debate the merits of the league’s famous signal callers without considering the effects of their supporting casts. As of today, there is no mathematically accurate way to measure the strength of a QB’s teammates and coaches, but there are plenty of people around who possess the football knowledge to make educated guesses. Basically, this is the perfect candidate for crowd sourcing. I want to keep things simple to maximize reader participation, so there are just a handful of guidelines I expect participants to follow:

1) Please rate a QB’s supporting cast based on how they affected his statistical performance, not his win/loss record or ring count. The supporting cast umbrella includes the direct effect of skill position teammates, offense lines, coaches, and system, but also the indirect effect of defense, special teams, ownership, and team culture. You’re free to weigh these components however you see fit. The rating for each supporting cast will account for the quarterback’s entire career, using a 0-100 scale. As a rule of thumb, a 100 rating equates to an all star team, 75 is strong but not dominant, 50 is average, 25 is weak but not terrible, and 0 is equivalent to the 1976 Buccaneers.

2) Ratings should be roughly weighted by playing time. The years in which a QB is the full time starter should count more heavily than seasons where he’s a backup or spot starter. And this almost goes without saying, but supporting casts are best evaluated in the context of their respective eras.

3) You may rate as many supporting casts as you wish. Since I will be compiling the results by hand, it doesn’t matter how you order your list, as long as it’s easy to read. I ask that you refrain from rating the supporting casts of quarterbacks you’re not reasonably familiar with; if you don’t know anything about a QB’s career, don’t guess! Any quarterback with at least 1,500 pass attempts is eligible to be rated, and I’ve provided a list of these quarterbacks here. Feel free to break up your ratings into multiple posts on different days, but just be sure to post with the same username each time so I can properly count the results. I plan on keeping the poll open for one week, but reserve the right to extend the duration if interest from new participants remains high enough.

Have fun!

{ 25 comments }

Adam Steele is back for another guest post. You can view all of Adam’s posts here. As always, we thank him for contributing.


Previously, I introduced my new metric — Adjusted Points Per Drive — for measuring team offense. I thought it would be fun to apply the same methodology to quarterbacks, which I what I’m doing today. I highly encourage you to go back and read the previous post if you haven’t already, because I don’t want to clutter today’s post by repeating all of the calculation details.

Unfortunately, I don’t have drive stats for individual games, so there’s going to be some approximation here. To calculate a quarterback’s career Adjusted Points Per Drive (AjPPD), I simply take his team’s AjPPD from each of his playing seasons and weight those seasons by games started. This will give us a measure of a quarterback’s scoring efficiency, but it doesn’t account for volume or longevity. That’s where Adjusted Offensive Points (AjPts) comes in handy.

I assign each QB a portion of his teams’ Adjusted Points, then compare that to league average to calculate Points Over Average (POA). The formula for calculating a given season’s POA = (Tm AjPts – 315) * (GS / 16). The 315 figure is derived from multiplying my normalized baselines of 1.75 AjPPD by 180 drives per year, meaning the average team scores 315 Adjusted Points per season.

I’ll use Ben Roethlisberger’s 2015 season as an example: Pittsburgh scored 400 Adjusted Points and Ben started 11 games, so his 2015 campaign is worth (400 – 315) * (11 / 16) = 30 POA. Do this for every season and we have Career POA, which is the primary metric I’ll be using here. However, some people prefer to rank quarterbacks based on their peak years rather than their entire career, so I added the “Peak” column which is the sum of each quarterback’s three best POA seasons.

This study includes all QB’s who started their first game in 1997 or later, and made at least 40 starts between 1997 and 2015 (partial numbers from 2016 are not included). These criteria leaves us with 56 quarterbacks. Before we dig into the results, it’s worth noting that the correlation between Career POA and ANY/A+ is a healthy 0.92. We all know that the NFL is a passing league, but drive efficiency is even more dominated by the passing game than I thought. According to r2, 85% of the variance in Adjusted Points Per Drive is explained by a basic measure of passing efficiency. That doesn’t leave much room for the running game to have an impact. In fact, I’ll go as far to say that rushing efficiency has no appreciable impact on scoring for the majority of teams. That’s not to say running the ball is useless; offenses must run occasionally to keep the defense honest, and running comes in handy for converting short yardage and bleeding the clock. But, to quote Ron Jaworski, “Points come out of the passing game!”

Time for the rankings… [continue reading…]

{ 8 comments }

Adam Steele is back for another guest post. You can view all of Adam’s posts here. As always, we thank him for contributing.


Adjusted Points Per Drive

I love drive stats. There’s no better method, in my opinion, of measuring the performance of offensive and defensive units. However, raw points per drive has a couple of glaring flaws – it doesn’t account for field position or adjust for league offensive efficiency. In this post, I am going to correct those issues and rank every offense in the drive stat era (1997-2015). [1]Drive Stats provided by Jim Armstrong of Football Outsiders, and expected points data courtesy of Tom McDermott. To accomplish this, I created a simple metric called Adjusted Points Per Drive. Here’s how it’s calculated:

Step 1: Calculate total offensive points for each team. OffPts = PassTD * 7 + RushTD * 7 + FGAtt * (LgFGM / LgFGA). I chose to use the average value of a field goal attempt rather than made field goals, as I want to minimize the effect of special teams. In 2015, for example, the average FGA was worth 2.535 points, so I plug that number into each team’s number of attempts.

Step 2: Calculate points per drive (PPD). All drives ending with a kneel down are discarded. PPD = OffPts / Drives.

Step 3: Adjust for starting field position. The expected points value of each yard line is a bit noisy, so I smoothed it out into a simple linear formula. Every yard is worth 0.05 expected points, and PPD is normalized based on an average starting field position at the 30 yard line. I call this field position adjusted points per drive, or fPPD for short. fPPD = PPD – ((AvgFP – 30) *0.05). With this step, we can accurately compare the scoring production of all teams within a given season.

Step 4: Adjust for league scoring efficiency. I normalize each season’s fPPD to a baseline of 1.75 to calculate adjusted points per drive. At the team level, AjPPD = fPPD / LgfPPD * 1.75. Now, at last, we can compare the scoring production of every team since 1997. To make AjPPD more intuitive, I also translate it into adjusted offensive points (AjPts) using a baseline of 180 drives per team season. AjPts = AjPPD * 180. [continue reading…]

References

References
1 Drive Stats provided by Jim Armstrong of Football Outsiders, and expected points data courtesy of Tom McDermott.
{ 22 comments }

Guest Post: Centers and the Hall of Fame

Today’s guest post comes from one of the longest followers of this blog (and its predecessor), Richie Wohlers. Richie is 44-year-old accountant from Southern California who is a Dolphins fan despite never being to Florida. As always, we thank our guest posters for contributing.


Last time, I took a look at linebackers in the NFL Hall of Fame. Today, I am going to investigate centers and the Hall of Fame.

As before, I am just taking a look at post-merger players by using some objective factors to try to get a picture of what a typical HOFer looks like. Those factors are All-Pros, Pro Bowls, Weighted AV, Total AV, Super Bowl Appearances and Super Bowl wins). I am going to classify all players into a single position for simplicity. [continue reading…]

{ 23 comments }

Guest Post: Linebackers and the Hall of Fame

Today’s guest post comes from one of the longest followers of this blog (and its predecessor), Richie Wohlers. Richie is 44-year-old accountant from Southern California who is a Dolphins fan despite never being to Florida. As always, we thank our guest posters for contributing.


This is the first part in my series looking at the NFL Hall of Fame.  I am going to take a look at which players are in the HOF, and look at some objective attributes of HOFers.  I am only going to focus on players who played any part of their career after the AFL-NFL merger in 1970.  While this will include many players who played in the pre-merger days, the bulk of the careers will have at least been played since 1960 with at least 21 combined teams.  Before the AFL came along there were generally many fewer teams, so things like draft position and Pro Bowl/All Pro honors are more difficult to compare.  Also, the game of pro football was much different before the 1950s.  I am mostly going to stick with looking at the few statistics that can be compared across positions, such as All Pros, Approximate Value, etc.

I created a very quick and simple formula to give each player a career score based on the average of six statistical categories (All-Pros, Pro Bowls, Weighted AV, Total AV, Super Bowl Appearances, Super Bowl wins) at a position.  Each category is weighted equally (though, the categories are related, and winning a Super Bowl essentially becomes worth 2 categories).  The average HOF player at each position will have a score of 100.  This makes an easy (though not exhaustive) way to rank careers, and to quickly see if anybody is missing from the HOF.  I feel that using honors (Pro Bowl, All Pro) helps factor in peak value, AV factors in total value and Super Bowls helps factor in players on winning teams, who HOF voters seem to favor.

Today I am taking a look at linebackers. [continue reading…]

{ 69 comments }

Today’s guest post/contest comes from Thomas McDermott, a licensed land surveyor in the State of California, a music theory instructor at Loyola Marymount University, and an NFL history enthusiast. As always, we thank him for his hard work. You can read all of his guest posts at Football Perspective at this link.


The following is a bunch of data I’ve gathered regarding home-field advantage; hopefully some of you will find it useful for analysis, or for picking winners against the spread in your pick’em games this year!

The general consensus is that the home team in a typical NFL game has an advantage of around 2.5 to 3 points, and this is right on: since 1970, the average team wins their regular season home games [1]The HFA number during the playoffs over that same period is 6.5, but that’s probably due to playoff seeding than fan/stadium involvement; it might be interesting to look into this further. by 2.7 points, [2]As far as what causes home teams to have an advantage at home, Brian Burke suggests in this article that it has more to do with environmental familiarity, and other factors, than the effect of … Continue reading with a high of 4.6 in 1985 and a low of 0.8 in 2006. If we do a linear regression, we can see that HFA appears to be in decline, but only slightly compared to points per game, which is obviously increasing:

pts hfa [continue reading…]

References

References
1 The HFA number during the playoffs over that same period is 6.5, but that’s probably due to playoff seeding than fan/stadium involvement; it might be interesting to look into this further.
2 As far as what causes home teams to have an advantage at home, Brian Burke suggests in this article that it has more to do with environmental familiarity, and other factors, than the effect of screaming fans.
{ 30 comments }

Resting Starters Database

Adam Steele is back for another guest post. You can view all of Adam’s posts here. As always, we thank him for contributing.


In the same vein as Bryan Frye’s kneel, spike, and first down data and Tom McDermott’s adjusted SRS ratings, I want to contribute some corrections in data distortion. From a stat geek’s perspective, there’s nothing more annoying than strong teams resting their starters in the final week of the season, as it pollutes season long statistics with a game’s worth of junk data. In a 16 game season, even one meaningless outlier can have a big impact on season totals and averages. The most egregious example is the 2004 Eagles, who stormed out to a dominant 13-1 start only to mail in their final two games by a combined score of 58-17. Philly’s season totals look far better (and far more accurate) once those two meaningless games are removed from the sample. I went back to 1993 and noted every game where one team sat their starters and/or played vanilla football with no intention of trying to win. In some instances, a team was clearly going full bore in the first half, then waved the white flag after halftime. In these games, I pulled out the junk data from the second half only.

There are obviously going to be some judgment calls in deciding whether or not a team was really trying to win a given game. For example, this past season’s week 17 matchup between Seattle and Arizona could be viewed two different ways – Arizona was trying to win (at least in the first half) and Seattle just stomped them, or the Cards weren’t really trying even though their starters played the first half. I chose the latter. The one notable game I purposely left out was the week 17 Packers/Lions shootout from 2011. The game was technically meaningless for both teams, and Green Bay kept Rodgers on the bench, but otherwise all the starters played and were clearly playing to win. If the Packers didn’t care, Matt Flynn would not have thrown six TD passes. If you dispute any of the games I’ve listed, I’m happy to discuss and reconsider!

How to read the table: The first five rows are self-explanatory; “Type” designates whether the whole game should be discarded or just the second half; Points, PaTD, and RuTD indicate the points and offensive touchdowns scored during junk time (the stats I believe should be removed from the season data). Defensive numbers can be found by simply looking at the offensive numbers from the team’s opponent.

Team-OppYearWkTypePtsPaTDRuTD
TEN@IND201517Full2412
INDTEN201517Full3020
SEA@ARI201517Full3631
ARISEA201517Full610
WAS@DAL201517Half1010
DALWAS201517Half910
BUF@NE201417Full1711
NEBUF201417Full900
DEN@OAK201317Half300
OAKDEN201317Half1420
BAL@CIN201217Full1702
CINBAL201217Full2310
TB@ATL201117Full2420
ATLTB201117Full4523
OAK@KC201017Full3112
KCOAK201017Full1001
TB@NO201017Half1310
NOTB201017Half600
CIN@NYJ200917Full000
NYJCIN200917Full3704
GB@ARI200917Full3312
ARIGB200917Full710
IND@BUF200917Full701
BUFIND200917Full3030
NYJ@IND200916Half2601
INDNYJ200916Half601
TB@NO200916Half1701
NOTB200916Half000
NE@HOU200917Half1401
HOUNE200917Half2112
NO@CAR200917Full1001
CARNO200917Full2311
ARI@NE200816Full710
NEARI200816Full4732
TEN@IND200817Full000
INDTEN200817Full2310
TEN@IND200717Full1601
INDTEN200717Full1010
SEA@ATL200717Half2421
ATLSEA200717Half2730
IND@SEA200516Full1310
SEAIND200516Full2822
CIN@KC200517Full300
KCCIN200517Full3713
ARI@IND200517Full1310
INDARI200517Full1720
SEA@GB200517Full1711
GBSEA200517Full2311
MIA@NE200517Half1510
NEMIA200517Half1620
PHI@STL200416Full710
STLPHI200416Full2011
ATL@NO200416Full1301
NOATL200416Full2611
ATL@SEA200417Full2620
SEAATL200417Full2822
IND@DEN200417Full1420
DENIND200417Full3321
PIT@BUF200417Full2910
BUFPIT200417Full2402
NYJ@STL200417Full2910
STLNYJ200417Full3231
CIN@PHI200417Full3813
PHICIN200417Full1010
DEN@GB200317Full300
GBDEN200317Full3112
PHI@TB200117Full1720
TBPHI200117Full1301
TEN@PIT199917Half1610
PITTEN199917Half2921
STL@PHI199917Half1420
PHISTL199917Half2110
SF@SEA199717Full900
SEASF199717Full3841
PIT@TEN199717Full600
TENPIT199717Full1601
DEN@SD199617Full1001
SDDEN199617Full1610
SF@MIN199417Full1420
MINSF199417Full2101
DAL@NYG199417Full1001
NYGDAL199417Full1510
PIT@SD199417Half2121
SDPIT199417Half2002
PHI@SF199318Full3730
SFPHI199318Full3422

My plan is to eventually do this all the way back to 1970, then publish the “real” points scored and allowed for each team by prorating the pristine data to a full season.

{ 18 comments }
Next Posts Previous Posts