by Chase Stuart
on March 5, 2014
Terry Bradshaw finished his career with 212 touchdowns, 210 interceptions and a 70.9 passer rating. Kurt Warner threw 208 touchdowns against only 128 interceptions, and his 93.7 passer rating ranks 8th in NFL history and 2nd among retired players. But Bradshaw played from 1970 to 1982, while Warner played from 1998 to 2009. As a result, comparing their raw statistics holds very little meaning. Comparing across eras is very challenging, but not impossible. And in this case, once you place the numbers in the proper context, Bradshaw’s numbers were arguably more impressive than Warner’s numbers.
Let’s start with Bradshaw and begin by looking at his Relative ANY/A for each year of his career. For new readers, ANY/A stands for Adjusted Net Yards per Attempt, defined as
(Gross Pass Yards + 20 * PTDs – 45 * INTs – Sack Yds)/(Attempts + Sacks)
Relative ANY/A simply compares a quarterback’s ANY/A average to league average, a necessary element when comparing quarterbacks across eras. In the graph below, the size of the bubble corresponds to how many attempts Bradshaw had in each season, while the Y-Axis shows Bradshaw’s Relative ANY/A (by definition, 0 is equal to league average). The graph shows a clear story: for the first five years of his career, Bradshaw was a below-average quarterback, but over the rest of his career, he was one of the best in football. His best year came in 1978 when Bradshaw finished with a RANY/A of +2.0, which was the third best mark in football (only a hair behind Roger Staubach and Dan Fouts). Those stats, combined with a 14-2 record, led to Bradshaw being named the AP’s MVP that season. [continue reading…]
Tagged as:
Kurt Warner,
Terry Bradshaw
{ }
by Chase Stuart
on January 20, 2014

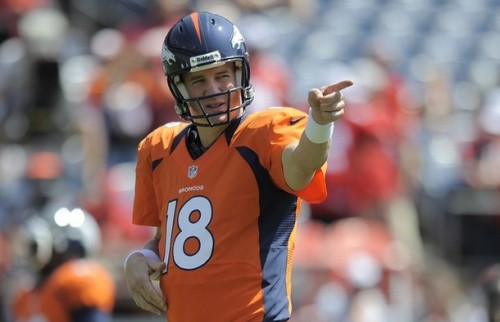
No, Peyton, you're the man.
In 1984,
Dan Marino set an NFL record with 48 touchdown passes, but his Dolphins lost in the Super Bowl. Twenty years later,
Peyton Manning broke Marino’s record, but he lost to the eventual Super Bowl champion Patriots in the playoffs. In 2007,
Tom Brady broke Manning’s touchdowns record, but
he lost in the Super Bowl, too.
When the greatest quarterback seasons of all time are discussed, these three years dominate the discussion. And with good reason. But if you include the playoffs — and frankly, there’s no reason not to include the playoffs — which quarterback produced the greatest season of all time? I’m going to stipulate that the greatest quarterback season ever has to end in a Lombardi Trophy, because otherwise, I think we’ll end up back in the world of Marino ’84/Brady ’07/Manning ’04. Of course, now another Manning season has entered the mix: and with a Super Bowl win, Manning’s 2013 should and would be remembered as the greatest quarterback season of all time.
So, the question becomes, which season would he knock off the top rung? I think there are six seasons that stand out from the rest, based on regular and postseason performance.
Honorable Mention [continue reading…]
Tagged as:
Dan Marino,
Joe Montana,
Kurt Warner,
Peyton Manning,
RANY/A,
Steve Young,
Tom Brady
{ }
by Chase Stuart
on September 16, 2013

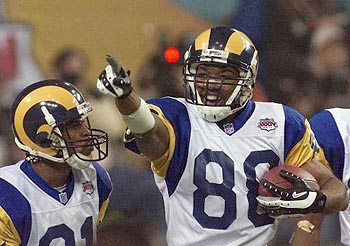
The GSOT.
On its own, this
week five game against San Francisco doesn’t stand out as anything special. The 0-4 Rams were traveling to San Francisco with
Jamie Martin at quarterback, who led the team to just 10 points the previous week in Dallas after
Kurt Warner broke his
pinky finger. The 49ers were coming off of a bye week, and would send
Jeff Garcia and
Terrell Owens to the Pro Bowl, while
Garrison Hearst and
Kevan Barlow led a top-six ground game. San Francisco should have, and did, win convincingly.
The reason that’s a notable game is precisely because the 49ers were six-point favorites. That marked the first time since week 2, 1999 — when the Rams had not yet been recognized as the Greatest Show on Turf — that St. Louis was not favored to win a game. For the final 14 regular season games and the three playoff games in 1999, all seventeen games in 2000, all 19 games in 2001, and the first four games in 2002 — a stretch of 57 straight games — the Rams took the field as favorites. That’s the longest streak since 1978, and perhaps ever. And I’m not sure if this makes that fact more of less impressive, but all things considered, the Rams’ record wasn’t that great during the stretch. Part of the reason for the streak was that St. Louis generally had a weak schedule those years, but continually being favored to win games without a great record is an interesting (and rare) sign of respect.
[continue reading…]
Tagged as:
Isaac Bruce,
Jerry Rice,
Joe Montana,
Kurt Warner,
Steve Young,
Torry Holt
{ }
by Chase Stuart
on September 24, 2012

The closest I'm willing to get with a baseball photo.
I leave the baseball analysis to my brothers at
baseball-reference.com, but I know enough to be dangerous. There’s a stat called BABIP, which stands for Batting Average on Balls In Play. A “ball in play” is simply any at bat that doesn’t end in a home run or a strikeout. The thinking goes that luck and randomness is mostly responsible for the variance in BABIP allowed by pitchers to opposing batters. Pitchers can control the number of strikeouts they throw and control whether they allow home runs or not, but they can’t really control their BABIP.
Therefore, if a pitcher has a high BABIP, sort of like an NFL team with a lot of turnovers, he’s probably been unlucky. And good things may be coming around the corner. A high BABIP means a pitcher probably has an ERA higher than he “should” and that his ERA will go down in the future. In fact, you can easily recalculate a pitcher’s ERA by replacing the actual BABIP he has allowed with the league average BABIP. And that ERA will be a better predictor of future ERA than the actual ERA. At least, I think. Forgive me if my baseball analysis is not perfect.
Are you still awake? It’s Monday, and I’ve brought not only baseball into the equation, but obscure baseball statistics. Let’s get to the point of the post by starting with a hypothesis:
Assume that it is within a quarterback’s control as to whether he throws a completed pass on any given pass attempt. However, if he throws an incomplete pass, then he has no control over whether or not that pass is intercepted.
[continue reading…]
Tagged as:
Brett Favre,
Donovan McNabb,
Interceptions,
Kurt Warner
{ }
by Chase Stuart
on August 31, 2012

The original standard for postseason success.
On Wednesday, I explained the
methodology for grading each quarterback in each season. Yesterday, I came up with an
all-time career list of the best quarterbacks based on their regular season play. Today, a look at playoff performances.
Using the same formula, we can grade each quarterback in each game and adjust for era . However, it should be obvious that the sample sizes here are incredibly small, and the stats are even less likely to tell the true story when looking at just one game. Strength of schedule becomes a significant factor here, as well. But, caveats aside, there’s a lot we can do with playoff data. For example, we can rank every quarterback performance in Super Bowl history:
If you type Montana’s name into the search box, you can see that he has the 1st, 4th, 11th and 27th best performance in Super Bowl history. The best performance in a losing effort goes to
Jake Delhomme, who shredded the Patriots secondary in the second half of Super Bowl XXXVIII (he began the game 1 for 9 for 1 yard). The worst performance in a winning effort, unsurprisingly, goes to
Ben Roethlisberger in Super Bowl XL, although
Joe Theismann against the Dolphins gets an honorable mention. Worst performance overall goes to
Kerry Collins, although
Craig Morton’s 4 interceptions and 39 yards on 15 attempts against his former team in Super Bowl XII could give Collins a run for his money.
What about best championship game performances in the pre-Super Bowl era?
[continue reading…]
Tagged as:
GQBOAT,
Joe Montana,
Kurt Warner,
Peyton Manning,
Playoffs,
Tom Brady
{ }