≡ Menu

#NFL100 – Top 12 Running Backs

As you probably know, the NFL is announcing its top 100 players in league history as part of its 100-year anniversary. The nominating committee selected 24 running backs as finalists, and with the exception of active RB Adrian Peterson, every player is in the Hall of Fame. For the final team, 12 running backs were chosen. The table below shows the finalists and those selected for the official team:

PlayerTeamsFirst YrLast YrSelected?
Dutch ClarkPortsmouth Spartans/Detroit Lions19311938Selected
Steve Van BurenPhiladelphia Eagles19441951Selected
Marion MotleyCleveland Browns; Pittsburgh Steelers19461955Selected
Jim BrownCleveland Browns19571965Selected
Lenny MooreBaltimore Colts19561967Selected
Gale SayersChicago Bears19651971Selected
O.J. SimpsonBuffalo Bills; San Francisco 49ers19691979Selected
Walter PaytonChicago Bears19751987Selected
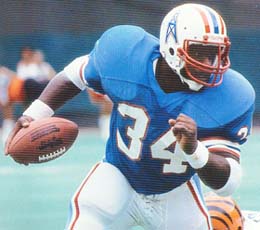
Earl CampbellHouston Oilers; New Orleans Saints19781985Selected
Eric DickersonLos Angeles Rams; Indianapolis Colts; Los Angeles Raiders; Atlanta Falcons19831993Selected
Barry SandersDetroit Lions19891998Selected
Emmitt SmithDallas Cowboys; Arizona Cardinals19902004Selected
Marcus AllenLos Angeles Raiders; Kansas City Chiefs19821997Finalist
Jerome BettisLos Angeles/St. Louis Rams; Pittsburgh Steelers19932005Finalist
Tony DorsettDallas Cowboys; Denver Broncos19771988Finalist
Marshall FaulkIndianapolis Colts; St. Louis Rams19942005Finalist
Red GrangeChicago Bears; New York Yankees19251934Finalist
Franco HarrisPittsburgh Steelers; Seattle Seahawks19721984Finalist
Hugh McElhennySan Francisco 49ers; Minnesota Vikings; New York Giants; Detroit Lions19521964Finalist
Bronko NagurskiChicago Bears19301943Finalist
Adrian PetersonMinnesota Vikings; New Orleans Saints; Arizona Cardinals; Washington Redskins20072019Finalist
Jim TaylorGreen Bay Packers; New Orleans Saints19581967Finalist
Thurman ThomasBuffalo Bills; Miami Dolphins19882000Finalist
LaDainian TomlinsonSan Diego Chargers; New York Jets20012011Finalist

[continue reading…]

{ 0 comments }

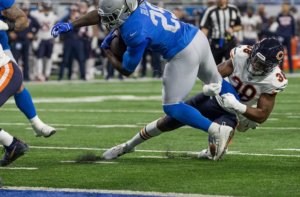
Blount getting tackled, per usual

On Wednesday, I looked at all running backs with at least 100 carries. Then, for those running backs who averaged over 4.41 yards per carry (the average YPC for that group), I asked the question: how many of the best rushes would you need to discard for each running back to have an average (or worse) YPC average?

The answer was not many. For Todd Gurley and Gus Edwards, who led the league in this metric, the answer was just 6 runs. Taking away Gurley’s 6 best carries dropped his YPC average to 4.34; taking away his 5 best would have dropped his YPC to “only” 4.43, so you need to take away his best 6 carries to get him to average or below.

But what about the reverse? If we look at all running backs with at least 100 carries who averaged fewer than 4.41 yards per carry, how many of their worst rushes would you need to discard to get that running back to average or better?

The leader in this category is LeGarrette Blount, and it wasn’t particularly close. In 2018, the Lions running back rushed 154 times for just 418 yards, an abysmal 2.71 YPC average. [continue reading…]

{ 0 comments }

Running Back Heat Maps – 2018 Season

Regular readers are familiar with my running back heat maps, but let’s use Ezekiel Elliott and Saquon Barkley as examples.

Last season, Elliott and Barkley finished first and second in rushing yards and rushing attempts. Elliott averaged a very strong 4.73 yards per carry, but Barkley had a sparkling 5.01 YPC average. However, there is more than meets the eye.

Elliott rushed for positive yards on 83% of his carries; that’s pretty good, because the average among all running backs with at least 100 carries was 81%. Meanwhile, Barkley rushed for positive yards on only 77% of his carries. Elliott rushed for at least 2 yards on 71% of his carries; Barkley did it on just 61% of his carries. Gaining at least 3 yards? Elliott did that 55% of the time, while Barkley did it just 48% of the time. This trend holds true for awhile: Elliott picked up at least 4, 5, and 6 yards on 45%, 35%, and 29% of his carries; for Barkley, those rates were 38%, 30%, and 25%, respectively.

At least 7 yards? Elliott did that on 24% of his carries, while Barkley only rushed for 7+ yards 18% of the time. It gets a little closer at 8 and 9 yards, but Elliott still wins, 18% to 16% and 16% to 15%.

How about at least 10 yards? The Cowboys star gained 10 or more yards on 13% of his rushes; Barkley did it on 12% of his carries. How about 15+ yards? Elliott hit that mark on 8.2% of his carries, while the Giants start did it on 7.7% of his rushes. So how in the world did Barkley finish the season with a higher yards per carry average? Because Elliott rushed for 20+ yards on just 4% of his carries, while Barkley did it on 6% of his carries. More importantly, Elliott’s longest run was 41 yards, while Barkley had runs of 46, 50, 51, 52, 68, 68, and 78. That’s how, despite Elliott pretty much “winning” at each distance, he lost the YPC battle. Even if Elliott had big runs more often, Barkley’s big runs were really big runs. [continue reading…]

{ 0 comments }

The 2017 Cleveland Browns went 0-16, a season the franchise would like to forget. The team’s best offensive player was running back Isaiah Crowell, who shouldered a very large percentage of the team’s rushing workload – at least among running backs. Quarterback DeShone Kizer finished second on the team in rushing yards, while backup running back Duke Johnson was the team’s leader in targets, receptions, and receiving yards — and it wasn’t particularly close.

One thing that was notable about Crowell’s season: among Browns running backs, Crowell was the leader in rushing yards in all 16 games. Four other teams had one player lead the team’s running backs in rushing in 15 of 16 games: the Rams with Todd Gurley, the Steelers with Le’Veon Bell, the Chiefs with Kareem Hunt, and the Colts with Frank Gore.  Los Angeles, Pittsburgh, and Kansas City all made the players and rested starters in week 17; Gurley, Bell, and Hunt led their teams in rushing in each of the first 15 team games of the season.  As for Indianapolis, Gore led the team in rushing each week with one notable exception: against the 49ers, Marlon Mack rushed 9 times for 91 yards, while Gore had 14 carries for only 48 yards against his former team.  Save that for the revenge game narrative.

We talk a lot about how running back by committee is retaking the league after the stud running back era of the mid-’00s.  Last year, for 15 of the league’s 32 teams, one running back led the team in rushing in 75% of their team’s games.  I’m not quite sure whether this is the best or even the right way to measure RBBC, but I do think it’s a useful balancing act against other, typical measures.

The table below shows, for each team, how many games one RB led all team running backs in rushing: [continue reading…]

{ 0 comments }

Yards per Carry: RB1 vs. RB2

Regular readers know that I’m not a huge fan of yards per carry as a metric to evaluate running backs, or even rushing attacks. Given the limited numbers of metrics available, sometimes it is a useful measure, but we also much caution ourselves against relying on it too often. Today’s post is another example of that.

I looked at all rushing attacks since 2002, and calculated the yards per carry gained by each team’s top running back and second running back (excluding pure fullbacks and situations where the second running back had fewer than 50 carries), as measured by carries. If yards per carry was the best way to evaluate running backs, and coaches wanted to play their best players most frequently (and, of course, coaches were able to identify their best players), then RB1s should be better at RB2s at yards per carry.

Last year, Bears rookie Jordan Howard averaged 5.2 yards per carry on 252 carries, while backup Jeremy Langford (who actually opened the season as the starter) gained just 3.2 yards per carry on 62 carries.  That’s a piece of evidence that YPC is useful: Howard was much better than Langford at YPC, and he gained way more carries.  But that +2.0 discrepancy was the largest in football last year: this is an outlier, not a typical example.

How about an outlier in the other direction? The Jets top running back last year was Matt Forte, who started 13 games and handled 218 carries; he averaged 3.7 yards per rush. Meanwhile, backup Bilal Powell averaged 5.5 yards per carry on 131 carries.  This might mean that Powell is better than Forte, but at least last year, the Jets didn’t seem to think so — or maybe thought so too late.

These are two interesting examples because they show some of the drawbacks to actually trying to properly analyze the issue.  Howard was the backup, but because he was so much better than Langford, he gets graded as Chicago’s top running back.  This biases the study in favor of RB1s: if a running back is producing at a high rate, even if he’s the backup, he may wind up leading his team in rushes that year (thanks to earning more carries in the second half of the season), which means RB1s in generally will appear to have higher yards per carry than RB2s.  In that way, it becomes a self-fulfilling prophecy.

On the other hand, look at the Jets example.  I think we would all agree that Powell was the Jets best running back last season. He actually finished with more yards from scrimmage than Forte (thanks to playing in two more games), and nearly outrushed him, too. Forte was the (moderately) high priced veteran free agent signing, while Powell was intended to be the backup. By the end of the year, it was clear Powell was the Jets best running back (if not best player), but he didn’t have enough carries to overtake Forte for RB1 status. So in some ways, this study may not properly identify a team’s true top running back and backup running back, if we only classify those players by carries.

So there is some issues with this on a case-by-case basis.  That’s why the best thing to do is to aggregate the data.  The graph below shows the average yards per rush gained by the average team’s RB1 and average team’s RB2 in each year since 2002: [continue reading…]

{ 15 comments }

Three years ago, I looked at the single-season leaders in percentage of team rushing yards. Then and now, the top two seasons belonged to Edgerrin James: he had 94% and 92% of the Colts rushing yards in his first two seasons in the league. There were only three other seasons where a running back had at least 90% of his team’s rushing yards: Emmitt Smith in 1991, Barry Sanders in 1994, and … Travis Henry in 2002. In that post, I calculated for each team the percentage of his team rushing yards gained by that team’s top rusher. Then I calculated the league average percentage gained by each team’s top rusher, and plotted how that varied over time. This was intended to measure how running back back committee centric the league was in each year.

For a less rigorous method to measure RBBC-ness, you can see this post, which looked at games with more than 15 carries.

Both methods show RBBC being heavy in the ’70s, and the stud RB era peaking about 10 years ago.  But if you want to measure rushing concentration, a better method is probably to use the formula described yesterday. So for each team, I calculated the percentage of team rushing yards gained by every player on the team, squared that result, and then summed those numbers for each player on the team. You can read yesterday’s post for more info on the methodology, but here were the results for 2016: [continue reading…]

{ 9 comments }

The fantasy GOAT

The fantasy GOAT

Yesterday, we looked at the most dominant quarterbacks in fantasy history. Today, the running backs, using the methodology described yesterday. Let’s look at the three best seasons in fantasy history, since all shed light on the formula here. Those three are LaDainian Tomlinson, 2006, which is easy to argue as the best year ever as Tomlinson shattered the record for fantasy points scored. But O.J. Simpson in 1975 (not ’73) was also dominant, and did so in a 14-game season and when the baseline was lower. The darkhorse candidate is Priest Holmes, 2002, who put up insane numbers but missed two games due to injury.

I am using the following scoring system throughout this series: 1 point per 20 yards passing, 1 point per 10 yards rushing/receiving, 4 points per passing TD, 6 points per rushing/receiving TD, 0.5 points per reception.

In 2006, Tomlinson rushed for 1,815 yards with 28 TDs, caught 56 passes for 508 yards and 3 touchdowns, and even threw for 20 yards and two touchdowns. He totaled a still mind-boggling 455.3 fantasy points. On a per game basis, Tomlinson averaged 28.46 FP/G, while the baseline — which for these purposes is RB24 [1]Baselines used in this series: From 1968 to 2014, RB24. In ’66 and ’67, RB20, and from ’61 to ’65, RB16. In the 1960 AFL, the baseline is RB6, while it is RB8 in the NFL. From … Continue reading — was at 10.75 FP/G. Therefore, Tomlinson averaged 17.71 FP/G over the baseline, and he did it for 16 games, giving him a VBD of 283.3 fantasy points (17.71 x 16). [continue reading…]

References

References
1 Baselines used in this series: From 1968 to 2014, RB24. In ’66 and ’67, RB20, and from ’61 to ’65, RB16. In the 1960 AFL, the baseline is RB6, while it is RB8 in the NFL. From 1950 to 1959, the baseline used is RB8.
{ 27 comments }

Was Walter Payton the biggest workhorse in NFL history? In 1977, he gained 43.5% of Chicago’s total offensive yards. The next year, it was 39.5%, and the year after that, it was 39.1%. Payton also was responsible for 37.8% of the Bears output in ’76, 36.2% of the team’s yards in ’84, and 35.8% of Chicago’s offense in 1980.

But wait, there’s more! In ’82 and ’85, Payton was responsible for 33.1% and 33.5% of his team’s offense, and in ’81 and ’83, it was 32.7% and 32.8%. For ten seasons, Payton was responsible for at least thirty-three percent of his team’s offense! And in 1986, he gained 30.6% of all Chicago yards.

Yesterday, we looked at the single-season leaders in percentage of team yards. Today, the career list, using a 100-95-90 weighting method. What’s that? To avoid giving too much credit to compilers, I did not assign full credit to each season, and instead used the following methodology:

1) Calculate the total yards from scrimmage by each player in each season since 1932.

2) Calculate the total team yards (excluding sacks) by that player’s team. Players who played for multiple teams in a season were therefore prejudiced by this methodology.

3) Calculated the percentage of team yards gained by each player in each season since 1932. This was the basis of yesterday’s post.

4) Order each player’s career from best season (per step 3) to worst.

5) Give each player 100% credit during his best season, 95% credit during his second best season, 90% during his third best, and so on. So for Payton, we give him 100% of 43.5%, 95% of 39.5%, 90% of 39.1%, 85% of 37.8%, and so on.

6) Sum the values in step 5 for each player for each season to get a career grade.

That career grade doesn’t mean much in the abstract — Payton’s grade is 318% — but when we order the list, it does provide some limited insight as to which players have been the biggest workhorses in NFL history. This is far from a perfect formula, but I do think it’s interesting. Note that I also performed the same analysis using a 100-90-80 method — to give even less value to compilers — and not a single player moved up or down in the top 15. The table below shows the top 150 players by this metric: [continue reading…]

{ 25 comments }

Running Backs are More Desirable than Kickers

These guys like running backs

These guys like running backs

This time last year, the media chorus was signing that the running back position had been severely devalued in the modern NFL. Part of that, no doubt, was true: it is undeniable that less draft capital is being spent on running backs.

When I wrote about the 2014 Running Back Free Agent Market last year and how little they were being paid, I made sure to link to a pretty key point made by Jason Lisk at the Big Lead: the free agent class just wasn’t very good. Last year, the top free agent running backs were Toby Gerhart ($4.5M guaranteed, $7M over the first two years of his contract), Donald Brown ($4, $7), Rashad Jennings ($2.98, $5.25), Maurice Jones-Drew ($1.2, $5.0), Ben Tate ($2.5, $4.35), and Knowshon Moreno ($1.25, $4.25).

In case you forgot, here’s a quick summary of how those backs fared last year:

  • Gerhart averaged 3.2 yards per carry over 101 carries and was benched;
  • Brown averaged 2.6 YPC over 85 carries and was benched;
  • Jennings rushed for 639 yards in 11 games, missing 5 due to injury;
  • Jones-Drew averaged 2.2 YPC over 43 carries and is now retired;
  • Tate was cut after 106 carries and 8 games;and
  • Moreno was limited to 3 games due to injury.

This was an underwhelming class of free agent running backs that somehow fell far, far short of expectations.  Then, Chris Johnson joined the class, and signed a two-year, $8M contract with $4M guaranteed.  The Jets cut him after one season, where he gained 814 yards from scrimmage and scored two touchdowns in 16 games. [continue reading…]

{ 3 comments }

Greatest RB of All Time: Wisdom of Crowds Edition

Two weeks ago, Adam Steele administer a Wisdom of Crowds edition of the GQBOAT debate. Today, Adam has offered to run the same experiment but for running backs.  And we again thank him for that.


Who is the Greatest Running Back of All Time? In recent years, the practice of crowd sourcing has gained momentum in the analytics community, in some cases yielding more accurate results than mathematical models or expert opinions. For the initiated, here’s the gist: Every human being represents a data point of unique information, as all of us have a different array of knowledge and perspective about the world. Therefore, when you aggregate the observations of a group of people, they will collectively possess a greater and more diverse reservoir of knowledge than any single member of the group.

The readers of Football Perspective are an insightful bunch with areas of expertise spanning the entire football spectrum; we are the perfect group for crowd-sourcing these sorts of age-old football questions. And given how successful the last experiment was, there’s no reason not to look at other positions. If you’d like to participate in this experiment, there are just a few guidelines to follow:

1. Create a list of the top 20 running backs of all time, in order, using any criteria you believe to be important. I encourage readers to be bold in your selections – don’t worry about what others may think.

2. Commentary is not necessary, but most definitely welcome. In particular, I’d enjoy seeing a short blurb explaining the criteria you based your selections on.

3. Please compile your rankings BEFORE reading anyone else’s. Crowdsourcing works best when each source is as independent as possible.

4. Please DO NOT use multiple screen names to vote more than once.

The deadline to cast your ballot is midnight on Thursday the 26th, then analyze the results in a follow-up article. A first place vote is worth 20 points, second place 19 points, and so on. Let the process begin!

{ 154 comments }

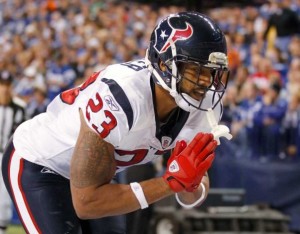
Foster is thankful for a heavy workload.

Foster is thankful for a heavy workload.

Running back workload is a very difficult topic to tackle, and I don’t expect to make much of an indent into the subject today. But I do want to take a few minutes and look at some ways to measure heavy workloads. One school of thought is that the effect of carries is cumulative: Not only is a 25-carry game more likely to cause a running back trouble than a five-carry game, but it’s more than five times as likely to shorten a player’s shelf life. The cumulative effect of taking hit after hit means that carries 16, 17, and 18 hurt a runner more than carries 1, 2, and 3.

I don’t know if that’s true, but let’s investigate. First, I’m only giving a running back credit for his additional carries after his 15th carry of the game. So an 18-carry game goes down as a “3” and a 25 carry game is a “10.” Using this scoring system, Arian Foster had the highest number of “Carries over 15” from last season, with 117. Such a list mostly corresponds to the number of overall rushing attempts for a player, but the exceptions could be revealing.
[continue reading…]

{ 4 comments }

In the pre-season, I wrote three pieces on Cleveland Browns rookie Trent Richardson.  As part of a thought experiment, I wondered who would lead the NFL in rushing yards from 2012 to 2021? I narrowed my finalists to LeSean McCoy, Beanie Wells (was I drunk?), DeMarco Murray (ouch), Richardson and the rest of the rookies, and then a few college running backs. I concluded that Richardson was the obvious frontrunner, with McCoy, Doug Martin, and Marcus Lattimore (double ouch) as the next best bets. I’m not really sure 2012 helped clarify the issue, although Martin and Alfred Morris certainly raised their chances.

Then in August, I looked at the production of the highest drafted running back in each draft class.  I discovered that slightly fewer than half of the highest drafted running backs led their class [1]Note that this only includes drafted running backs. in rushing yards as a rookie; as you can see, “the field” also turned out to be a better bet than Richardson in 2012:

RkPlayerYearDraftTmGAttYdsY/ATDY/G
1Alfred Morris20126-173WAS1633516134.8113100.8
2Doug Martin20121-31TAM1631914544.561190.9
3Trent Richardson20121-3CLE152679503.561163.3
4Vick Ballard20125-170IND162118143.86250.9
5Bryce Brown20127-229PHI161155644.9435.3
6Bernard Pierce20123-84BAL161085324.93133.3
7Daryl Richardson20127-252STL16984754.85029.7
8David Wilson20121-32NYG16713585.04422.4
9Robert Turbin20124-106SEA16803544.43022.1
10Ronnie Hillman20123-67DEN14843273.89123.4
11Brandon Bolden2012udfaNWE10562744.89227.4
12Lamar Miller20124-97MIA13512504.9119.2
13LaMichael James20122-61SFO4271254.63031.3
14Chris Rainey20125-159PIT16261023.9226.4
15Jeremy Stewart2012udfaOAK4251014.04025.3

In that post, I also noted that the running back drafted first in his class was slightly less successful over the course of his career: only one-third of the highest-drafted running backs finished with the most career rushing yards in their class.

The final post on the topic ended up being more relevant to Alfred Morris than Richardson. In August, I compared how the top rookie running back performed over the rest of his career relative to the other members of his class. From 1992 to 2002, 10 of the 11 backs to lead their class in rushing yards as rookies ended up finishing with the most career rushing yards. But in recent years, that trend has reversed itself: the odds are long that Ben Tate (2011), LeGarrette Blount (2010), Knowshon Moreno (2009 and competing with Arian Foster and LeSean McCoy), or Steve Slaton (2008) will also finish with the best careers from their class.

So where do we stand on Richardson and Morris? A year later, how much credit do we give Richardson for having been the #3 pick in the draft? For Morris, how much do we downgrade him for being a 6th round pick? And how does the presence of Robert Griffin III complicate things?
[continue reading…]

References

References
1 Note that this only includes drafted running backs.
{ 10 comments }

www.notacompiler.com.

Career statistics can be very misleading, since a player can hang around for a bunch of meaningless years but really pad his totals. Six years ago, Doug came up with a system that only counted the receiving yards a player recorded after his first 1,000 receiving yards each season.

I’m going to do something similar for running backs, but instead will focus on individual game performances. I have game logs for every running back (post-season included) for every game since 1960. What I did was zero out all rushing yards in games where a player had 50 or fewer rushing yards; in the remaining games, I only gave those runners credit for the rushing yards they gained after their first 50 rushing yards. The “RYov50” column shows the running back’s career rushing yards after removing the first 50 rushing yards he had in every game; the next column shows each player’s career rushing yards (since 1960, including post-season), and the first “Perc%” column shows the ratio of the “RYov50” column to the career rushing yards. A higher percentage means the player spent most of his time as the lead back for his team, while a lower percentage indicates that the player spent significant time in a committee and/or stuck around for several years past his prime. Obviously for still active players, the percentage column could be misleading as they may not have entered the decline portion of their careers just yet.

The #50YG column shows how many games the player had over 50 rushing yards, and the next column shows what percentage of games the running back gained over 50 yards. For players like Jim Brown, this study only includes his seasons starting in 1960, and for active players, 2012 data is *not* included:
[continue reading…]

{ 11 comments }