≡ Menu

The 2017 Draft replenished the Saints roster.  New Orleans roster drafted CB Marshon Lattimore with the 11th overall pick, OT Ryan Ramczyk with the 32nd pick, S Marcus Williams with the 42nd pick, Alvin Kamara with the 67th pick.  Those four players have been incredible additions for the team: Kamara and Ramczyk are two of the four Saints with 15+ points of AV in 2018, while the two defensive backs each started 16 games.  In addition, LB Alex Anzalone — taken with the 76th pick — started 7 games this year.

In the 2017 offseason, the Saints also signed ex-Lions guard Larry Warford, ex-Panthers linebacker A.J. Klein, and ex-Cardinals pass rusher Alex Okafor. Those three players were all regular starters on the 2018 Saints.  In fact, 7 of the 16 Saints players with 6+ points of AV this year were added in 2017.   The Saints, in some ways like the Patriots, are here because of their famous quarterback/head coach combo.  Sean Payton and Drew Brees both came to New Orleans in 2006, but the Saints had just completed back-to-back-to-back 7-9 seasons at the end of the 2016 season.  From 2014 to 2016, New Orleans had been outscored by 76 points.  As good as Brees and Payton are, they wouldn’t be here today without what happened in the spring of 2017.

The graph below shows the AV on the 2018 Saints from players drafted by New Orleans (in gold) and drafted or otherwise acquired by New Orleans (in black) from each year since 2006.

Last year, New Orleans nearly made it this far on the backs of those seven players, Brees and Payton, too. It’s been a remarkable two-year run for the Saints, and a reminder that in one offseason, any team can turn it around (and that goes double if you have a Hall of Fame quarterback).

{ 1 comment }

Brad Oremland is a longtime commenter and a fellow football historian. Brad is also a senior NFL writer at Sports Central. There are few who have given as much thought to the history of quarterbacks and quarterback ranking systems as Brad has over the years. What follows is Brad’s latest work on quarterback statistical production.


Brees threw a lot in garbage time

What I thought was an off-hand musing about Drew Brees’ production in low-leverage situations (for my ongoing series about the greatest statistical QBs in history) sparked a surprisingly contentious debate about whether Brees had padded his stats in garbage time.

I tried to align this with a very conservative definition of “garbage time” … all data are from 2004-17 — 2004 was Brees’ first good season — and none of the game/score situations below produced any wins by any team during those years. “P/B/R” indicates the combined total of Peyton Manning, Tom Brady, and Aaron Rodgers.

Please pardon the informal prose and formatting; this was originally composed as a comment, not an article. [continue reading…]

{ 1 comment }

As a rookie, New Orleans running back Alvin Kamara averaged a whopping 6.07 yards per carry, leading the league in that metric by just about any measure. But given the large amount of regression to the mean involved in yards per carry, what would be a reasonable projection for Kamara in 2018?

I looked at the top 50 players in yards per carry from 1960 to 2016, among players who had (1) between 75 and 175 carries and (2) had fewer than 15 pass attempts. There were 13 players who averaged more than Kamara’s 6.07 YPC average (based on 120 carries for 728 yards), and the group as a whole averaged 110 carries for 641 yards, a 5.85 YPC average. So this group was slightly less effective than Kamara. The next year? They averaged 115.3 carries for just 503.8 yards, a 4.37 yards per carry average. That’s a drop of 25%; if Kamara had a similar drop, he would be at 4.53 YPC next season.

The table below shows those 50 players plus Kamara, and how they fared the next season: [continue reading…]

{ 0 comments }

Only two teammates have ever won the AP Offensive Rookie of the Year and AP Defensive Rookie of the Year awards. That happened 50 years ago in 1967, when the Detroit selected RB Mel Farr with the 7th pick in the first round of the draft and future HOF CB Lem Barney with the 34th overall pick in the second round. As a rookie, Farr gained 1,177 yards from scrimmage in 13 games, 7th most in the NFL. Barney, meanwhile, led the NFL in interceptions, interception return yards, and interception return touchdowns, with a 10-232-3 stat line. Both made the Pro Bowl, and Barney was a 2nd-team All-Pro choice by both the NEA and NYDN.

This year’s Saints have a similar story. New Orleans went cornerback first and running back second, drafting RB Alvin Kamara with the 67th pick (3rd pick in the 3rd round) and CB Marshon Lattimore with the 11th overall selection (Utah S Marcus Williams was the second round pick). Kamara has been remarkable with 1,426 yards from scrimmage (8th in the NFL) and 12 touchdowns (tied for 3rd) in 15 games, while averaging a remarkable 6.2 yards per carry and 9.9 yards per reception. Either Kamara or Kareem Hunt will win the AP OROY award this year. Meanwhile, Lattimore has been a huge part of the Saints defensive revival: he’s a frontrunner for the AP DROY award, and is tied for 5th in the league with five interceptions, including one returned for a touchdown.

The final AV numbers from Pro-Football-Reference aren’t in yet, but since the Saints offensive and defensive numbers are both outstanding this year, and both Kamara and Lattimore made the Pro Bowl, I think it’s safe to assume that both will have at least 10 points of AV. [continue reading…]

{ 1 comment }

There have been many great running back pairs in NFL history. The standard bearers when it comes to running back pairs both played in NFL at the time the AFL was born: Jim Brown and Bobby Mitchell in Cleveland, and Paul Hornung and Jim Taylor in Green Bay. Any great running back pair needs more than one season, but when it comes to just one year of dominance — since the AFL/NFL merger — I am not sure if any pair can top what Mark Ingram and Alvin Kamara of the Saints have done this year.

Kamara is currently 4th among running backs in fantasy points using 0.5 points per reception (the middle ground between PPR and non-PPR leagues) with 252.1 fantasy points.  Meanwhile, Ingram is just behind him in 5th place with 247.6 fantasy points (awarding 1 point for every 10 yards rushing or receiving and 6 points for every touchdown).  Todd Gurley, Le’Veon Bell, and Kareem Hunt are your top three running backs with 355.3, 303.1, and 261.2 fantasy points, respectively, and then Melvin Gordon (243.7) and LeSean McCoy (231.9) are the only other running backs with over 200 fantasy points.

So no matter what Kamara and Ingram do this weekend (and the Saints are playing for the NFC South title this weekend, so the incentive is there for them to do well), they will both finish in the top 7 among all running backs. And guess what: that has never happened since the AFL-NFL merger.

In fact, just 8 times has a team had two top-10 running backs over this time.  In reverse chronological order…. [continue reading…]

{ 7 comments }

Over the first two weeks of the season, the Saints had the worst pass defense in the NFL. New Orleans was torched by Sam Bradford and then Tom Brady — which admittedly looks less embarrassing in hindsight — as those two quarterbacks produced arguably the best two performances of the NFL those weeks.

Since then? New Orleans has had the best pass defense in the NFL by a considerable margin. The table below shows passing stats for each defense from weeks 3 through 10. Here’s how to read the Saints line. New Orleans has the best pass defense over that time period, and has won 100% of the team’s games. Opponents have completed only 121 of 226 pass attempts for a 53.5% completion rate, and are averaging only 9.8 yards per completion. The Saints have allowed just 1,036 passing yards (this is net of sacks), 5 TDs, and 10 INTs, while producing 22 sacks. Opponents have a 57.4 passer rating and have thrown for just 54 first downs. Finally, opponents are averaging just 2.77 ANY/A, and 4.54 Adj YPA (which includes a bonus for first downs), and have allowed a whopping 1,005 fewer adjusted yards than average, easily the best in the league. [continue reading…]

{ 5 comments }

Drew Brees and Spreading It Around

In 2016, Odell Beckham gained 34% of all Giants receiving yards, the highest share in the NFL. For 31 of 32 teams, at least one player gained 20% of their team’s receiving yards, but for the Bills, Robert Woods led the team in receiving despite being responsible for only 19% of Buffalo’s receiving yards.

But since Drew Brees came to the Saints in 2006, no team has spread it around more than New Orleans. On average, Brees’ leading receiving has been responsible for only 22% of the Saints receiving yards each year. The table below shows the average percentage of team receiving yards gained by the top receiver (RB, WR, or TE) for each team in each season over the last 11 years. The Falcons, buoyed by long runs of success by Roddy White and then Julio Jones, have been the most WR1-heavy passing game, while the Saints have been the most diverse: [continue reading…]

{ 14 comments }

Saints wide receiver Michael Thomas is in about as good a situation as it gets. Here’s what he has in his favor:

  • The Saints pass the ball a ton. The last three years, New Orleans ranked 2nd each season in pass attempts, finishing 2 attempts behind the Colts in 2014, 9 attempts behind the Ravens in 2015, and 5 attempts behind the Ravens last year. The Saints have an even 2,000 attempts over the last three seasons, the Ravens are 2nd with 1,909, and the Colts are 3rd with 1,864. It’s true that New Orleans did just add Adrian Peterson, but the Saints are well-established as the league’s preeminent pass-heavy team.
  • Thomas, unlike players on the Ravens, gets to play with a superstar quarterback in Drew Brees. Because more important than the 2,000 attempts is that New Orleans has thrown for 14,808 gross passing yards the last 3 years, more than 1,000 yards more than anyone else. Only the Falcons, Steelers, and Patriots have even 13,000 passing yards.
  • As a rookie, Thomas and Brandin Cooks were essentially WR1A and WR1B in New Orleans. Cooks had 117 targets, 1,173 receiving yards, and 8 TDs in 16 games, while Thomas had 121 targets, 1,137 yards, and 9 TDs despite missing one game. But here’s where it gets exciting for Thomas: Cooks was traded in the offseason, and will be replaced with 32-year-old Ted Ginn.

Is there a more favorable situation for a WR to produce massive stats? Unless you just think Thomas will be harmed by all the attention — and that’s where Peterson should help — this is basically as good as it gets. He’s on the league’s most pass-happy offense, with a top-3 quarterback, and he is likely going to get fed a significant amount of targets. As a rookie, Thomas was targeted on 18.2% of passes. That number is almost certainly going to rise this year. The most targets any Saint has had with Brees is 149, set by Jimmy Graham in 2011.

But there is one other thing that helped Thomas last year. The Saints threw 59% of their passes to wide receivers last year, a new high in the Brees era. That coincided with just 17% — a record low since 2008 — of passes going to tight ends. In 2006 and 2007, Reggie Bush was a target monster while Mark Campbell and Eric Johnson were the top tight ends. But beginning in ’08, the Saints had Jeremy Shockey and then Jimmy Graham and a breakout season from Ben Watson in 2015. Last year, Coby Fleener was the tight end, and he was underwhelming. Fleener had a lower catch rate than any Saints wide receiver last year, and that’s not exactly how its supposed to work.

In 2014, Siants receivers had 47% of targets, then 54% in 2015 and 59% last year. Meanwhile, TE targets dropped from 27% with Graham to 24% with Watson and then 17% with Fleener. Take a look: the graph below shows the percentage of targets in New Orleans by position since 2006: [continue reading…]

{ 7 comments }

Nobody wants to watch this Saints defense with their eyes open

Nobody wants to watch this Saints defense with their eyes open

In short, maybe.

New Orleans has allowed 4,217 passing yards this year (which includes yards lost by the opposing team on sacks) on 538 dropbacks, which is already pretty bad.  That translates to a 7.84 Net Yards per Attempt allowed average, which is the worst in the NFL by half a yard per attempt.  But where things get really bad is in touchdowns and interceptions.  New Orleans has allowed an unbelievable 43 passing touchdowns through 15 games, the most in NFL history. In addition, the Saints have intercepted just 8 passes, tied for third fewest in the league this year.

That translates to an 8.77 Adjusted Net Yards per Attempt average, after giving 20 yards for each touchdown pass and subtracting 45 yards for each interception.  That is, by a decent measure, the worst rate in NFL history.  The current record belongs to the 0-16 Detroit Lions, who allowed 8.53 ANY/A.  Only three other teams — the ’81 Colts, the ’69 Saints, and the ’63 Broncos — have even allowed 8.00 ANY/A over a full season. [continue reading…]

{ 4 comments }

Brees may not be throwing for awhile

Brees may not be throwing for awhile

Ian Rapoport is reporting that Drew Brees may miss several games with a shoulder injury. That’s tough news for all involved, including those who will now have to watch a bad Saints team led by Luke McCown (or Garrett Grayson). But it also could mark the end of a weird bit of trivia.

Believe it or not, Marques Colston and Brees have connected for 72 touchdowns, tied with Philip Rivers and Antonio Gates for the 5th most in NFL history by any receiver/quarterback combination. I’ve written about that streak before, but here’s something else unique to consider: Colston has never caught a touchdown pass from anyone other than Brees. [continue reading…]

{ 4 comments }

Quick Thoughts on the Saints 0-2 Start

No team wants to start the season 0-2. By now you’ve heard the statistic that since 1990, only 12% of teams to start 0-2 have made the playoffs. While that’s true, that’s just one way — and not the only way — to examine the Saints start. That analysis is based on the following idea:

Look at group of teams with the same start –> see how they finish the year

But there’s another way to consider New Orleans’ early season woes. The Saints lost both games on the road. So while New Orleans is 0-2, the team still has 8 home games remaining. Based on the Saints history under Sean Payton, projecting a a 7-1 home record doesn’t seem unreasonable. And while the team lost both games so far, note that Saints opponents have already kicked three game-winning or game-tying field goals at the end of regulation or overtime already. [1]Matt Bryant forced overtime with a 51-yard field goal as time ran out in the 4th quarter, and then won the game for Atlanta in week 1 with a 52-yarder. That’s an amazing feat to have occurred after just two games; from a predictive standpoint, the Saints could just as easily be 2-0. And from a predictive standpoint, a 3-3 finish in road games the rest of the way doesn’t seem unreasonable, either. That would give the team a 10-6 record, and probably a playoff berth. [continue reading…]

References

References
1 Matt Bryant forced overtime with a 51-yard field goal as time ran out in the 4th quarter, and then won the game for Atlanta in week 1 with a 52-yarder.
{ 10 comments }

Predictions in Review: NFC South

During the 2013 offseason, I wrote 32 articles under the RPO 2013 tag. In my Predictions in Review series, I review those preview articles with the benefit of hindsight. Previously, I reviewed the AFC West, the NFC West, and the the AFC South. Today, the NFC South.

Who Will Win 2013 Head Coach of the Year, July 25, 2013

For reasons that are not quite clear to me, I have an unusual fascination with the Coach of the Year award. There’s no harder award to predict in all of sports, since the winner is essentially the coach of the team that had the least predictable (in a good way) season. Still, I threw my hat into the ring in 2014 and predicted that Sean Payton would win Coach of the Year. Here is what I wrote in July:

Rob Ryan is now in charge of a defense that ranked last in yards allowed, net yards per attempt allowed, rushing yards allowed, rushing yards per carry allowed, first downs allowed, Expected Points Added, and defensive DVOA. The 2012 Saints also ranked 31st in points allowed. Ryan himself won’t fix that, but first round pick Kenny Vaccaro should begin to help the problem secondary.

But the real reason for optimism is the always explosive Saints offense. Drew Brees, Jimmy Graham, and Darren Sproles are three of the more unique players in the NFL, and help give the Saints an outstanding passing offense. Of course, New Orleans passing attack was great before either Graham or Sproles arrived, as the Brees/Payton engine (with a dash of Marques Colston and Lance Moore) is at times unstoppable. …

Predicting who will win AP Coach of the Year is a fool’s errand, but I’m willing to put my chips on Brees and Payton leading the Saints to the playoffs in a “bounceback” year. The real question is whether that will be enough to convince the voters to select Payton.

As it turned out, Payton did lead a resurgent Saints team from 7-9 in 2012 to 11-5 in 2013; unfortunately for him, a playoff berth was not enough to get him Coach of the Year. That honor instead went to Ron Rivera, although in my eyes, Andy Reid was an immensely more deserving choice.

What can we learn: In week 16, the Panthers defeated the Saints on a touchdown pass with 28 seconds left in the game; had New Orleans won that game, the Saints would have finished 12-4 and won the division and a first round bye, knocking Rivera’s Panthers down to the 5 seed. Would that have been enough to swing the COTY award to Payton? Probably not, although it likely would have meant Reid would have won the honor. The Coach of the Year award remains impossible to predict.
Did you just grab my torch?

Did you just grab my torch?.

Julio Jones and Roddy White star in Stealing The Torch, July 31, 2013

My other three NFC South posts were more walks down memory lane than predictions. The Falcons post was a look at other star wide receiver tandems that were similar to Julio Jones and Roddy White in 2012. This was a fun way to look at comparable receivers, but there was nothing fun about the Atlanta offense in 2013.  Jones averaged 116.0 yards per game last year, but that came over just five games. A foot injury suffered against the Jets in week 5 ended what looked to be a special season: Jones was leading the league in receptions (41) and was second in receiving yards (580) at the time. White, meanwhile, had an absymal start to his season that dragged on for months.

Hamstring and ankle injuries caused White to miss three full games and hampered his production in most of the others. At the end of November, he just 20 catches for 209 yards; at that point, the Falcons were 2-9, and I won’t fault you if you put Atlanta on “ignore” for the rest of the year. But White exploded with 43 catches for 502 yards in December, joining Josh Gordon (658) and Alshon Jeffery (561) as the only players with 500+ receiving yards in December 2013.

The Steve Smith Post, August 7, 2013

In August, I decided to compile the loose odds and ends I had collected on Steve Smith over the years. When the time comes, I plan on using that post to augment Smith’s Hall of Fame case. Unfortunately for Smith, the time may be coming sooner than he’d like. On December 1st, I wrote that Smith’s poor production may have been a reason for why Cam Newton’s numbers had declined.

Smith has had largely the same role in the Panthers offense for years, so it’s not unreasonable to compare his advanced metrics from each of Newton’s seasons.  In 2013, Smith caught 58.2% of his targets, which is in line with his production from 2012 (52.9%) and 2011 (61.2%). However, Smith started running much shorter routes — according to NFLGSIS, his average reception came just 8.9 yards downfield in 2013, compared to around 12 yards over the prior two years. Smith’s YAC also decreased (which is unusual, as shorter passes tend to lead to more YAC, making this another bad sign); as a result, his yards per target dropped from 10.8 in 2011 to 8.5 in 2012 to just 6.8 in 2013.  It was a down year in a Hall of Fame caliber career. Smith turns 35 in May; unfortunately, it seems safe to suggest that the best is behind him.

Can Tampa Bay Win the NFC South With the Worst Passing Attack?, August 13, 2013

Just about everyone assumed the Bucs would have the worst starting quarterback in the NFC South. What interested me was the rest of the team. The question I posed was more trivia than analysis: how often does the team with the worst passing attack in the division wind up winning the division?

The answer: Since 1950, only nine teams pulled off that feat, with nearly half of them coming since the league moved to a four-teams-per-division-for-each-division format in 2002. No team pulled off that feat in 2013, although the Panthers ranked 3rd in the NFC South in Adjusted Net Yards per Attempt. The team that ranked last in the division was, of course, the Bucs.

The Bucs ranked 32nd in NY/A and finished the year 4-12. But remember: Tampa Bay faced the hardest schedule in the league in 2013. Early DVOA estimates project the Bucs for 7.7 wins in 2014, and there are reasons for optimism in Tampa Bay in 2014.

{ 3 comments }

By all accounts, this was an underwhelming quartet of games played on The Best Weekend in Football. Last year, the division round gave us an incredible Russell Wilson comeback where the Seahawks scored three fourth quarter touchdowns before falling short against the Falcons and the Peyton ManningJoe FlaccoRahim Moore classic. Seattle won this year but in boring fashion, and Broncos fans undoubtedly prefer this year’s rendition of Neutral-Zone-Infraction to last year’s heartbreak. In 2011, the 9-7 Giants pulled off the rarest of upsets: outclassing the 15-1 Packers and winning a game as huge underdogs while managing to look like the better team in the process. The day before, Alex Smith lead the 49ers in a home upset over the Saints in one of the more exciting playoff games of our generation. In 2009 and 2010, the brash Jets won road games as heavy underdogs in convincing fashion against the Chargers and Patriots. This was the halcyon era of the Mark SanchezRex Ryan Jets, also known as years 3 and 2 Before The Buttfumble. In 2008, the Ravens (over the Titans), Eagles (Giants), and Cardinals (Panthers) all won as road underdogs. The year before, the Giants shocked the Cowboys before that was our Tony Romo-adjusted expectation, and the Chargers won as 11-point underdogs in Indianapolis preventing a Tom BradyPeyton Manning upset (no such road bump this year).

In some ways, the results this weekend were a good thing. Perhaps we will remember this as the year the division round of the playoffs felt like eating a salad – a bit unsatisfying at the time, but better for us in the long term. No one would complain about seeing more Andrew Luck — actually, maybe some of us would — but getting an AFC Championship Game of Manning and Brady just feels right. We have become so accustomed to seeing fluky teams like the Chargers make runs that we’ve forgotten that it can be very good when the results match our intuition. Back in April I said that the Patriots and Broncos were on a collision course for the AFC Championship Game, although my reasoning wasn’t exactly spot on (“the key to their success is keeping Rob Gronkowski, Aaron Hernandez, and Danny Amendola healthy, although the Patriots will be fine as long as two of them are on the field.”)

But it’s not as if I had some special insight: as noted by Will Brinson, the 49ers, Seahawks, Patriots, and Broncos were the four teams with the best preseason odds. No one would complain about seeing more from the Saints and Panthers, but I don’t think many would argue with the idea that the 49ers and Seahawks are the two most talented teams in the league. A few years from now, there won’t be much we remember from the division round. But I have a feeling it set up two conference championship games that will be very memorable. [continue reading…]

{ 9 comments }

Division Preview: New Orleans at Seattle

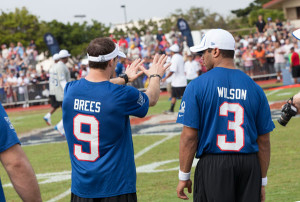
Brees and Wilson scheming to get on an amusement park ride

Brees and Wilson scheming to get on an amusement park ride.

On the surface, this does not appear to be a very even matchup. In home games in 2013, Seattle outscored opponents by 15.4 points per game, an average that includes the loss to Arizona. In road games during the regular season, the Saints were outscored by 4.6 points per game. Both of those averages, of course, include Seattle’s 27-point demolition of the Saints in Seattle just six weeks ago. The 20-point difference between Seattle’s average home margin and the New Orleans’ average road margin — which, for brevity’s sake, I’m going to call the “projected MOV” — is very high, even by historical standards.  In fact, only 20 playoff games since 1950 featured a game with a larger projected MOV.

The table below shows the 50 playoff games with the largest projected MOV since 1950, measured from the perspective of the home team. For games since 1978, I’ve also shown the pre-game points spread. The largest projected MOV came in 1998, when the Vikings hosted the Cardinals in the playoffs. That year, Minnesota outscored teams by 23.6 points per game at home, while Arizona was outscored by 9.1 PPG on the road. Those numbers combine for a projected MOV for Minnesota of nearly 33 points! The game took place during the division round of the playoffs and the Vikings were 16.5-point favorites. You can click on the boxscore link to see the PFR boxscore for the game, which Minnesota won, 41-21.

YearHomeRoadHm PD/GRd PD/GProj MOVRdSpreadBoxscorePFPAW/L
1998MINARI23.63-9.1332.75D-16.5Boxscore4121W
1991WASDET22.88-7.530.38C-14Boxscore4110W
1973MIACIN21.86-6.7128.57DBoxscore3416W
1991WASATL22.88-426.88D-11.5Boxscore247W
1999STLTAM24.63-226.63C-14Boxscore116W
1969MINCLE24.29-1.8626.14CBoxscore277W
1978DALATL14.75-11.2526D-15Boxscore2720W
1987SFOMIN20.29-4.1324.41D-11Boxscore2436L
1979PITHOU20.38-424.38C-9.5Boxscore2713W
1950RAMCHI23.5-0.1723.67DBoxscore2414W
2008CARARI15.38-7.8823.25D-10Boxscore1333L
1999STLMIN24.631.3823.25D-7Boxscore4937W
1977RAMMIN18.86-422.86DBoxscore714L
1997DENJAX22-0.3822.38W-6.5Boxscore4217W
2011NORDET23.25122.25W-10.5Boxscore4528W
2007NWEJAX21.5120.5D-13.5Boxscore3120W
1996PITIND15-5.3820.38W-8Boxscore4214W
1996CARDAL16.5-3.7520.25D3.5Boxscore2617W
1996DENJAX14.38-5.8820.25D-12.5Boxscore2730L
1979PITMIA20.380.2520.13D-9.5Boxscore3414W
2004ATLSTL6.88-12.8819.75D-6.5Boxscore4717W
2011GNBNYG18.75-0.8819.63D-8Boxscore2037L
2007NWESDG21.51.8819.63C-14Boxscore2112W
1989SFOMIN14.88-4.3819.25D-7.5Boxscore4113W
1985CHIRAM19.50.2519.25C-10.5Boxscore240W
1969MINRAM24.295.1419.14DBoxscore2320W
1969DALCLE17.29-1.8619.14DBoxscore1438L
2009NWEBAL18.38-0.6319W-4Boxscore1433L
1973MIAOAK21.862.8619CBoxscore2710W
1998NYJJAX16.38-2.518.88D-9Boxscore3424W
2012DENBAL16.13-2.6318.75D-9Boxscore3538L
2005SEAWAS16.75-1.8818.63D-8.5Boxscore2010W
1985MIACLE13-5.6318.63D-10.5Boxscore2421W
1979SDGHOU14.63-418.63D-8Boxscore1417L
1977DALMIN14.57-418.57CBoxscore236W
1998MINATL23.635.2518.38C-11Boxscore2730L
1998DENMIA14.63-3.2517.88D-13.5Boxscore383W
2011SFONYG16.75-0.8817.63C-2Boxscore1720L
1999JAXMIA13.63-3.8817.5D-8Boxscore627W
1954CLEDET21.674.1717.5CBoxscore5610W
1991HOUNYJ15.63-1.7517.38W-9Boxscore1710W
2001PITBAL14.5-2.7517.25D-5.5Boxscore2710W
1963SDGBOS12.86-4.2917.14CBoxscore5110W
2012BALIND9.38-7.6317W-7Boxscore249W
1997SFOMIN15.38-1.6317D-11.5Boxscore3822W
1998DALARI7.75-9.1316.88W-7Boxscore720L
1969OAKHOU13.71-3.1416.86DBoxscore567W
1967OAKHOU21.714.8616.86CBoxscore407W
1996GNBCAR18.882.1316.75C-12Boxscore3013W
1988CINSEA15.38-1.3816.75D-6.5Boxscore2113W

[continue reading…]

{ 3 comments }
I have to deal with Chip Kelly?

I have to deal with Chip Kelly?

Kansas City/Indianapolis Preview

New Orleans Saints (11-5) (+2.5) at Philadelphia Eagles (10-6), Saturday 8:10 PM ET

We’re fully immune to the Saints offense at this point. Drew Brees just threw for for 5,162 yards and 39 touchdowns and it didn’t even register on most radars. One reason for that: both of those numbers represent three-year lows for the Saints star. Jimmy Graham shook off early-season leg injuries to lead the league with 16 touchdowns, and rookie Kenny Stills led the NFL in yards per target. Both Pierre Thomas and Darren Sproles topped 70 receptions — two of just five running backs this year to do so — and I didn’t even know that until five seconds ago. Pinball numbers are the expectation when dealing with the Saints offense.

But the real change is on defense, as the team just finished one of the most remarkable turnarounds in NFL history. Did you know that the Saints finished fourth in points allowed this year? That’s only the fourth time New Orleans has ranked in the top five in that statistic in franchise history, with the other three occurrences all coming during the Dome Patrol era. What makes New Orleans’ success even more remarkable is that the team ranked last in points allowed in 2012. New Orleans is the first team in NFL history to jump 27 spots in the points allowed rankings. Prior to this year, the 2011 Houston Texans (4th after ranking 29th) and 1993 New York Giants (1st after ranking 26th) had been the most improved defenses with 25-slot jumps. Now the Saints probably aren’t as good as their points allowed rank would imply (Football Outsiders has them 9th, Advanced NFL Stats ranks the unit 10th), but unparalleled feats remain astounding.

The main reason for the team’s improvement is the pass defense. The Saints ranked last in Net Yards per Attempt allowed last year, but 7th this season, another remarkable jump. In fact, only 10 teams have ever made a jump of 25 spots in the NY/A allowed rankings: [continue reading…]

{ 9 comments }

Is there a harder award to predict in football? It would have been impossible to predict who would win the award this time last year, as eventual winner Bruce Arians wasn’t even a head coach until October. Of course, that doesn’t excuse my terrible selection. As I said last year, predicting in the pre-season which coach will ultimately win the award is so difficult that Vegas doesn’t even offer odds on the event. For reference, below is a look at every coach to ever be selected by the Associated Press as NFL Head Coach of the Year: for what it’s worth, Arians saw the biggest increase in winning percentage of any COTY winner. Arians also broke a tenure deadlock: until last season, both 1st and 2nd-year coaches had won the award 15 times, but now first-year head coaches are in the lead having won the award 16 out of 57 times (28%).

[continue reading…]

{ 2 comments }

Season in review: AFC and NFC South

Last week I reviewed the seasons of the teams in the AFC East and NFC East and in the AFC North and NFC North. Today we’ll review the interesting seasons from the AFC and NFC South divisions.

In the AFC South, I had the bottom three teams projected for between 5 and 6 wins for a five week stretch starting after week two. As we now know, that was resolved quite definitively by the end of the year:

AFC South

Houston Texans

Pre-season Projection: 10 wins
Maximum wins: 14 (after week 15)
Minimum wins: 10 (after week 1)
Week 1 comment: Going to win the AFC South going away; this team could win 12 games, but concerns about injuries and the potential to rest starters late keep them at 10 wins for now.

A miserable December ruined what should have been a marvelous season in Houston. At no point did I project any of the other AFC South teams to finish within even three games of the Texans. When they were 5-0, I wrote: Not only do the Texans still have 6 home games remaining, but they have 4 more games against the AFC South and get the Bills and Lions. Even without Brian Cushing, I don’t see why they don’t win 8 more games.

The Texans schedule was easy, but they also had dominant seasons out of J.J. Watt and Andre Johnson. Left Tackle Duane Brown was outstanding, and Houston is as good as any other team in the league when they’re at their their best. Unfortunately, they might be undermanned in a gunfight with the Broncos or Patriots, and it looks like now they’ll have to beat both of those teams to get to New Orleans. Still, I give the Texans a fighting chance; Matt Schaub has struggled in primetime games, but that doesn’t really mean anything. In the end I think the week 17 loss submarined their playoff hopes, and the team will be left wondering how good they could have been if Cushing stayed healthy.

Indianapolis Colts

Pre-season Projection: 5.5 wins
Maximum wins: 10 (after week 12 through the end of the year)
Minimum wins: 4 (after week 1)
Week 1 comment: There will be growing pains in Indianapolis. But nobody feels bad for their fans, nor should they; the Colts will be contenders each year for a decade, starting next season.

I never got on board with the Colts this year and it only looks worse in retrospect. On the other hand, even though Indianapolis finished 11-5, they were still outscored by 30 points in 2012. They struggled to beat Brady Quinn and the Chiefs and split with the Jaguars. The Colts won just two game by more than a touchdown.

While I missed on the Colts overall, I was on board the Andrew Luck bandwagon early on even when his numbers were terrible. I wrote this before the Colts-Packers game: Andrew LuckAaron Rodgers I won’t steal the spotlight from Tom BradyPeyton Manning XIII; by the time these two teams play again in four years, we may be looking at the best two quarterbacks in the league. I highlighted how Luck was being undervalued by conventional statistics after week 7, and wrote this after week 8: A wildcard darkhorse? I don’t think the Colts are very good — they’re just 29th according to Football Outsiders — but a win over Miami this weekend puts them in the driver’s seat. I finally projected them at 10 wins after week 12, and noted: Basically clinched a playoff berth with win over Buffalo and Steelers loss. Hard not to like this team.

They may not be very good, but they certainly are likeable. Even after the upset win over the Texans, Houston is just the 10th team to make the playoffs after being outscored by at least 30 points.
[continue reading…]

{ 2 comments }

The man with the second longest TD streak played for the Chargers...

Last year, I noted that Drew Brees had thrown a touchdown in 37 consecutive games and examined his chances of breaking the NFL record. The current mark is held by Johnny Unitas, who threw a touchdown in 47 consecutive games from 1956 to 1960. By the end of the 2011 season, Brees had upped his streak to 43 games, which positions Brees to break the record in week 5 of this season, against his former team, the San Diego Chargers, on Sunday Night Football.

Assuming Brees breaks the record, we can expect a four-hour telecast devoted to the greatness of Drew Brees, which is largely warranted. Brees is a future Hall of Famer and one of the most accurate quarterbacks in the history of the game. And he’ll be breaking one of the oldest records in football, one currently held by the standard bearer at the position.

If you’ve been at Football Perspective for long, you probably know where this is going. How impressive will it be for Brees to break this record? The short answer is, probably not as impressive as you might think.

What are the odds of throwing a touchdown in 47 straight games [1]Assuming independence and a consistent rate per game? Brees deserves all of the credit and praise he gets for being an elite quarterback, and a Blaine Gabbert-type is obviously not going to be the one to break this record. But the real question we want to ask is what are the odds of a star quarterback throwing a touchdown in 47 consecutive games. We can get a pretty good estimate of that.

In 44 games from 2002 to 2005, Marc Bulger threw a touchdown in 93% of his games, or 41 of 44 games. And in two of the games where he did not throw a touchdown, he threw fewer than five passes. In 73 games from 2000 to 2004, Daunte Culpepper threw a touchdown in 86% of his games. Brett Favre, from 2001 to 2004, threw a touchdown in 95% of his games. Eli Manning, from 2005 to 2011, threw a touchdown in 86% of his starts and was booed by Giants fans in just as many. Peyton Manning, excluding his rookie year, threw a touchdown in 87% of his games with the Colts. Philip Rivers once threw a touchdown in 50 of 54 straight games. Aaron Rodgers has thrown a touchdown in 50 of his last 53 games, with one of his zeroes coming in a partial game against the Lions. Tony Romo has thrown a touchdown in 90% of his games since 2007, and 92% of those games if you exclude two games he did not finish. Matt Ryan has thrown a touchdown in 30 of his last 31 games. Matthew Stafford has thrown a touchdown in 28 of his last 30 games, with one of his shutouts coming in a game he did not finish due to injury. From ’99 to ’01, Kurt Warner threw a touchdown in 93% of his games.

And then there’s Tom Brady. Since 2007, Brady has thrown a touchdown in 92% of his starts, or 94% if you exclude his game against the Chiefs when he tore his ACL in the first quarter. Brady has also thrown a touchdown in each regular season game the past two seasons, which means he could also break Unitas’ mark in 2012.

There is obviously an upper limit to the question ‘what is the likelihood of an elite quarterback playing at an elite level throwing a touchdown in any given game?’ Last year, I speculated that Brees’ likelihood was around 89-91%, which in retrospect, might be a little low. The upper limit is probably closer to 96 or 97%, although obviously very few quarterbacks could get there. If we assume complete games — i.e., that the quarterback won’t get injured or get benched or rested — maybe a star quarterback in today’s game has a 94% chance of throwing a touchdown in any given game.

... as did the man with the longest streak

In that case, such a quarterback has a 5% chance of throwing a touchdown in 48 consecutive games. In some ways, of course, this is a “what are the odds of that” sort of question. Yes, Brees is at 43 in a row, but he’s not alone. Brady has thrown a touchdown in every game the last two seasons. Stafford has done it in 18 straight games, Rodgers for 17, and Ryan is at 15. And, of course, players like Kurt Warner and Brett Favre and Peyton Manning have played at elite levels for stretches just like Brees.

Perhaps the better question is, assuming 14 elite quarterbacks playing at elite levels play in 48 straight games, and each has a 94% chance of throwing a touchdown in any given game, what are the odds that none of them go 48/48? The answer to that: 48%. In other words, it is more likely than not that some quarterback would break the record.

Brees deserves all the praise in the world for essentially putting himself at the upper limit of elite quarterback play. He deserves credit for having a quick release and excelling at pre-snap coverage, which limits the amount of hits he takes. On the other hand, he’s fortunate to have almost entirely avoided playing in poor weather. He’s fortunate to have avoided injury on the hits he has taken, and to have not played for a coach that chose to bench him for a meaningless game after a drive or two (in fact, he missed week 17 of the 2009 season entirely, keeping his streak alive). He’s also fortunate that he’s thrown a touchdown in 43 games and not 41 or 42 out of 43, like many other elite quarterbacks. Brees has had bad games during this streak — in 7 of them, he’s averaged 4.8 AY/A or fewer — but he always managed to throw at least one touchdown. That’s less skill than luck, and you can read about some of Brees’ near misses here.

The skill involved for Brees is getting himself to that upper limit. Given enough quarterbacks playing at elite levels for enough years, Unitas’ record was bound to fall. Brees happens to be one of those quarterbacks.

References

References
1 Assuming independence and a consistent rate per game
{ 7 comments }

One of my law school professors was very quirky, even by law school professor standards. His preferred examination method was multiple choice, but with a twist. After grading each exam, he would then divide the students into quarters based on their test score. He would then re-examine each question, and measure how the top quarter of students performed on each question relative to the bottom quarter. Any question that more bottom-quarter students answered correctly than top-quarter students would be thrown out, and the exam would be re-graded. As he delicately put out, ‘if the wrong students are getting the question right, and the right students are getting the question wrong, it’s a bad question.’

NFL passing records are falling for a variety of reasons these days, including rules changes and league policies that make the passing game more effective. But there’s another reason: for the first time in awhile, the right people are throwing the most passes in the league. And there’s no better example of that than Drew Brees. Since coming to the Saints in 2006, he’s ranked 1st or 2nd in pass attempts four times, and ranked in the top three in net yards per attempt four times. But even since ’06, we’ve seen the passing game evolve, as the best quarterbacks are now the most likely ones to finish near the top of the leaderboard in pass attempts. In 2010, Peyton Manning had his first 600-attempt season… when he threw 679 passes for the Colts. Tom Brady threw 611 passes last year for the 13-3 Patriots, making New England one of just three teams to threw 600 pass attempts and win 13 or more games in a season. The other two teams? The ’09 Colts and the ’11 Saints.

At various points in the history of the NFL, passing was viewed as an alternative to running, and the high-attempt game was the province of the trailing team. But times are changing in the NFL. I calculated each team’s net yards per attempt (NY/A) and total pass attempts (attempts plus sacks) for every year since 1970. Then, I measured the correlation coefficient between NY/A and pass attempts for the league for each of the last 42 seasons. The chart below shows the correlation coefficient between those two variables (NY/A and pass attempts) for the league as a whole for each year since the merger:
[continue reading…]

{ 1 comment }