≡ Menu

Quite the clickbait title, I know. But given where this post is going, I thought precision was more important than anything else.

Over the last three seasons, Seattle has allowed 15.2 points per game. That’s really, really good. How good?

pa2012

There are flaws with using points allowed as a measure of defensive play, of course. Seattle is known for its long drives on offense, which limits the number of possessions an opponent might have. And the Seahawks offense generally puts the team’s defense in pretty good situations. Using points allowed per drive might be preferable, or using DVOA, or EPA per drive, or a host of other metrics. And adjusting these results for strength of schedule (or, at least, removing non-offensive scores) would make sense, too.

But hey, it’s Friday, and I wanted to keep things relatively simple. [1]In about ten minutes, we can all have a good laugh at this line. Points allowed is a number we can all understand. Given our era of inflating offenses, it’s quite possible that Seattle’s 15.2 points per game average doesn’t stand out as particularly impressive to you. After all, the ’76 Steelers once allowed 28 points over a nine-game stretch! But consider that since 2012, the NFL average has been 22.6 points per game, which means the Seahawks have allowed 7.4 fewer points per game than the average defense.

How good is that? [continue reading…]

References

References
1 In about ten minutes, we can all have a good laugh at this line.
{ 11 comments }

Super Bowl XLVIII Recap

A fitting end to a dream season

A fitting end to a dream season.

It almost seems silly to spend much time recapping one of the most lopsided Super Bowls ever. But we have six months until we get to watch another NFL game, so I think we can spend one more day recapping the 2013 season. One housekeeping note: Football Perspective isn’t going anywhere. Just like last year, we’ll be publishing a post every day of the offseason. So be sure to check back daily! Freelance articles are also welcome, so just send me an e-mail if you’d be interested in contributing to the site.

There were some great recaps published in the immediate hours after the Super Bowl, including summaries from Bill Barnwell and Mike Tanier, a Super Bowl edition of Audibles at the Line from Football Outsiders, Ben Stockwell’s Refocused recap at Pro Football Focus, an analytic take from Advanced NFL Stats, the gut-punching summaries from Douglas Lee  and T.J. Johnson at It’s All Over, Fat Man!, and the elated Danny Kelly and Jacson Bevens from FieldGulls.

So with 24 hours to sleep on things, here are my thoughts on how any why Seattle produced a Super Bowl blowout.

The Seattle Defense vs. The Denver Offense

I wrote a lot about Super Bowl XLVIII, but by far the most anticipated subplot was seeing Peyton Manning against Richard Sherman and the Seattle pass defense. In my Super Bowl preview, I encouraged readers to watch the YAC: No quarterback gained more yards on yards after the catch in the regular season than Manning. On a per-catch basis, Denver receivers averaged 5.75 yards after the catch according to NFLGSIS, but Seattle led the league in YAC/Catch allowed at 4.1.  The Seahawks press coverage and sure tackling seemed like a bad matchup for Denver, and it was: according to Pro Football Focus, Denver receivers gained just 3.7 yards after the catch per reception in the Super Bowl.

That’s just part of the biggest story, of course, which is how one of the greatest pass defenses in NFL history — and one of the greatest defenses in NFL history — played like it on the biggest stage. Cliff Avril (5 hurries, 2 hits according to PFF) was remarkable in the first half, dominating the Broncos offensive line and forcing both Manning interceptions. Kam Chancellor and Malcolm Smith were the recipients of both Manning picks, and both had strong all-around games, too. Richard Sherman was quiet, but Manning and the Broncos largely avoided him, which means his impact was felt. [continue reading…]

{ 5 comments }

Why is the Over/Under So Low In Super Bowl XLVIII?

The Over/Under for Super Bowl XLVIII was just 48 points for most of the last week, although it went up to 48.5 on Thursday and may be at 49 by kickoff. In any event, such a low number should strike Broncos fans as really odd, since the average over/under in the team’s first 18 games was 53.4 points. And the “Over” has hit in 10 of those games!

Seattle, meanwhile, has had an average over/under of 42.8 points. As it turns out, the “Under” has hit in 12 of Seattle’s 18 games this season, including each of the last seven. Readers who are good at arithmetic might have already noticed that the average of 53.4 and 42.8 is 48.1 points.

The graph below shows the Over/Under in each game this season for Denver and Seattle:

[visualizer id=”17753″]
[continue reading…]

{ 1 comment }

Super Bowl XLVIII Denver/Seattle Preview

Before we get to my preview, I want to point you to some excellent Super Bowl previews I saw this week:

Last week, I went into the film room and recapped the preseason matchup between these two teams. Today, I’m going to analyze the six — yes, six! — different matchups to watch in Super Bowl XLVIII.

Seattle Pass Defense vs. Denver Pass Offense

I’ve written many glowing articles about the Seattle pass defense, and we all know about the Broncos record-setting offense. Super Bowl XLVIII is the greatest offense/defense showdown since 1950 and the greatest passing showdown ever. Denver’s pass offense is historically great, and Seattle’s pass defense is historically great. But beyond being a great defense, there are reasons to think the Seahawks present a particularly tough challenge for Manning and company. [continue reading…]

{ 4 comments }

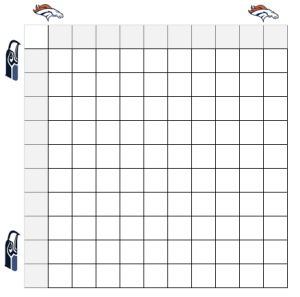
sb xlviii squaresLast year, I wrote an article about Super Bowl squares. Well, it’s that time of year again, so here’s your helpful cheat sheet to win at your Super Bowl party.

Every Super Bowl squares pool is different, but this post is really aimed at readers who play in pools where you can trade or pick squares. I looked at every regular season and postseason game since 2002. The table below shows the likelihood of each score after each quarter, along with three final columns that show the expected value of a $100 prize pool under three different payout systems. The “10/” column shows the payout in a pool where 10% of the prize money is given out after each of the first three quarters and 70% after the end of the game; the next column is for pools that give out 12.5% of the pool after the first and third quarters, 25% at halftime, and 50% for the score at the end of the game. The final column is for pools that give out 25% of the pot after each quarter — since I think that is the most common pool structure, I’ve sorted the table by that column, but you can sort by any column you like. To make the table fully sortable, I had to remove the percentage symbols, but “19, 6.7, 4.1, 2” should be read as 19.0%, 6.7%, 4.1%, and 2.0%. [continue reading…]

{ 2 comments }

Regular readers know I’m not prone to exaggeration. I’m more of a splits happen kind of guy. But Super Bowl XLVIII will, in my opinion, be the greatest passing showdown ever. This year’s Super Bowl checks in as the greatest offensive/defensive showdown in Super Bowl history (and the greatest of any game, regular or postseason, since 1950). That’s because the passing showdown between Denver and Seattle is arguably the greatest of any game in all of pro football history.

How can we quantify such a statement? I’m glad you asked. If you recall, I labeled the 2013 Seahawks as one of the five greatest pass defenses since 1950. For new readers, Adjusted Net Yards per Attempt is calculated as follows:

[math]
(Gross Pass Yards + 20 * PTDs – 45 * INTs – Sack Yds)/(Attempts + Sacks)[/math]

In 2013, the Seahawks allowed 3.19 Adjusted Net Yards per Attempt (Seattle allowed 3,050 gross passing yards and 16 TDs, while forcing 28 interceptions and recording 298 yards lost on sacks, all over 524 pass attempts and 44 sacks.). The other 31 pass defenses allowed an average of 5.98 ANY/A, which means Seattle’s pass defense was 2.79 ANY/A above average. Over the course of the 568 opponent dropbacks, this means the Seahawks provided 1,582 adjusted net yards of value over average. In other words, the Seattle pass defense provided 99 adjusted net yards over average on a per game basis. Let’s be clear: the Legion of Boom is not just a hype machine, and Richard Sherman, Earl Thomas, Kam Chancellor, and company form the best secondary in the league.
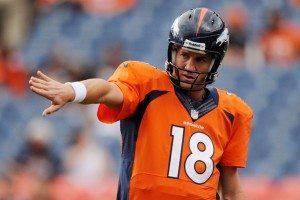
All other passing attacks are pushed aside when Manning is involved.

All other passing attacks are pushed aside when Manning is involved.

Denver’s offense was even more dominant, although that’s to be expected: in general, the spread in offensive ratings is a bit wider than it is on the defensive side of the ball. Denver threw for 5,572 gross passing yards and 55 touchdowns, while throwing just 10 interceptions and losing only 128 yards to sacks. The Broncos had 675 pass attempts and were sacked just 20 times, giving them an 8.77 ANY/A average. The other 31 offenses averaged only 5.79 ANY/A, meaning the Broncos were 2.98 ANY/A better than average. Over the 695 dropbacks the team had, that means Denver provided 2,072 adjusted net yards of value average average. On a per-game basis, that’s 130 yards of value each game!

So, how do we judge the greatest passing showdowns in football history? Denver’s passing offense gets a rating of +130, while Seattle’s pass defense gets a rating of +99. Those two numbers have a Harmonic Mean of 112. That’s easily the most in Super Bowl history. In fact, it’s the third most in any playoff game ever, and those other two games each have asterisks.

In the 1961 AFL, the Houston Oilers behind George Blanda, Bill Groman, and Charley Hennigan possessed an incredible passing offense (rating of +167), while the San Diego Chargers had a dominant pass defense (+129). But in the early days of the AFL, the talent pool was diluted; this would be akin to comparing two teams in non-BCS conferences with out-of-this-world statistics to a matchup between champions in two power conferences. For what it’s worth, Houston won the game — played in San Diego — but with a catch. The Oilers offense was shut down, as Blanda went 18/40 for 160 yards with 1 touchdown and 5 interceptions…. but Houston won 10-3, as Jack Kemp threw four picks for the Chargers. [continue reading…]

{ 1 comment }

SB XLVIII Is The Best Offense/Defense Super Bowl Ever

This year, the Broncos averaged 37.9 points per game, 14.5 points more than league average. Seattle, meanwhile, allowed just 14.4 points per game, 9.0 points better than league average. That means this is a true clash of the titans in one sense: when the Broncos offense is on the field against the Seattle defense, the two units will have been a combined 23.4 (difference due to rounding) points better than average during the regular season.

As it turns out, that’s the greatest disparity between any two units in Super Bowl history. One nice aspect of comparing a team’s offense to an opponent’s defense is that you don’t need to adjust for era, since a high (or low) scoring environment will equally help and hurt each pairing. You can simply subtract Seattle’s 14.4 PPG average from Denver’s 37.9 PPG average to get that same 23.4 PPG difference. The table below shows the differential between each team offense and opposing defense — measured by points scored and points allowed per game — for each of the 48 Super Bowls. That means the Denver/Seattle battle will replace Super Bowl I for the greatest offense/defense showdown in Super Bowl history.

Here’s how to read the table below. In 1966, the Kansas City offense faced the Green Bay defense in Super Bowl I (hyperlinked to the boxscore at PFR). The Chiefs quarterback was Len Dawson, and Kansas City averaged 32 points per game that year. Meanwhile, the Packers allowed only 11.6 points per game, providing a difference of 20.4 points. In Super Bowl I, however, the Chiefs lost to the Packers, 35-10. This is the first time since Super Bowl XXV that the number one scoring offense is facing the number one ranked scoring defense, but frankly, the Bills/Giants showdown pales in comparison to this one. The difference there was nearly ten points narrower than the Denver/Seattle disparity. [continue reading…]

{ 11 comments }

Film Room: Manning against Seattle in the preseason

Who treats the preseason like BS? BS!

Who treats the preseason like BS? BS!

On August 17th, Denver traveled to Seattle for each team’s second game of the preseason. Some people think the preseason is meaningless, but I thought it would be worthwhile to rewatch the first half of that game. If you’re interested, there were a pair of good recaps written in August from Field Gulls, the Seattle SB Nation site, and Its All Over, Fat Man!, a Broncos site and friend of the program.
[continue reading…]

{ 10 comments }