≡ Menu

Back-To-Back Long Winning/Losing Streaks

In 2017, the Houston Texans lost their final six games of the season. Tom Savage started the first of those three games, with T.J. Yates starting the final three. This year, with Deshaun Watson back from injury, the Texans… lost their first three games of the season. So entering week 4, Houston was on a 9-game losing streak. Since then? Houston has won four straight, and with a home game against the Dolphins tonight, have a good chance of running that winning streak to five straight. With a win in Denver next week, the Texans would have followed a streak of 6+ straight losses by, immediately, winning 6+ straight games.

That’s pretty rare: only six teams have ever strung together back to back streaks of 6+ wins and 6+ losses. And if Houston runs the streak to 9 straight wins, the Texans would be the first team to ever have back-to-back 9-game streaks.

The longest streak? That belongs to the San Diego Chargers. In 1987, the Chargers lost the season opener, but responded by winning 8 consecutive games (including three with replacement players). And then San Diego promptly lost 8 straight games, marking the only time a team has ever had back-to-back 8-game winning/losing streaks. For those curious, a 36-year-old Dan Fouts was the starter for 5 of the games during the winning streak, and four of the games during the losing streak, which stretched into 1988.

Just two other times has a team had a 6+ game winning streak followed by a 6+ game losing streak. In 1977, the Don Coryell Cardinals began the season 1-3 before Jim Hart and crew went on a 6-game winning streak, bringing St. Louis’s record to 7-3. From that point on, the Cardinals lost their final four games of the regular season and the team’s first eight games of 1978 under Bud Wilkinson.

Finally, the 2001 Rams under Kurt Warner won their final six regular season games, plus the team’s two NFC playoff games, allowing St. Louis to enter the Super Bowl on an 8-game winning streak. The Rams lost to the Patriots in the Super Bowl, of course, and then began the 2002 season on a 5-game losing streak, with Warner the starter for all but the final game. And at 0-5, the Rams responded with a 5-game winning streak, then under Marc Bulger!

What about teams like the Texans, who followed long losing streaks with long winning streaks? There are just three of those teams, using 6-game minimums.

In 1970, the Cincinnati Bengals had one of the more interesting seasons in NFL history.  With Paul Brown and Bill Walsh as offensive masterminds, the Bengals found a gem in Greg Cook to be the team’s quarterback in 1969.  Unfortunately, Cook suffered what would be a career-limiting injury, and the Bengals brass turned the ball over to Virgil Carter.  You know the story from there, as Carter, Walsh, and Brown helped usher the West Coast Offense into the NFL.  After winning the team’s opener, Cincinnati lost 6 straight games, before going on a 7-game winning streak to end the regular season.  The Bengals lost the team’s only playoff game.

In 1994, the New York Giants began the season 3-0, then lost 7 straight games, and then won the team’s final 6 games. Dave Brown was the team’s quarterback for all but one game.

Finally, we have the 1974 Jets, with a 31-year-old Joe Namath who managed to play every game that season.  New York lost its first game, won its second game, and then won on a 6-game losing streak followed by a 6-game winning streak to end the season.  From weeks 3 through 8, the Jets ranked 25th in passer rating and 17th in Net Yards per Attempt; during the final six weeks, the Jets ranked 3rd in passer rating and 3rd in NY/A.

{ 0 comments }

Are the Texans The Worst 6-3 Team Ever?

Regular readers are familiar with Pythagenpat Records, and using them to see how much of an outlier teams are in a given season.

You can read the link for background information, but here is the quick summary.

The Texans have scored 161 points and allowed 188 in 9 games this year. We use this formula to determine the appropriate exponent for Texans games:

(Points Scored + Points Allowed)/(Games Played)^0.251

This helps to control for things like pace of games, and scoring frequency. For Houston, that exponent is 2.50. Then, we use that to calculate the team’s Pythagenpat Record using this formula:

(Points Scored ^ 2.50) / (Points Scored ^ 2.50 + Points Allowed ^ 2.50)

[continue reading…]

{ 12 comments }

This week at the New York Times, a record-breaking stat to highlight the 180-degree turn in Houston.

In 2014, the Houston Texans rushed on 52% of all plays, the most run-heavy ratio in the N.F.L. The team rushed a league-high 551 times last season, as the Texans quickly self-identified as a power-running team in head coach Bill O’Brien’s first season in the league.

Instead, the Texans — through four games — have become one of the most pass-happy teams in N.F.L. history. Including sacks, Houston had 52 pass attempts against the Kansas City Chiefs in Week 1, 59 against the Carolina Panthers in Week 2 and 58 Sunday against the Atlanta Falcons. In the process, the 2015 Texans became the first N.F.L. team with more than 50 pass attempts (including sacks) in three of its first four games. The Texans have recorded 209 pass attempts (including sacks) through four games, also the most in league history.

You can read the full article here.  And check back later in the day for some equally astonishing stats to chronicle the turnaround by the Jets defense.

{ 1 comment }

Andre Johnson’s Career in Houston

For a change, Colts fans won't hate this guy

For a change, Colts fans won’t hate this guy

In twelve seasons in Houston, Andre Johnson gained 13,597 receiving yards. Johnson was drafted by the Texans with the 3rd overall pick in 2003, and has played every game of his career with Houston. That will change in 2015, as Johnson signed with the Colts in March.

Does that sound like a lot of yards to you? Put it this way: only Jerry Rice and Marvin Harrison have ever gained more yards in a 12-year period with one team. And Johnson is as synonymous with Houston as any wide receiver has been with any team (including Reggie Wayne, who Johnson will be replacing in Indianapolis). [continue reading…]

{ 24 comments }

Predictions in Review: AFC South

During the 2013 offseason, I wrote 32 articles under the RPO 2013 tag. In my Predictions in Review series, I review those preview articles with the benefit of hindsight. Previously, I reviewed the AFC West and the NFC West. Today, the AFC South, beginning with a straightforward case in Tennessee.

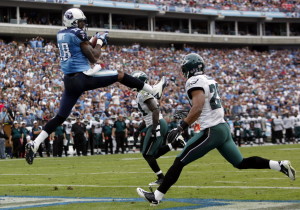
Britt smoked the Eagles secondary

Britt smoked the Eagles secondary.

Can Kenny Britt become the next great wide receiver?, July 9, 2013

Spoiler alert: Kenny Britt did not become the next great wide receiver, at least in 2013 (apparently, I still can’t quit him). Britt is an easy player to fall in love with, if you ignored the warning signs. He was just 20 years old when he played in his first NFL game in 2009. In 2010, he led all players in yards per route run according to Pro Football Focus, but his raw numbers underhwlemed because the Titans were a run-heavy team and Britt missed 30% of the season with a hamstring injury. In 2011, he matched his elite YPRR production, but a torn ACL/MCL tear ended his season after 94 pass routes.

He struggled in 2012, but I was willing to write that off due to recovering from the ugly knee injury, additional hamstring and ankle injuries, and a first-year starter in Jake Locker. That set up 2013 as a season where I thought Britt had great breakout potential. I interviewed Thomas Gower, of Total Titans and Football Outsiders, and asked him his thoughts. Gower was more pessimistic than I was about Britt, and for good reason.

As it turned out, Britt never seemed quite right mentally (in more ways than one); he struggled with drops and was eventually dropped behind Justin Hunter and Kendall Wright on the depth chart. He finished the year with 11 catches for only 96 yards and no touchdowns. In late December, Britt said he would definitely be a #1 wide receiver somewhere in 2014, which means I’m susceptible to falling into the Britt trap again. [continue reading…]

{ 2 comments }

Foster is thankful for a heavy workload.

Foster is thankful for a heavy workload.

Running back workload is a very difficult topic to tackle, and I don’t expect to make much of an indent into the subject today. But I do want to take a few minutes and look at some ways to measure heavy workloads. One school of thought is that the effect of carries is cumulative: Not only is a 25-carry game more likely to cause a running back trouble than a five-carry game, but it’s more than five times as likely to shorten a player’s shelf life. The cumulative effect of taking hit after hit means that carries 16, 17, and 18 hurt a runner more than carries 1, 2, and 3.

I don’t know if that’s true, but let’s investigate. First, I’m only giving a running back credit for his additional carries after his 15th carry of the game. So an 18-carry game goes down as a “3” and a 25 carry game is a “10.” Using this scoring system, Arian Foster had the highest number of “Carries over 15” from last season, with 117. Such a list mostly corresponds to the number of overall rushing attempts for a player, but the exceptions could be revealing.
[continue reading…]

{ 4 comments }

Is Arian Foster declining?

[House-keeping note: I’ve added the Salary Cap Calculator to the gray header tabs at the top of each page, so you can now easily get there no matter what page you’re on at Football Perspective.]

A quick look at Arian Foster‘s statistics over the last three years paints a picture of a player in decline:

Year G Rsh RshYd RTD YPC YPG C/G Rec RecYd YPR TD YScm RRTD
2010*+ 16 327 1616 16 4.9 101.0 20.4 66 604 9.2 2 2220 18
2011* 13 278 1224 10 4.4 94.2 21.4 53 617 11.6 2 1841 12
2012* 16 351 1424 15 4.1 89.0 21.9 40 217 5.4 2 1641 17


Foster’s declined in rushing yards per game and yards per carry over the last two years, while his value in the receiving game fell off a cliff in 2012. One could reasonably conclude that Foster simply isn’t the same player he used to be, and that he could drop off even more in 2013.  But while the traditional statistics tell one story, what do the advanced metrics say?
[continue reading…]

{ 20 comments }

Yesterday, I previewed Saturday’s games with um, mixed results (skip the Denver-Baltimore preview and just read the San Francisco-Green Bay breakdown twice). Let’s take another crack at it by examining Sunday’s matchups.

Seattle Seahawks (11-5) (+1) at Atlanta Falcons (13-3), Sunday, 1:00PM ET

An offense where the star eats Skittle is a young one

Did you know Marshawn Lynch eats Skittles?

Once again, Atlanta is tasked with facing a dominant wildcard team. Is this the year Matt Ryan finally silences his critics?

Atlanta is only a one-point favorite, just the seventh time a home team has been given such little respect this late in the season since 2000. Home teams are 3-3 when underdogs or small favorites over that span in the divisional conference championship rounds, although one of those losses came by the Falcons in 2010 against the Packers when Atlanta was a 1.5-point favorite. But let’s focus on these two teams, because the stats might surprise you.

Russell Wilson edges Matt Ryan in Y/A (7.9 to 7.7), AY/A (8.1 to 7.7), and passer rating (100.0 to 99.1), despite having a significantly worse set of receivers. Ryan does have the edge in NY/A (7.0 to 6.8) but the two are deadlocked in ANY/A at 7.0. Both quarterbacks led four 4th quarter comebacks this year, and Wilson led 5 game-winning drives while Ryan led six. Considering one quarterback has Roddy White, Julio Jones, and Tony Gonzalez, and the other is a 5’10 rookie, I consider this pretty remarkable.
[continue reading…]

{ 5 comments }

Season in review: AFC and NFC South

Last week I reviewed the seasons of the teams in the AFC East and NFC East and in the AFC North and NFC North. Today we’ll review the interesting seasons from the AFC and NFC South divisions.

In the AFC South, I had the bottom three teams projected for between 5 and 6 wins for a five week stretch starting after week two. As we now know, that was resolved quite definitively by the end of the year:

AFC South

Houston Texans

Pre-season Projection: 10 wins
Maximum wins: 14 (after week 15)
Minimum wins: 10 (after week 1)
Week 1 comment: Going to win the AFC South going away; this team could win 12 games, but concerns about injuries and the potential to rest starters late keep them at 10 wins for now.

A miserable December ruined what should have been a marvelous season in Houston. At no point did I project any of the other AFC South teams to finish within even three games of the Texans. When they were 5-0, I wrote: Not only do the Texans still have 6 home games remaining, but they have 4 more games against the AFC South and get the Bills and Lions. Even without Brian Cushing, I don’t see why they don’t win 8 more games.

The Texans schedule was easy, but they also had dominant seasons out of J.J. Watt and Andre Johnson. Left Tackle Duane Brown was outstanding, and Houston is as good as any other team in the league when they’re at their their best. Unfortunately, they might be undermanned in a gunfight with the Broncos or Patriots, and it looks like now they’ll have to beat both of those teams to get to New Orleans. Still, I give the Texans a fighting chance; Matt Schaub has struggled in primetime games, but that doesn’t really mean anything. In the end I think the week 17 loss submarined their playoff hopes, and the team will be left wondering how good they could have been if Cushing stayed healthy.

Indianapolis Colts

Pre-season Projection: 5.5 wins
Maximum wins: 10 (after week 12 through the end of the year)
Minimum wins: 4 (after week 1)
Week 1 comment: There will be growing pains in Indianapolis. But nobody feels bad for their fans, nor should they; the Colts will be contenders each year for a decade, starting next season.

I never got on board with the Colts this year and it only looks worse in retrospect. On the other hand, even though Indianapolis finished 11-5, they were still outscored by 30 points in 2012. They struggled to beat Brady Quinn and the Chiefs and split with the Jaguars. The Colts won just two game by more than a touchdown.

While I missed on the Colts overall, I was on board the Andrew Luck bandwagon early on even when his numbers were terrible. I wrote this before the Colts-Packers game: Andrew LuckAaron Rodgers I won’t steal the spotlight from Tom BradyPeyton Manning XIII; by the time these two teams play again in four years, we may be looking at the best two quarterbacks in the league. I highlighted how Luck was being undervalued by conventional statistics after week 7, and wrote this after week 8: A wildcard darkhorse? I don’t think the Colts are very good — they’re just 29th according to Football Outsiders — but a win over Miami this weekend puts them in the driver’s seat. I finally projected them at 10 wins after week 12, and noted: Basically clinched a playoff berth with win over Buffalo and Steelers loss. Hard not to like this team.

They may not be very good, but they certainly are likeable. Even after the upset win over the Texans, Houston is just the 10th team to make the playoffs after being outscored by at least 30 points.
[continue reading…]

{ 2 comments }

You’re probably hearing a lot right now about how Matt Schaub is not a primetime player — literally. Schaub and the Texans struggled in embarassing losses on Sunday Night Football to the Packers earlier in the season and on Monday Night Football two days ago to the Patriots. Schaub posted terrible numbers in a defensively-driven 13-6 win over the Jay Cutler/Jason Campbell Bears.

For his career, Schaub is 2-5 (0.286 winning percentage) in night games and 41-31 (0.569) in day games. Among the 24 quarterbacks studied (more on that below), that drop in winning percentage is the largest such decline. You might think this is due to facing better defenses in night games, but that’s not really the case.

Schaub has averaged 7.8 Adjusted Yards per Attempt during day games and 6.0 AY/A during night games; that difference of 1.8 AY/A is the second largest among the twenty-four quarterbacks.

So yes, there is no debate: Schaub has been noticeably worse during night games in his career.

The table below shows all quarterbacks who have started a game this season and that have started at least five night games in their career. The data consist of all games throughout their career in which they were the starter. To make it a little easier to read, I’ve shaded the day and night categories differently:

QBD_W/LD_WIN%D_Y/AD_AY/AN_W/LN_WIN%N_Y/AN_AY/AY/A_DIFFAY/A_DIFFWin%_Diff
Jason Campbell28-310.4756.936.653-90.255.754.77-1.18-1.88-0.225
Matt Schaub41-310.5697.937.792-50.2866.946-0.99-1.79-0.284
Jay Cutler37-280.5697.36.8413-140.4817.16.08-0.2-0.76-0.088
Joe Flacco46-210.6877.116.912-70.6326.646.19-0.47-0.71-0.055
Ben Roethlisberger67-270.7137.947.7929-140.6747.857.14-0.09-0.65-0.038
Matt Ryan47-190.7127.197.037-50.5836.636.4-0.56-0.63-0.129
Carson Palmer48-580.4537.256.745-100.3336.556.27-0.7-0.47-0.119
Matt Cassel25-290.4636.596.114-50.4446.355.65-0.24-0.46-0.019
Matt Hasselbeck75-720.516.886.4210-60.6256.96.220.02-0.20.115
Aaron Rodgers40-200.6678.218.6814-70.66788.49-0.21-0.190
Alex Smith31-320.4926.616.078-50.6156.325.91-0.29-0.160.123
Sam Bradford13-200.3976.215.791-40.26.335.710.12-0.08-0.197
Michael Vick43-380.536.976.5515-80.6527.066.520.09-0.030.122
Mark Sanchez29-200.5926.645.828-90.4716.425.83-0.220.01-0.121
Tony Romo35-270.5657.77.6720-120.6258.177.740.470.070.06
Eli Manning61-390.617.136.5424-190.5586.966.68-0.170.14-0.052
Matthew Stafford16-210.4326.876.511-50.1677.476.90.60.39-0.266
Peyton Manning120-620.6597.587.3940-180.697.77.790.120.40.03
Tom Brady112-300.7897.397.4938-140.7317.557.90.160.41-0.058
Byron Leftwich21-240.4676.5163-30.56.656.470.140.470.033
Philip Rivers51-350.5937.87.5320-100.6678.18.130.30.60.074
Drew Brees79-620.567.397.1823-110.6767.77.840.310.660.116
Charlie Batch16-270.3726.725.789-30.757.738.221.012.440.378
Chad Henne12-170.4146.35.172-30.48.057.811.752.64-0.014

[continue reading…]

{ 3 comments }

NYT Fifth Down: Post-week 12

My article for the New York Times this week takes a look at one interesting statistic for each of the eight division winners.
 

Atlanta Falcons – Record in Close Games
In 2010, Atlanta raced to a 10-2 record on the strength of an improbable 7-1 record in games decided by 7 or fewer points. How a team fares in close games has a heavy impact on a team’s final record, but statisticians agree that such a metric holds little predictive value. The Falcons earned the No. 1 seed in the N.F.C. thanks to their success in close games, but ranked only seventh in the Football Outsiders advanced statistical rankings and 21st in the Advanced NFL Stats efficiency ratings. Atlanta lost badly in its playoff opener, not surprising to those who felt the Falcons’ record was more mirage than reality.

This season, Atlanta has raced to a 10-1 record on the strength of an improbable 7-1 record in games decided by 7 or fewer points. Football Outsiders ranks the Falcons 12th, and according to its founder, Aaron Schatz, the Falcons have by far the worst efficiency rating of any of the 18 teams that have started 10-1 since 1991. Advanced NFL Stats is slightly more generous, placing the Falcons fifth, although the gap between the fifth and 12th teams in its rating is miniscule. The takeaway: Don’t get caught up in the Falcons’ record. It will give Atlanta a bye, but no other guarantees come with it.

San Francisco – Top Pass Defense in the N.F.L.

Last season, the 49ers’ reputation for having an elite defense was built on their superb run defense, which ranked first in rushing yards allowed, rushing yards per carry allowed and rushing touchdowns allowed. But the 49ers were not dominant against the pass, ranking ninth in net yards per pass attempt allowed. This season, the San Francisco defense is without weakness.

The 49ers (8-2-1) actually lead the N.F.L. in net yards per pass attempt allowed. In the process, the 49ers lead the N.F.L. in points allowed, and their defense ranks in the top three in both first downs allowed and Pro-Football-Reference’s Expected Points Added statistic. The run defense remains stout, ranking in the top four in yards, yards per carry and touchdowns allowed, but the improvement in the pass defense makes this an even better defense than the 2011 version. As long as San Francisco continues to shut down opposing passers, it won’t matter very much whether Coach Jim Harbaugh picks Alex Smith or Colin Kaepernick at quarterback.

Chicago – 11th in Points Scored Without an Offense

As a technical matter, the Bears (8-3) rank 11th in points scored. Just don’t let anyone tell you that in the context of a story about how Chicago’s offense is underrated. The Bears have scored eight non-offensive touchdowns this season — seven on interception returns, one on a blocked punt — and their great defense and special teams consistently set up the offense for success even when those units aren’t scoring touchdowns. Chicago is in the bottom five in Net Yards per Attempt, Adjusted Net Yards per Attempt, total yards and sacks allowed. The Bears’ running game benefits from a high number of carries, but ranks below average in both yards per carry and PFR’s Expected Points Added statistic.

The defense is excellent, but a poor offensive line and mediocre wide receiver talent behind Brandon Marshall leave the Bears with one of the worst offenses in the N.F.L. — regardless of how many points they’ve scored. Advanced NFL Stats ranks the Bears’ offense as the second worst in the league.

You can read the full article here.

{ 5 comments }

Gary Kubiak.

Gary Kubiak doesn’t have a personality like a Ryan or a Harbaugh. He hasn’t been profiled to death like Andy Reid or Norv Turner. He doesn’t have the rings of Mike Tomlin or Bill Belichick. If not for the simple fact that he’s been in Houston forever, I’m not sure if most NFL fans could even name the head coach of the Texans. But his coaching career has been a fascinating one that leaves me with more questions than answers.

In January 2011, I wrote that Kubiak and Jack Del Rio were given incredibly long leashes in the AFC South. From 1970 to 2010, only four head coaches had (a) finished with a .500 or worse record in four out of five seasons with the same team, (b) finished with a .500 or worse record in the fifth season, and (c) were retained to coach for a sixth season. The four head coaches — Marvin Lewis, Dan Reeves, Bart Starr, and John McKay — all had extenuating circumstances for their failures, which differentiated them from Del Rio and Kubiak, who were about to become the fifth and sixth such coaches.

Things have changed dramatically in 22 months. The Jaguars have changed owners, head coaches, and quarterbacks, and likely will have a new general manager soon, too. Meanwhile, the Texans still have the same four men — Bob McNair, Rick Smith, Kubiak and Matt Schaub — in the four most prominent roles in the organization. Houston’s one big move, hiring Wade Phillips as defensive coordinator, has worked perfectly. Phillips has turned a dreadful Houston defense into one of the best units in the league.

The outlook is so promising in Houston that it’s easy to forget where things stood less than two years ago. Following a loss to the Tim Tebow-led Broncos — this was the year before Tebow-mania took the NFL by storm — most of the football world assumed the firing of Kubiak was a fait accompli. John McClain, a veteran writer in Houston for over 30 years, tweeted: “After the way the Texans blew Denver game leading 17-0 at halftime and 23-10 in the 4th quarter, I’ll be stunned if the staff isn’t fired.” McLain was so disgusted that he added, “I’ll say it again: The Texans have the worst pass defense in the history of football at any level since the beginning of time.”
[continue reading…]

{ 19 comments }

The San Francisco 49ers were the breakout team of the 2011 season, going from 6-10 in 2010 to 13-3 last year. The Cincinnati Bengals were the surprise team of the AFC, jumping from four to nine wins and earning a playoff berth. The Houston Texans, Detroit Lions, and Denver Broncos all made the playoffs after notching four more wins in 2011 than they had in 2010. But could you have known after just one week that those teams were on track for such breakout seasons? Let’s review.

San Francisco 49ers 33, Seattle 17

The 49ers were Super Bowl contenders as long as Ginn was returning punts.

This was an odd game, and Jason McIntyre explains why:

San Francisco had just 12 first downs and 209 yards … but still beat the Seahawks by 16 points. The real reason the 49ers won was because Ted Ginn ran a punt and kickoff back for touchdowns in a span of 59 seconds. But offensively, Frank Gore averaged 2.7 ypc and Alex Smith threw for just 124 yards. San Francisco had the ball for 31 minutes and mustered only 12 first downs. As bad as the 49ers looked offensively, the defense did sack T-Jack five times and generate three turnovers. But if the 49ers couldn’t move the ball against a mediocre Seahawks defense … what will they be able to do against the Cowboys, which annihilated the Jets’ offensive line Sunday night? The 49ers have opened as 3-point dogs against Dallas next weekend … I humbly suggest loading up on Romo in that one. No word if San Fran will be without Michael Crabtree.

The 49ers offense wasn’t impressive, but San Francisco’s defense and special teams were dominant. That formula proved to work all season, although few expected it to work against teams better than Seattle. At the time Seattle was considered one of the worst teams in the league (they were a 14-point underdog in Pittsburgh the following week), which made the victory look even less impressive. After week one, Jason Lisk unveiled his Week 1 Power rankings, placing NFL teams into seven tiers. The 49ers were placed in Tier 6 with the comment “When you need two returns by Ted Ginn to put away the Seahawks, you are not good.” ESPN’s power rankings placed San Francisco at #22.

Cincinnati 27, Cleveland 17
This was an ugly game that caught almost nobody’s attention. The big stories of the game were the officiating and the performance of Bruce Gradkowski, who came and led Cincinnati to a win after Andy Dalton was injured. Many in Cleveland blamed the referees, as the Browns were flagged for 11 penalties, compared to just three for Cincinnati. And on the game’s pivotal play — a 41-yard touchdown to A.J. Green — the Browns were still in their defensive huddle at the start of the play, and later argued that the quick snap wasn’t a legal play. The Bengals defense was excellent, shutting down Peyton Hillis and Colt McCoy, but many thought that was simply a product of the schedule. Suffice it to say, no one was boarding the Bengals’ bandwagon after week one. Lisk placed Cincinnati in Tier 5: “Still not sold here, especially if Bruce Gradkowski is QB. Haden shut down Green until the play where he was uncovered at the snap, and Benson’s numbers boosted by a late TD run.” ESPN ranked the Bengals 30th… and the Browns 32nd. The Bengals would lose in Denver and in San Francisco the next two weeks, dropping to 1-2.
[continue reading…]

{ 1 comment }

The best rookie season and best career from the class of '89.

Yesterday, I looked at how frequently the highest drafted rookie running back ended leading his draft class in rushing yards. Today, we’ll examine how often the best rookie running back ends up being having the most career rushing yards among the members from his class.

I performed this same exercise at wide receiver, and concluded that as great as A.J. Green was last season, the odds were stacked against him leading the 2011 rookie receiver class in career receiving yards. [1]From 1978 to 2008, only three of the 31 wide receivers with the best rookie seasons ended up with the most receiving yards from their class. For whatever reason, there simply is not a strong correlation between rookie performance and career performance for wide receivers. Is the same true at the running back position?

There was an eleven-year stretch from ’92 to ’02, when Ricky Watters, Jerome Bettis, Marshall Faulk, Curtis Martin, Eddie George, Corey Dillon, Fred Taylor, Edgerrin James, LaDainian Tomlinson, and Clinton Portis each led their class in rushing yards both as rookies and over the course of their careers. The lone exception came in 2000, when Mike Anderson nudged by Jamal Lewis to lead the ’00 class in rookie rushing yards, while Lewis ended with the most career rushing yards. If I had written this article a decade ago, I would have thought that unlike at the receiver position, there was an extremely strong correlation between rookie and career performance for the top running backs.

But since then, things have changed. Domanick Williams (Larry Johnson), Kevin Jones (Steven Jackson), Cadillac Williams (Frank Gore), Joseph Addai (Maurice Jones-Drew), Steve Slaton (Chris Johnson), and Knowshon Moreno (Arian Foster) led all rookies in rushing yards but have been passed in the career category by another back from the same rookie class. It’s too early to get a handle on the last two draft classes, although I certainly wouldn’t take even odds on either Ben Tate or LeGarrette Blount finishing with the most career rushing yards of any running back who entered the league in either 2010 or 2011.

The table below shows the top rookie running backs and the top career running backs from each class since 1978.
[continue reading…]

References

References
1 From 1978 to 2008, only three of the 31 wide receivers with the best rookie seasons ended up with the most receiving yards from their class.
{ 0 comments }

2011 Age-adjusted team rosters

Measuring team age in the N.F.L. is tricky. Calculating the average age of a 53-man roster is misleading because the age of a team’s starters is much more relevant than the age of a team’s reserves. The average age of a team’s starting lineup isn’t perfect, either. The age of the quarterback and key offensive and defensive players should count for more than the age of a less relevant starter. Ideally, you would want to calculate a team’s average age by placing greater weight on the team’s most relevant players.

That’s not easy to do for the 2012 season, but we can apply one method to last year’s rosters. Using Pro-Football-Reference’s Approximate Value system, it’s simple to calculate the weighted age of every team last season, by weighing each player’s age proportionately to his percentage of contribution (as measured by the Approximate Value system) to his team.

Let’s take a look at the (weighted) average age of each offense last season:

Offense

RkTeamAvg Age
1Seattle Seahawks25.7
2Tampa Bay Buccaneers25.7
3Denver Broncos25.9
4Jacksonville Jaguars26.0
5Cleveland Browns26.1
6Pittsburgh Steelers26.2
7Cincinnati Bengals26.3
8San Francisco 49ers26.4
9Green Bay Packers26.4
10Buffalo Bills26.5
11Dallas Cowboys26.6
12Miami Dolphins26.6
13Arizona Cardinals26.7
14Oakland Raiders26.7
15Philadelphia Eagles26.8
16Carolina Panthers26.9
17Chicago Bears26.9
18Minnesota Vikings27.1
19New York Giants27.1
20Baltimore Ravens27.3
21St. Louis Rams27.3
22New York Jets27.3
23Detroit Lions27.4
24Washington Redskins27.4
25Kansas City Chiefs27.6
26New Orleans Saints27.6
27Houston Texans27.7
28San Diego Chargers27.7
29Tennessee Titans27.8
30Atlanta Falcons28.1
31Indianapolis Colts28.4
32New England Patriots28.4

An offense where the star eats Skittle is a young one

It’s not too surprising to see Seattle at the youngest team in the league last year, and they look to have a young offense again in 2012. The Seahawks will get younger at quarterback if either Matt Flynn or Russell Wilson replaces Tarvaris Jackson. At wide receiver, Sidney Rice (26 in 2012), Doug Baldwin (24) and Golden Tate (24) are the projected top three, although the team just added 29-year-old Braylon Edwards. Marshawn Lynch is still just 26, and the Seahawks added Utah State’s Robert Turbin in April’s draft. The offense line, anchored around LT Russell Okung (25) and C Max Unger (26), has all five starters under the age of 30, as are both Zach Miller and Kellen Winslow, Jr..

The Patriots, meanwhile, featured the league’s oldest offense last season. We all know about Tom Brady (34 in 2011) and Wes Welker (30), but Brian Waters (35), Matt Light (34), Logan Mankins (29), and Deion Branch (32) made were older members of the Patriots’ supporting cast. New England has a pair of young tight ends (Rob Gronkowski, Aaron Hernandez) and young running backs (Stevan Ridley, Shane Vereen), but the rest of the offense remains old. Obviously Brady and Welker continue to play at a high level, but the team didn’t wasn’t focused on age when it added wide receiver Brandon Lloyd (32).
[continue reading…]

{ 10 comments }