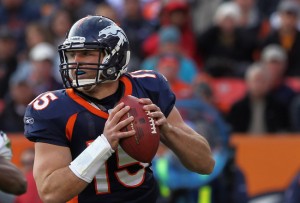
The table below lists the final home start for over 400 retired (or close to retired) quarterbacks (the default is to show just 25 quarterbacks, but the table is fully sortable and searchable, and you can change the number of players displayed by using the drop-down box on the left). For each quarterback, I have provided a link to the boxscore from that game, the result of the game, and the quarterback’s passing and rushing statistics. If Tebow is in fact retired, he will have finished with the highest Adjusted Yards per Attempt (minimum 10 attempts) of any player in his last home start:
[continue reading…]
In 2011, the Broncos scored 309 points and allowed 390 points. Despite being outscored by 81 points, the Tim Tebow express still made it into the post-season. In June, I speculated that the 2012 Broncos might set the record for the largest increase in pass completions in one year, and they did just that on Sunday. They also moved into fourth place on another list.
With 481 points and 289 points allowed, Denver outscored its opponents by 192 points in 2012. Peyton Manning and Von Miller have turned the Broncos into one of the best teams in the league a year after they were one of the worst (at least, as measured by points differential). Denver improving their points differential by a whopping 273 points this year relative to 2011, the fourth largest increase in football history.
Scott Kacsmar, friend of Football Perspective and the leading writer on quarterback comebacks, noted that Andrew Luck has 5 game-winning drives in his first 12 games. Where does that rank historically?
To be clear, game-winning drives are not an official statistic, and while Kacsmar has gone through thousands of games to record data on the subject, we can’t confirm that the below list in 100% complete. With that disclaimer out of the way, the table below displays all quarterbacks with at least 3 game-winning drives in their first 12 NFL games:
Luck’s career trajectory looks to be on a much better path than Tebow, Jay Schroeder or John Skelton, but hey, I don’t make the trivia, I just present it.
The table below shows how many game-winning drives were led by quarterbacks in their first 12 starts. Thanks to Scott Kacsmar and Pro-Football-Reference.com for the data.
[continue reading…]
Yesterday, I rolled out Game Scripts, a way to measure the flow of every game since 1940. The sum of each team’s Game Script in each game can be used to give us an average Game Script score on the season. You might think that this number would be a good proxy for how dominant a team was, and that’s largely true: the teams with the highest game script scores tend to have been the most dominant teams. However, there are some reasons to be cautious with this approach: game scripts are not adjusted for strength of schedule and in any given game, the losing team can end up with a better score than the winning team. That said, here are the teams with the highest Game Scripts since 1940:
The teams with the highest game scripts last year? Green Bay (7.4), New Orleans (5.6) and Houston (5.4), while the Rams (-6.4), Colts (-7.2), and Bucs (-8.7) were at the bottom of the league. But let’s get to the real point of using Game Scripts — to help put passing and rushing ratios in context.
Last year, the Buccaneers had the second highest effective pass/run ratio in the league (defined as total pass attempts divided by rushes plus total pass attempts, but with all kneels and spikes excluded). But that’s misleading, because Tampa Bay had the worst Game Script in the league. Conversely, were Houston and San Francisco really the second and third most run-heavy teams in the NFL last year? The table below lists each team from highest to lowest pass/run ratio:
[continue reading…]
I spent the weekend in Cortland, New York covering Jets training camp. So what should we expect from the Jets this year? As the team enters its fourth season under Rex Ryan, it’s impossible to look at the 2012 season without putting it in the context of the Ryan’s other Jets teams. And while the Sanchez/Tebow stories will dominate the media’s attention, in reality, the defense and the running game will be the key elements of the 2012 Jets.
Defense
The table below lists the 15 major contributors for the Jets for each year since 2009. Ryan’s defenses are some of the most exotic in the league, and the Jets often have placed six or seven defensive backs on the field at one time. In addition to nickel corner and the third safety, I’m including a fourth defensive lineman slot and a “Designated Pass Rusher” position, a third down specialist and staple of the Ryan defense.
[continue reading…]
I’ll be spending the weekend in Cortland, New York, covering Jets training camp. The big story there, of course, will be how the Mark Sanchez/Tim Tebow drama unfolds. The party line among media members is that the duo is doomed to fail, because a team with two quarterbacks doesn’t have one.
Last year, Mark Sanchez ranked 27th in Net Yards per Attempt, so the Jets were behind the 8-ball at the quarterback position well before the Tebow trade. Not that he’ll necessarily help things: Tebow averaged even fewer net yards per attempt than Sanchez in 2011, although arguably his numbers should be viewed in a more positive light.
In my view, the Tebow trade simply gives the Jets more chances to succeed, not unlike when a team throws multiple late round picks at the same position. The most tired complaint regarding the situation is that if Sanchez has a bad drive, quarter or game, fans will call for Sanchez’ head and the Jets will bring in Tebow. But such analysis never goes beyond that. If the Jets do make Tebow the starting quarterback, and he does well, that’s a good thing. If the Jets bring in Tebow, and he fails, New York can go back to Sanchez. At that point, even if Sanchez has some struggles, the calls for Tebow will be muted. However, some will argue that if Sanchez is benched even once his confidence will be shot.
You may find it absurd to suggest that benching a professional athlete may be enough to derail a great career; in fact, that’s what I originally thought. But after combing through the annals of NFL history, I’m unable to find any proof in the other direction. Truth be told, I do think having two quarterbacks is essentially the football kiss of death. Don’t believe me? Let’s take a stroll down memory lane.
In the early ’50s, the Los Angeles Rams alternated Norm Van Brocklin and Bob Waterfield as their quarterbacks. In 1950, the team averaged 38.8 points per game while each quarterback started six games, and Los Angeles won the championship the next season. But while both Van Brocklin and Waterfield would end up in the Hall of Fame, neither player is well known today by most fans.
A few years later, the Giants would have Don Heinrich as the nominal starter for the first series or two before having Charlie Conerly come in and replace him one the coaching staff had a better read on the opposing defense. Sure the team won the NFL championship in 1956 using this method, but New York ultimately lost the championship to Baltimore in both ’58 and ’59, and neither Heinrich nor Conerly were able to slow down Johnny Unitas in either gmae. In John Eisenberg’s great book on the late ’50s Green Bay Packers, he explained how Vince Lombardi treated Bart Starr like a yo-yo, inserting him and out of the lineup. And while Starr would achieve some success in the ’60s, he ultimately failed as head coach of the Packers in the ’70s and ’80s, going 52-76-3 in 9 uneventful seasons.
[continue reading…]
Happy 4th of July! Before you head to your barbecue, I’d recommend you take a look at the incredible document our founders signed 236 years ago.
As far as football goes, today’s a good time for a data dump. The table below shows the career passing leaders for each franchise, organized by when the current leader last played for that team.
Fifteen days into its infancy, Football Perspective has published fifteen posts. If you are enjoying the site, be sure to check back every day for a new post. You can also become one of the 850+ people to “like” Football Perspective on Facebook. You can also follow me on twitter. Enough of a site update: on to today’s post.
Unlike most sports writers, I don’t know a lot about what will happen this season. But there’s one thing I do know: the Denver Broncos aren’t going to rank 32nd again in pass attempts again. The Tebow Broncos, an offense with an inexperienced quarterback and a confused offensive coordinator, completed just 217 passes last season. That was the lowest in the league, and the lowest since the ’09 Jets, a team that boasted the number one rushing attack and defense in the league — and Mark Sanchez.
Setting aside those years where the league scheduled more games in the following season, the table below shows the teams with the largest increase in completions from one year (that’s the year listed in the table) to the next:


