≡ Menu

Rob Gronkowski, Tom Brady, and WOWY Stats

Tis better to be with Gronk than without.

Rob Gronkowski played for the New England Patriots from 2010 to 2018. It was one of the wildest and most celebrated rides in NFL history. But today I want to build on the great work done by Adam Harstad and analyze Gronk’s career through the lens of how Tom Brady fared — with and without Gronk. [1]As always, thanks to Adam for the inspiration and much of the methodology behind this post. For defining what is included in my data set, please jump to the end of this post to see how Gronk games and non-Gronk games are defined.

I am going to not going to spend much time discussing Gronk’s first and last seasons, for two reasons. In 2010, rookie Gronk was not yet Gronk(TM); he also didn’t miss any games. And 2018 Gronk was BrokenGronk; outside of 2010 and 2018, he was pretty much always a dominant force when healthy.

So let’s focus on the prime 7 years of Gronk’s career. In 2011, 2014, and 2015, Gronkowski was almost always healthy. There was only one missed game of note there, and it was one where Brady and the entire Patriots team struggled. [2]Technically there was a second missed game, but it was a week 17 game where Gronkowski sat out to rest and Brady only played a half. In those three seasons, Gronkowski was a unanimous first-team All-Pro selection each season among major voting publications.

So, for WOWY purposes — that is, With Or Without You — the seasons we have to analyze for Gronkowski and Brady are 2012, 2013, 2016, and 2017. And the results are staggering in each year.

2012

The Patriots had 10 Gronk games and 8 non-Gronk games this season, which ended in a loss without Gronk to the Ravens in the AFC Championship Game. The stats:

  • In the Gronk games, New England had a 0.700 winning percentage, averaged 35.8 (!) points per game, picked up 28.4 first downs and 16.4 passing first downs per game, and the passing offense averaged 7.73 Adjusted Net Yards per Attempt (ANY/A).
  • In the non-Gronk games, New England had a 0.750 winning percentage, averaged 31.6 points per game, picked up 26.5 first downs and 15.8 passing first downs per game, and averaged 6.84 ANY/A.

Notably, that’s a difference of 4.2 points per game and 0.89 ANY/A per game without Gronk. And while the record was slightly worse, it’s worth noting that the three losses came by a combined four points.

2013

The Patriots had 7 Gronk games and 11 non-Gronk games this season, which ended in a loss without Gronk in the AFCCG to the Broncos.  The stats:

  • In the Gronk games, New England had a 0.714 winning percentage, averaged 32.0 points per game (and allowed 27.1 PPG), picked up 26.6 first downs and 16.3 passing first downs per game, and averaged 6.98 ANY/A.
  • In the non-Gronk games, New England had a 0.727 winning percentage, averaged 25.4 points per game (and allowed 17.8 PPG), picked up 21.3 first downs and 12.3 passing first downs per game, and averaged 5.64 ANY/A.

The offense nearly fell apart without Gronk, dropping 6.6 points per game and gaining 5.3 fewer first downs.  The passing offense declined by 1.34 ANY/A. And while I presume this is mostly (all?) due to randomess, this begins a trend of New England allowing significantly fewer points in non-Gronk games. Which is just weird.

2016

The Patriots had 5 Gronk games and 10 non-Gronk games this season — which was perhaps Brady’s best season outside of ’07.  New England won the Super Bowl without Gronkowski.  The stats:

  • In the Gronk games, the Patriots posted a 4-1 record [3]With Gronk unable to haul in the game-tying touchdown catch, or the victim of pass interference, depending on your perspective., averaged 32.0 points per game (and allowed 20.4 PPG), picked up 23.6 first downs and 13.8 passing first downs, and had a ridiculous 9.93 ANY/A average.
  • In the non-Gronk games, the Patriots went 1o-0, averaged 30.4 points per game (and allowed 14.8 PPG), picked up 24.0 first downs and 14.9 passing first downs, and averaged 7.67 ANY/A.

It’s hard to argue with 10-0, and the team gained more first downs without Gronk… but the record was driven in large part by that defense, too.  The Patriots averaged 1.6 more points per game with Gronk and 2.26 ANY/A per game with Gronk.  In the 5 Gronk games, Brady’s stat line was just ridiculous, and the offense scored 20 touchdowns and had just 18 punts and one interception. That was, of course, an unsustainable pace, but it just highlights how dominant Brady and Gronk were in ’16; in the 10 non-Gronk games, the offense had 34 touchdowns and 47 punts. In these 5 games, Gronkowski caught 24 passes for 19 first downs, 529 yards and 3 touchdowns.

2017

The Patriots had 16 Gronk games and 3 non-Gronk games this season, which ended with a loss in the Super Bowl to the Eagles (but don’t blame the Patriots passing attack or Gronkowski, who had 116 yards and 2 touchdowns). The stats:

  • In the Gronk games, the Patriots had a 0.813 winning percentage, averaged 30.4 points per game, picked up 25.8 first downs and 15.7 passing first downs, and averaged 8.22 ANY/A.
  • In the non-Gronk games, the Patriots went 2-1, averaged 21.0 points per game, picked up 19.7 first downs and 13.3 passing first downs, and averaged 5.81 ANY/A.

That sounds like a huge drop — 9.4 points per game and 2.42 ANY/A — but the sample size is small.  Brady played poorly in the two regular season non-Gronk games, an upset loss to Miami and a narrow win over Tampa Bay.   Those were two of his worst games of the season, which probably wasn’t just a coincidence. I don’t want to make much out of a 3-game sample size, but putting aside the magnitude, the direction is consistent with other years.

Gronk WOWY Stats

Here are the full stats for Brady and the Patriots offense in each season, in both Gronk games (top rows) and non-Gronk games (bottom rows).

What Is A Gronk Game and What is Not A Gronk Game?

Finally, let me explain how I identified what is a Gronk game and what is not a Gronk game. Let’s work in reverse order:

  • 2018: Gronk missed the games in weeks 8, 10, and 11 due to ankle and back injuries.  While he was not necessarily his former self, he played in at least 67% of the snaps in every other game this season.
  • 2017: Gronk missed 3 games here.  He missed a game on a short week against the Bucs due to a thigh injury, was suspended for the second Dolphins game, and suffered a concussion in the first half against the Jaguars in the AFC Championship Game.  He finished that game with just 1 target and 26 snaps, representing 41% of the team’s snaps.  I am counting this as NOT a Gronk game (which the Patriots won).  Note that in the regular season finale against the Jets, Gronk played most of the game (68% snaps) but functioned solely as a blocker: he did not record a single target. That still counts as a Gronk game, as it was more importantly for the Patriots offense, a Bryce Petty game.
  • 2016: Gronk missed the first two games of the season with a hamstring injury, and played just 11 snaps (blocking on 10 of them) in the week 3 game against Houston.  However, I am going to exclude all of the first four games of the 2016 season for New England, since Brady was suspended; those games are eliminated from this study and don’t count as a Gronk game or a non-Gronk game, since we are analyzing Brady’s WOWY stats. Then in week 12 against the Jets, Gronk suffered a season-ending back injury and played just 7 snaps. New England won, 22-17; this game is counting as NOT a Gronk game. So games 5 through 9 are the only Gronk games this year.
  • 2015: Gronkowski missed one game (against the Eagles) due to a knee injury.
  • 2014: Gronkowski began the year missing the preseason as he recovered from a torn ACL/MCL (more on this below); he wound up playing between 40 and 45% of the Patriots offensive snaps the first two weeks, where New England went 2-0.  I am counting these games as Gronk games (he had 17 combined targets), but just wanted to note the injury.  Gronkowski sat out the week 17 game, which would normally mean that’s a non-Gronk game.  But because the Patriots had clinched the #1 seed before the week 17 game and Brady only played for the first half, so I am excluding that game as a non-Gronk game, too.  That is the fifth and final game in this study I am eliminating entirely (along with the four suspension games for Brady).
  • 2013: Gronkowski suffered a season-ending knee injury on a hit by T.J. Ward early in the 3rd quarter of a week 14 game against the Browns.  Since Gronk played 49% of the snaps and made it into the third quarter, I will still count this as a Gronk game (as opposed to the Jaguars AFCCG).
  • 2012: Gronk broke his forearm late in a win over the Colts in week 11; that game counts as a Gronk game.  However, he barely played (31% of snaps) in his return, a tune-up, week 17 game to get ready for the playoffs, and then re-injured his arm seven snaps into the team’s first playoff game.  He would miss the rest of the season.  Both of those final two games are being counted as non-Gronk games. Therefore, the first 10 games of ’12 were Gronk games, and the last 8 games were non-Gronk games.
  • 2011: No missed games.
  • 2010: No missed games.

As always, please leave your thoughts in the comments.

References

References
1 As always, thanks to Adam for the inspiration and much of the methodology behind this post.
2 Technically there was a second missed game, but it was a week 17 game where Gronkowski sat out to rest and Brady only played a half.
3 With Gronk unable to haul in the game-tying touchdown catch, or the victim of pass interference, depending on your perspective.
{ 0 comments }

Drew Brees Has The Most Touchdowns In NFL History

Drew Brees had yet another remarkable game today. The 40-year-old threw five touchdown passes and rushed for another on a sneak from the 1-yard line. The future Hall of Famer has now thrown 537 touchdowns in his regular season career, rushed for another 23, and even caught one (from LaDainian Tomlinson back in 2003).

That gives Brees 561 career touchdowns, the most in regular season history.

Most career total touchdowns:

1. 561 – Brees (537 passing, 23 rushing, 1 receiving)
2. 558 – Tom Brady (536 passing, 22 rushing)
3. 557 – Peyton Manning (539 passing, 18 rushing)

Back in the 2018 offseason, I wrote that Brady and Brees were in a close race to dethrone Manning as the all-time career passing touchdowns king. Both players finished the 2015 season tied with 428 career touchdown passes. They finished the 2017 season tied again with 488 career touchdown passes. And after week 14 of the 2019 season, Brees is up on Brady 537-536. Brees is about year and a half younger than Brady, and is playing better this season; the odds are Brees will be the one who ultimately retires as the all-time passing touchdowns king. But it’s still a toss-up as to who breaks Manning’s record first, even if today Brees set a similar record that almost nobody noticed.

Coming up next: Brees and the Saints host the Colts on Monday Night Football in week 15, and Brees will be a strong favorite to throw passing touchdowns 539 and 540 in that game.  A home game on primetime? Yes, Brees will be gunning for the record books. That said, the Patriots face the Bengals the day before, and I wouldn’t put it past Brady to throw 4 touchdowns in that game, too, being the first to break the record.  This may turn into a McGwire/Sosa race after all.

{ 0 comments }

The Patriots And The Point Spread Under Tom Brady

Tomorrow, the Patriots will be 15-point favorites to win on the road in Washington. This is the third time in four weeks that New England is favored to win by more than two touchdowns. The Patriots had been favored in 69 consecutive games until the 2018 AFC Championship Game, but the Patriots have quickly resumed their usual role as favorites.

The graph below shows the point spread in every Patriots game since 2001. The games are colored based on whether it was a regular season game, a playoff game, or a game without Tom Brady. [continue reading…]

{ 0 comments }

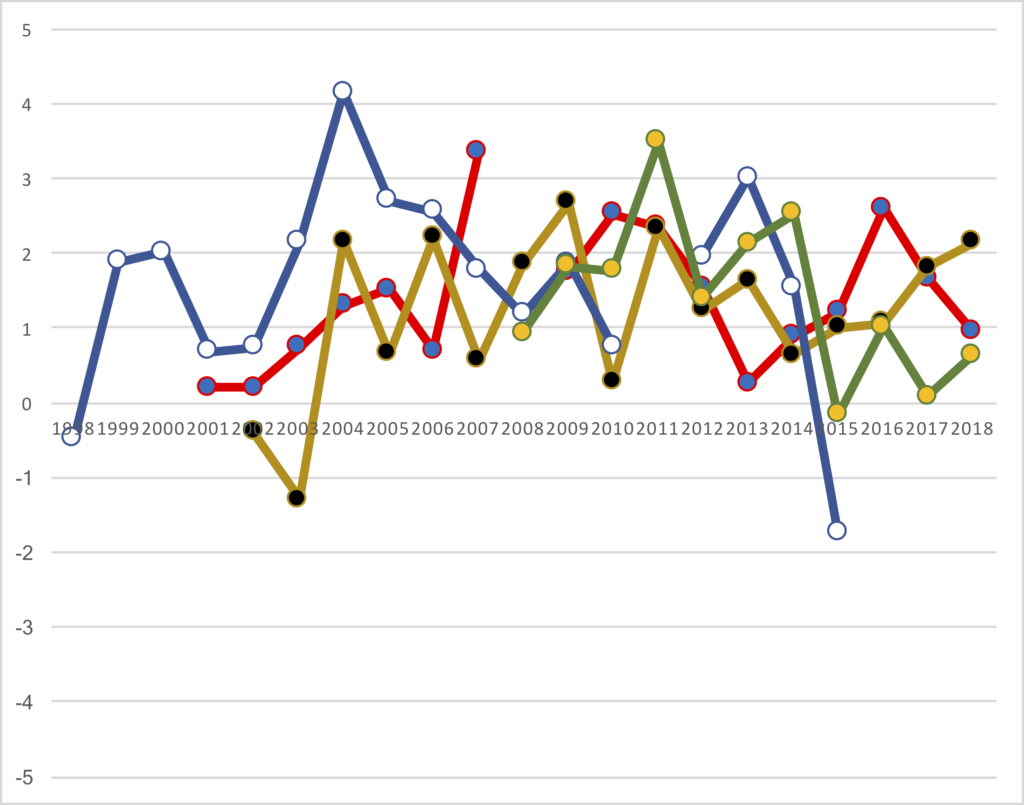
I calculated the Adjusted Net Yards per Attempt averages for every quarterback for every season in NFL history. I then calculated each quarterback’s Relative ANY/A, which is their ANY/A relative to league average. I wanted to then plot the big four quarterbacks of this era — Peyton Manning, Tom Brady, Drew Brees, and Aaron Rodgers — to see how they fared (after excluding seasons where the quarterback didn’t have enough pass attempts to qualify for the passing crown). I’ll leave the commentary to you guys, and I’ll just present the data in three different graphs.

First, let’s do it by chronological year. This means Manning’s graph starts early but ends, while Rodgers doesn’t get started until 2008. I have used blue/white for Manning, red/blue for Brady, gold/black for Brees, and green/gold for Rodgers.

[continue reading…]

{ 1 comment }

Tom Brady Has Had Three Great and Distinct Mini-Careers

Tom Brady has had a remarkable career, and it doesn’t appear that he’s done adding to his legacy. But for now, I’d like to analyze Brady’s passing performance for each season of his Hall of Fame career.

Every season is different, and some stats do a decent job of describing a player in some years, but fail in others. Passer rating, total yards, touchdowns, and interceptions sometimes work, but can also paint very misleading pictures. But if you want to use one stat consistently, I always suggest using Adjusted Net Yards per Attempt, which is the best basic metric to measure a passer’s performance. ANY/A is simply yards per attempt with a 45-yard penalty for interceptions, a 20-yard bonus for touchdown passes, and appropriate inclusions for sacks and yardage lost on sacks. And if you want to measure ANY/A in different seasons, it’s best to compare a player’s ANY/A average to league average, to get his Relative ANY/A in each season.

I went ahead and calculated Brady’s RANY/A for each season of his career. For example, in 2007, playing with Randy Moss and Wes Welker, Brady averaged 8.88 Adjusted Net Yards per Attempt, the best of his career. The league average ANY/A that year was 5.52, giving Brady a Relative ANY/A of +3.36. Meanwhile, in 2002, a still green Brady averaged just 5.54 ANY/A when the league average ANY/A was 5.35. That gives Brady a RANY/A of +0.19, the worst of his career — which, by the way, was still above league average. Yes, Brady has been a starter for 17 seasons (all analysis today discards his ’00 and ’08 seasons, when he combined to throw 14 passes) and has had above-average passing stats in each year. Remarkable.

The graph below shows Brady’s Relative ANY/A, plotted on the Y-Axis from -4.0 to 4.0, in each season of his career. The first thing that stands out to me is how all of the data is plotted in the top half of the graph: that’s because every season is above average. The X-Axis shows season, with a gap around his injured ’08 campaign. Finally, I have plotted the graph in Patriots red and blue, but placed gold circles around his six Super Bowl-winning seasons: ’01, ’03, ’04, ’14, ’16, and ’18. [continue reading…]

{ 0 comments }

Yesterday, I looked at the evolving Patriots offensive line under Tom Brady in the 9 years that New England has made the Super Bowl.  Today, I want to look at the team’s receiving game.

The 2001-2004 Patriots passing attack was based around six players: Troy Brown, David Patten, Deion Branch, and David Givens at wide receiver, Daniel Graham at tight end, and the always dependable Kevin Faulk as the pass-catching back. Brown was the superstar in ’01, while Graham/Givens/Branch weren’t around that year but were big parts of the ’03 and ’04 teams.

The 2007 team was a bit of an outlier, in part because New England didn’t make the Super Bowl in the two years before or the three years after. Randy Moss, Donte’ Stallworth, Jabar Gaffney, and Ben Watson only appeared in one Super Bowl for New England: Super Bowl XII. The two notable players on the ’07 Patriots and other Super Bowl teams were Kevin Faulk (who was in New England forever, and was still the team’s top receiving back in ’07) and Wes Welker, who was a star on both the ’07 and ’11 teams. [continue reading…]

{ 1 comment }

Next Sunday, in the final game of the 2018 season, Tom Brady will be getting ready to play in his 9th Super Bowl, a number that is hard to comprehend. What’s also impressive is that various offensive linemen who have blocked for the Patriots Super Bowl teams. In Super Bowl LIII, from left to right, Trent Brown, Joe Thuney, David Andrews, Shaq Mason, and Marcus Cannon will be protecting him.

None of those offensive linemen were in the lineup four years ago when the Patriots faced the Seahawks to conclude the 2014 season.

And none of those offensive linemen were in the lineup for the 2007 Patriots team that went 16-0.

And only one of those offensive linemen — left tackle Matt Light — were on the field the first time the Patriots played the Rams in the Super Bowl. [continue reading…]

{ 0 comments }

Two years ago, I wrote about how the Patriots under Tom Brady were on a remarkable streak. At the time, the Patriots had been favored in 33 consecutive games where Brady was the starting quarterback (during his suspension during DeflateGate, New England was a 9-point underdog against the Cardinals in a game Jimmy Garoppolo started, and a pick’em in a game against the Texans that Jacoby Brissett started; New England won both games).

Since I wrote that article, the Patriots were favored in all 19 games in 2017, and in all 17 games so far during the 2018 season. That brings the total up to an absurd 69 consecutive games that the Patriots have been favored in when Brady is the starting quarterback. And 70 games ago was Super Bowl XLIX, when the Patriots and Seahawks game was a pick’em. That means you have to go back to a game against the Packers in November 2014 to find the last time Brady took the field in a game the Patriots were underdogs.

The graph below shows every Patriots regular (in blue) and playoff (in red) game since 2010.  The non-Brady games at the start of the 2015 season are shown in black circles.  Since point spreads are typically displayed like “Patriots -7”, the Y-Axis shows the point spread but in reverse order (so the Patriots mostly occupy the top half of the graph).  The X-Axis shows the year. [continue reading…]

{ 4 comments }

Joe Montana and Records Against The Spread

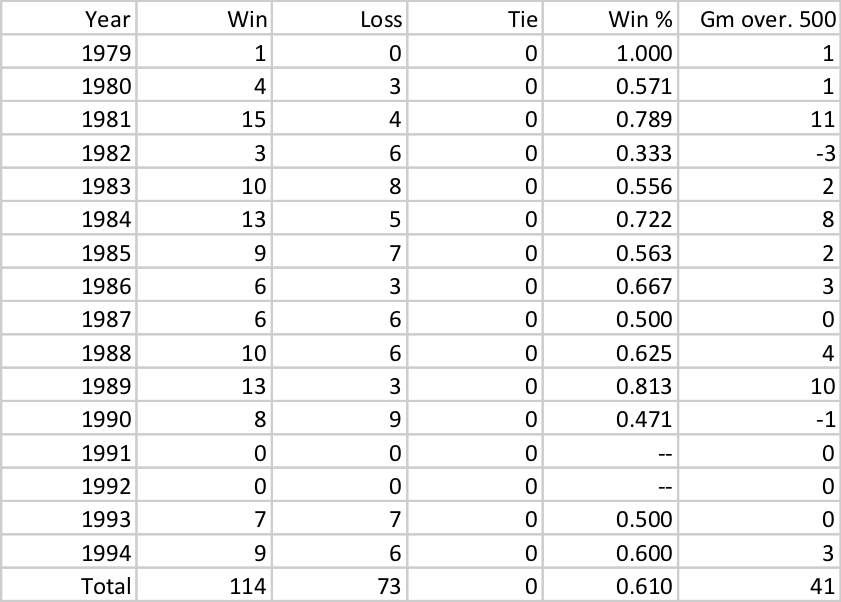
Joe Montana’s teams were really good at winning football games, going 117-47 and 16-7 in games started by the Hall of Fame quarterback. Montana’s teams had a 0.711 overall winning percentage, which is great; but what’s even more remarkable is how well his teams did against the points spread.

On average, Montana’s teams were favored by 4.5 points. And given the nature of how points spreads work, you would expect most teams to win about half of their games against the spread. But Montana’s teams went 114-73 against the spread, a remarkable winning percentage of 0.610. Much of the success was due to the 49ers of 1981 (15-4 ATS), 1984 (13-5), and 1989 (13-3). The ’81 team was one of the most surprising Super Bowl champions of all time; San Francisco was favored in just 9 of 19 games that year, with three of those spreads being just 1-point lines. And the ’84 and ’89 teams were two of the greatest teams of all time, so it’s not surprising that they had great ATS records, too. The table below show’s the record against the spread for each of Montana’s teams in each season of his career:

Also really good against the spread, of course, is Tom Brady and the Patriots. The ’01, ’03, and ’04 Patriots were all Super Bowl champions that were remarkable against the spread, combining to go 41-11-3 relative to the Vegas odds. The Patriots remained solid but unspectacular against the spread since then, although the ’16 team went 13-2 with Brady under center.

What makes the Brady stuff all the more remarkable: the last 52 times the Patriots have taken the field with Brady under center, the Patriots have been favored. And you have to go back 60 games, November 2014 game against the Packers, where New England has been underdogs with Brady under center. More on that tomorrow. [continue reading…]

{ 0 comments }

Brady vs. Manning, Yearly ANY/A

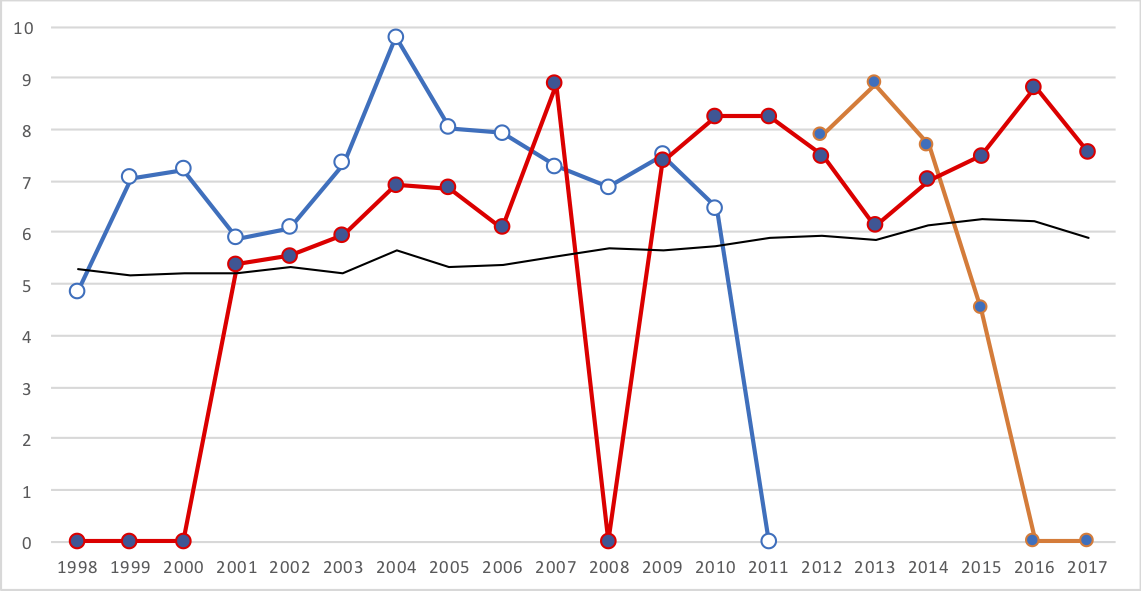
Yesterday, Brad Oremland’s great series on his top-ranked QBs in Total Statistical Production concluded. You should give that a read today, especially if you missed it because of the holiday.One thing that Brad wrote about in the Manning section was how Manning was nearly always better than Brady during the ’00s. It’s easy to forget about that now — Brady has been the much better QB for each of the last three years, and for most years in the ’10s. But during the ’00s, the only year that Brady was clearly better was ’07.I decided to make a graph of the Adjusted Net Yards per Attempt for Tom Brady (in red with blue dots) and Peyton Manning (in blue with white dots for his Colts years, and orange with blue dots for his Broncos years) for each of the last 20 seasons. Brady missed all or nearly all of the ’98 (college), ’99 (college), ’00 (backup), and ’07 (injury) seasons, while Manning missed all of the ’11 (injury), ’16 (retired), and ’17 (retired) seasons. They each get a zero for those seasons, even tho Brady threw 14 passes combined in those years. The thin black line represents league average ANY/A each season.You can break this down into a few categories. [continue reading…]

{ 0 comments }

Will Drew Brees Pull A Sammy Sosa In 2019?

If you were a baseball fan and alive in 1961, you probably remember where you were when Roger Maris broke Babe Ruth’s single-season home run record with his 61st home run of the season.

One of the most memorable sports moments of the ’90s was on September 8th, 1998, when Mark McGwire his hit 62nd home run of the season, breaking Maris’s record.

And there was no shortage of fan fare when Barry Bonds broke McGwire’s record, hitting his 71st home run of the season on October 6th, 2001.

But Ruth, Maris, McGwire, and Bonds aren’t the only players in the last century to hold the single-season home run record.  Because Sammy Sosa was once held the record for most home runs in a season, and he did it without any fanfare at all.  That’s because it happened on September 25th, 1998 in a game between the Cubs and Astros.. Sosa hit his 66th home run of the season that night, breaking McGwire’s record of 65 home runs. Of course, there were still a few games left, and McGwire had just broken the record with his 62nd home run… and his 63rd, and his 64th, and his 65th home runs. And 45 minutes later, in a Cardinals/Expos game, McGwire hit hit 65th home run of the season, and Sosa would never again stand alone as the single-season record holder but for those 45 minutes.

So why the baseball detour today? Because Tom Brady and Drew Brees may re-create the McGwire/Sosa race in a couple of years.  Two years ago, I noted that both Brady and Brees finished the 2015 season tied with 428 career touchdown passes. Now, both players are tied again with 488 career touchdown passes! So who will finish as the career record-holder?

Right now, Peyton Manning is the passing touchdown king with 539 touchdowns, so Brees and Brady need 52 more touchdown passes to set the mark. Brees will pass Manning as the all-time leader in career passing yards with his 1,496th passing yard of the 2018 season, but it is very unlikely that Brees or Brady challenges Manning’s touchdown mark until 2019.

So how did we get here? The graph below shows how many career touchdowns Brady (in dark blue) and Brees (in gold) had after each week of each season since 2001, the year they both threw their first touchdown pass. [continue reading…]

{ 0 comments }

A few months ago on Reddit, I saw this remarkable stat: including the postseason, Tom Brady is 19-9 in games where he throws at least 50 passes.

How remarkable is that? All quarterbacks have a 0.230 winning percentage in games where they have thrown 50+ passes, which means you’d expect a quarterback with 28 such games to win 6.4 of them, not 19 of them. Drew Brees, Peyton Manning, Dan Marino, Brett Favre, Joe Montana, and Aaron Rodgers have won 19 games when throwing 50+ passes…. but have lost 54 times, a 0.260 winning percentage.

Brady’s success in these games is so remarkable that it might be too remarkable. What I mean by that is that if the average quarterback wins 23% of the time, and the greatest quarterbacks in the game win 26% of the time, seeing Brady win 68% of the time probably isn’t evidence that he’s the greatest quarterback ever — unless he’s about ten times better than every other great quarterback. I’ll let you speculate in the comments as to why the Patriots record is so incredible in these games. The table below shows the records of all quarterbacks in 50+ attempt games (minimum 4 such games), sorted by wins over expectation of a 0.230 winning percentage: [continue reading…]

{ 0 comments }

The New Patriots Dynasty and Its Core Four

The lone holdover on the last two dynasties in the NFL.

From 2001 to 2004, the Patriots won three out of four Super Bowls, which was widely considered to form a dynasty. Sure, New England missed the playoffs in ’02, but the Patriots matched the ’90s Cowboys by winning three Super Bowls in just four seasons.

Well, the Patriots have been so good since then that it’s sometimes hard to realize that the Patriots are on the verge of forming another dynasty. After all, with a win in Super Bowl LII, New England will join the ’01-’04 Patriots and the ’92-’95 Cowboys as the only teams to win three Super Bowls in four years.

Which, you know, is pretty remarkable.

Also remarkable? Just four players in this run — QB Tom Brady, safeties Devin McCourty and Patrick Chung, and tackle Nate Solder — played in at least 40% of Patriots regular season snaps in 2014, 2016, and 2017.  The table below shows the percentage of offensive or defensive snaps by each player on New England in 2014, 2016, and 2017. [continue reading…]

{ 7 comments }

The Patriots Season Begins Now

Belichick checks to see if it’s AFCCG time yet

There’s no denying that New England is the greatest regular season team in modern NFL history. From 2001 to 2017, the Patriots have had a 0.768 winning percentage in the regular season; that’s over 10% higher than the second-best team, the Steelers at 0.660.

That’s also the best winning percentage over any 17-year period in history, better than the 1946-1962 Browns (an AAFC-aided 0.756), the 1933-1949 Bears (0.749), and the 1966-1983 Raiders (0.743).

Oh, and the last 8 years? The Patriots have won 80% of their games, the best of any NFL team in any 8-year stretch (the AAFC-aided Browns posted a 0.865 winning percentage from 1946-1953). More incredibly, the Patriots are now going to their 7th-straight AFC Championship Game.

Since losing to Mark Sanchez and the Jets in the Division Round of the playoffs to end the 2010 season, the Patriots have: [continue reading…]

{ 15 comments }

Tom Brady Has Reinvented Himself Again

Tom Brady made a name for himself — and won a few Super Bowls — by orchestrating a horizontal passing game for the Patriots in the early ’00s. But after acquiring Randy Moss, Brady and the Patriots offense changed completely, as he could be seen heaving footballs down the field on a regular basis.

Post-Moss, Brady reverted to a passing game that featured a lot of intermediate passes, but Brady and the Patriots look very different in 2017. And the numbers bear that out. Brady’s average pass this season, whether being completed or not, has traveled 9.09 yards in the air. That’s really high for Brady — in fact, it’s the highest for Brady since 2006, the first year that data is available (it ranks 6th among all passers in 2017). And he’s averaging 6.96 air yards per pass on throws that are completed, which also ranks 6th in 2017 and is the 2nd (behind only 2007) best number of Brady’s career. In other words, Brady is once again throwing downfield a lot. Take a look at the graph below, which shows in blue the average air yards per pass and in red the average air yards per completed pass for Brady for each year since 2006.  The 2017 version of Brady is a lot different than the versions of Brady we’ve seen in recent years with a healthy Julian Edelman, who of course was lost for the season with an ACL tear in the preseason: [continue reading…]

{ 13 comments }

I like trivia, and Chris Brown asked me a good question on twitter yesterday:

The game Brown was referencing was the Patriots performance against the Saints in week 2 of the 2017 season. Here was the receiving breakdown on the New England side:

 
Player Tm Pass Yd Rec Yd
Rob Gronkowski NWE 0 116
James White NWE 0 85
Chris Hogan NWE 0 78
Phillip Dorsett NWE 0 68
Rex Burkhead NWE 0 41
Brandin Cooks NWE 0 37
Dion Lewis NWE 0 11
James Develin NWE 0 6
Jacob Hollister NWE 0 5
Tom Brady NWE 447 0

Brady threw for 183 yards to his wide receivers (Hogan, Dorsett, and Cooks), 143 yards to running backs (White, Burkhead, Lewis, Develin) and 121 yards to his tight ends (Gronkowski and Hollister). So that means Brady threw for 400+ passing yards with just 40% of his passing yards coming from his wide receivers. [continue reading…]

{ 12 comments }

The Patriots and the Spread, Part I

Since 2001, the Patriots have been favored to win in a whopping 79% of all games, including postseason (giving half-credit as a favorite in games where the spread is zero). The Steelers are second at 73%, the Packers and Colts are next at 69%, the Eagles are at 68%, the Broncos at 67%, and the Saints at 61% are the only other team over 60%. In other words, the Patriots have been in a class by themselves when it comes to being favored.

But even that kind of underrates New England. The Patriots weren’t favored in any of the first 8 games of the 2001 season; the team was only favored in one of its first 12 games, at which point in time New England had a 7-5 record (and an 8-4 mark against the spread). There have also been 19 games since 2001 where Tom Brady was not the starting quarterback, and the Patriots were underdogs in 4 of those games (and a pick’em in a fifth). And there were meaningless week 17 games in 2006 and 2009 that the Patriots were underdogs because they were projected to rest their starters.

The graph below shows how many points the Patriots were expected to win in each game, regular and post-season, since 2001. I have included as red dots games not started by Brady or during meaningless week 17 games: [continue reading…]

{ 1 comment }

In 5 years, one of Tom Brady, Peyton Manning, and Drew Brees will be the all-time leader in passing touchdowns. Currently, Manning is the passing touchdown king with 539 touchdowns, but will Brees or Brady catch him?

A year ago, I wrote about the fascinating touchdown race between Brady and Brees: at the end of the 2015 season, both had thrown 428 career touchdown passes. Last year, Brees threw 37 while Brady threw 28 in 12 games, so Brees is currently up 9 on Brady, 465-456.

But when I measured Brees and Brady last year, I measured them by calendar year. Both threw their first touchdown pass in 2001, so I thought a calendar year-by-year chart would be cool. But it probably makes more sense to compare the passers year-by-year by age, as I did yesterday with Brees and Manning for passing yards. That’s because Brees is about a year and a half younger than Brady (in turn, Brady is about a year and a third younger than Manning, but we haven’t compared them by calendar year).

So if we plot their passing touchdowns by age, Brees appears to have a huge leg up on Brady. That is, unless Brady plays until he’s 45: [continue reading…]

{ 107 comments }

Today’s guest post comes from James “Four Touchdowns” Hanson, a relative new reader to the site. As always, we thank our guest posters for contributing.

[Editor’s note: There were a couple of minor bugs in the original data. This post has now been updated.]


There may be no two quarterbacks more often measured against each other than Tom Brady and Peyton Manning. One simply has to do a Google search of the topic to see that fans and sports writers have compared the two numerous times, using a vast array of criteria from the simple counting of championships to using advanced analytics to make their case.

So it’s surprising to me that I still haven’t come across a comparison of Manning and Brady against the same defenses. It’s an idea that occurred to me when Manning critics pointed out that much of his record-breaking 2013 season came against the mediocre teams of the 2013 NFC East and AFC South, while Tom Brady’s record-breaking 2007 was against a tougher strength-of-schedule. [1]While I am a Peyton Manning fan, I feel the point is valid and logical. We compare stats so often but don’t always take into account that most of those numbers were earned against different teams … Continue reading If we’re genuinely after the fairest assessment possible – which is why I assume fans of advanced analytics prefer to measure individual players by their own production rather than team results like wins and championships – what better way to measure each player than by how they performed against the same competition?

So I decided to take a look at the seasons in which Manning and Brady were both active and played against the same teams in the same season. Of course, like any statistical analysis, this one comes with its own set of flaws. When the two quarterbacks play each other’s divisions or one plays the same team in the regular season and the playoffs, one of them may have played the same team twice or even three times in a single season while the other has played them only once.

This can be good or bad for the player’s results – sometimes it allows the opposing defense to learn from the first encounter and make life difficult for the passer the second time around. One example is Peyton Manning’s encounters with the Steelers in 2005; he defeated Pittsburgh with a 102.9 rating and 8.67 ANY/A during the regular season, only to see his performance suffer the second time around during the post-season with a 90.9 rating and 6.21 ANY/A in a loss. Meanwhile, Tom Brady’s single game against the Steelers, where he won with a 92.7 rating and 6.84 ANY/A, stands alone – could he have done better or worse in a second encounter? We’ll never know.

Other times, it can allow the quarterback another opportunity to do well against that defense. When Brady played the Jets for the first time in 2010, he earned a mediocre 72.9 rating and 5.11 ANY/A in a loss. He bounced back to win with an extraordinary 148.9 rating and 12.00 ANY/A in their second meeting and then fell somewhere in between when they met in the playoffs, losing with an 89 passer rating and 5.08 ANY/A. Meanwhile, Manning met the Jets just once in the post-season, where he suffered a loss despite earning a 108.7 rating and 8.85 ANY/A in his last game wearing a Colts uniform. How would he have done if he played the Jets three times? Again, we’ll never know.

In fact, the sometimes vast difference in which each QB has performed against the same defense in the same season should encourage us to take these results with a grain of salt – in-game conditions, game plans from coaches, the play from supporting casts, how one team’s strengths and weaknesses match differently with an opponent, playing at home or away, key injuries on either side, etc. can all effect a player’s performance in any given game.

And there’s always the possibility that Brady or Manning just had a bad day and their performance isn’t indicative of their true abilities: the small sample size of a football season made even smaller by singling out common opponents isn’t ideal in determining a fair and scientific measurement for how good each player actually is. On the other hand, it’s the only evidence we have available, so we’ll have to roll with it.

I bring this up because I don’t intend this to be a definitive attempt at determining which player is better – most people already have made up their minds (and I personally tend to rate quarterback on tiers anyway). Some say Manning would have more championships if he had Belichick and the Patriots organization at his side, while others say Brady would have bigger numbers if he had the receiving talent Manning had during his career. I think both can be true.

I’d also like to mention that I pulled this list manually and despite several reviews, there still may be errors in the data – this is unintentional and I welcome any corrections.

So without further ado, here’s a list of the common opponents they faced in each season, with both 2008 (Brady played one game) and 2011 (Manning was inactive) removed as both players weren’t active during those seasons:

• 2001: Jets, Bills, Dolphins, Raiders, Saints, Falcons, Broncos, Rams
• 2002: Dolphins, Jets, Steelers, Titans, Broncos
• 2003: Dolphins, Jets, Bills, Browns, Broncos, Jags, Texans, Titans, Panthers
• 2004: Ravens, Chiefs
• 2005: Steelers, Jaguars, Chargers
• 2006: Bills, Jets, Dolphins, Titans, Jags, Texans, Broncos, Bengals, Bears
• 2007: Chargers, Ravens, Jaguars
• 2009: Bills, Jets, Dolphins, Titans, Jags, Texans, Ravens, Broncos, Saints
• 2010: Chargers, Jets, Bengals
• 2012: Texans, Ravens
• 2013: Colts, Ravens
• 2014: Bills, Jets, Dolphins, Raiders, Chiefs, Chargers, Colts, Bengals, Seahawks
• 2015: Colts, Steelers, Chiefs

And here are their career averages against common opponents from 189 total regular season and playoff games played (93 Manning, 96 Brady):

Except for interception percentage, Manning seems to have a slight advantage across the board. Most differences are so small that I personally consider them basically even in most categories. The biggest differences seem to be that Manning’s interception rate is substantially higher, while Brady’s sack numbers are substantially higher – and in Brad Oremland’s TSP and Career Value metrics, where Manning holds a commanding lead.

To delve a little further into the numbers, let’s look at the advanced stats of each player by season. The highlights indicate which player did better that year in each metric, while the bolded numbers indicate that season’s number marks a career best (against common opponents) –

The leader in both ANY/A and Passer Rating match in every season, with Manning’s rates beating Brady’s in 8 of the 13 seasons compared. QBR results are also is very similar, with the only difference being Brady having the edge in 2014, putting them even at 4-4.

Interestingly, it seems that for most seasons, one player clearly played better against common opponents by a substantial amount – in Passer Rating, the two only play at a similar level in 2001 and 2007, while the rest of the time the winner often beats the other by ten points or more! What’s really surprising to me is that Manning surpasses Brady in every metric for 2007, which was when Brady led perhaps the greatest offense of all time to a record-breaking season and an AFC Championship.

I also wanted to compare their performances against common opponents in each season by TSP but since it’s a raw sum instead of an average like the other advanced stats, I needed to take each season’s statistical averages and multiply them to get 16 games worth of production. The results were –

The first thing that jumps out at you is Manning’s preposterous 2013 prorated across 16 games – over 6,500 yards and 75 TDs with only 5 INTs. That alone tells us to take these results with a grain of salt.

But accepting the numbers for what they are, we see that the leader in TSP for each season matches the leader in Passer Rating and ANY/A. We also see that Manning’s highs and lows are quite extreme in comparison to Brady’s – Brady doesn’t have a season that matches Manning’s 2004 and 2013, but Brady’s TSP never dips into negative numbers as Manning’s does in 2002 and 2015.

And again, Manning’s 2007 results manage to top Brady’s numbers for his most legendary statistical season (though that probably means nothing since the sample size we’re working with is so small).

So what does this all prove? Well, nothing really. As said, I think the majority of people already have their opinions set for these players – this is just for fun. Hope you enjoyed!

References

References
1 While I am a Peyton Manning fan, I feel the point is valid and logical. We compare stats so often but don’t always take into account that most of those numbers were earned against different teams of varying quality – after all, it’s not fair to compare passing numbers if one guy is going up against the 2002 Bucs while the other is playing the 2015 Saints, right?
{ 207 comments }

The two leaders in ANY/A in 2016.

Matt Ryan and Tom Brady finished the season ranked 1st and 2nd in the NFL in Adjusted Net Yard per Attempt. How unusual is that?

  • In 1966, Bart Starr led the NFL in ANY/A and was the NFL MVP. Len Dawson led the AFL in ANY/A, and was the AFL’s first-team All-Pro selection at quarterback (running back Jim Nance was the MVP). The Packers and Chiefs met in the Super Bowl, of course, making it one of just two times that the Super Bowl featured two first-team All-Pro choices at quarterback. The other? Super Bowl III, featuring Earl Morrall and Joe Namath).
  • In 1971, Roger Staubach had a historically great season, producing a remarkable 7.81 ANY/A. The runner-up that year was Bob Griese, at 6.35, and no other passer was over 6.00. Those 1971 seasons from Staubach and Griese both ranked in the top 50 in my era-adjusted passer rating seasons, too. Alan Page was the AP MVP choice that year, Staubach won the Bert Bell Award for Player of the Year, and Griese won the third MVP, given by the NEA. So when the Cowboys and Dolphins met in the Super Bowl, it featured two MVP quarterbacks, a feat that could be matched this year. The PFWA has already named Ryan as its MVP, but the AP or the Bert Bell Award could choose Brady, which would give us another set of dueling MVPs.
  • In 1984 Dan Marino was a unanimous MVP (AP, NEA, PFWA, Bert Bell) on the back of a groundbreaking performance. His raw numbers (48 TDs, 5,084 yards) were remarkable, but so was his 8.94 ANY/A average. Joe Montana had a darn good year, too: his 49ers went 15-1 and his 7.93 ANY/A was 1.24 ANY/A better than any quarterback not named Marino. From an ANY/A dominance standpoint, it’s very similar to what Ryan and Brady have done this year.

[continue reading…]

{ 1 comment }

Can The Steelers Pass Rush Lead Them To The Super Bowl?

Over the first 8 weeks of the season, the Pittsburgh Steelers had just 8 sacks.  That was the fewest in the NFL, and the corresponding 2.84% sack rate was also the worst in the league.

Since then, things have changed pretty significantly.  Pittsburgh has 36 sacks, most in the league since the start of week 9, five more than any other team in the NFL.  [1]Notably, the Giants are 2nd in sacks over that period, with 31; meanwhile, the Giants had the second-worst sack rate, at 2.85%, and second fewest sacks, with 8, over the first eight weeks.  And only Arizona’s defense (8.94%) has a higher sack rate than Pittsburgh’s 8.53% since then.

Here’s the sack rate for the Steelers defense in each game this season: in a black horizontal line, I’ve shown the league average sack rate. [continue reading…]

References

References
1 Notably, the Giants are 2nd in sacks over that period, with 31; meanwhile, the Giants had the second-worst sack rate, at 2.85%, and second fewest sacks, with 8, over the first eight weeks.
{ 2 comments }

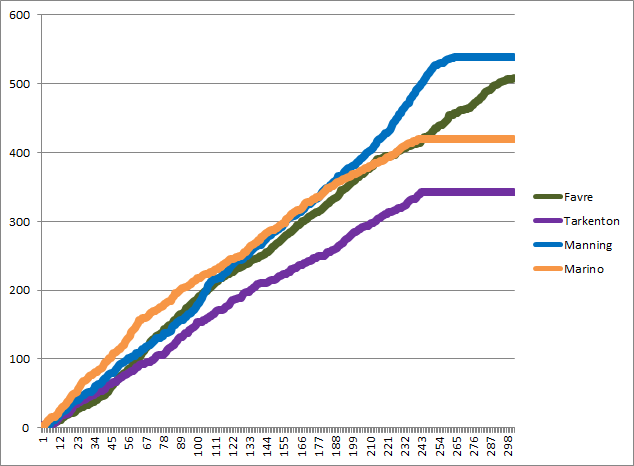
There have been four passing touchdown kings in the last 40 years: Fran Tarkenton, Dan Marino, Brett Favre, and Peyton Manning.  I thought it would be fun to plot the number of career touchdown passes each player had on the Y-Axis after each game of their career (shown on the X-Axis):

td pass leaders
[continue reading…]

{ 7 comments }

Tom Brady and Drew Brees ended the 2015 season in a pretty remarkable place: both have 428 touchdown passes, tied for the third most in NFL history.  Both threw their first touchdown pass in 2001, which makes it easy — and fun! — to compare the two players.  The graph below shows the number of career touchdown passes for each player over every week since 2001:

brady brees td

Brady took an early edge, both because he started earlier (he had 18 touchdowns in 2001; Brees had 1) and played better earlier (Brees had 28 touchdowns in ’02 and ’03 combined; Brady had that many just in ’03).  And, of course, Brady’s scorched-earth 2007 season helped see him take his biggest lead.  Consider that through 2007, Brees had thrown fewer than 30 touchdown passes in each of his first seven seasons. Since then? Brees has thrown more than 30 touchdowns in all eight seasons! [continue reading…]

{ 7 comments }

Guest Post: Brady vs. Manning and Playoff Support

Adam Steele is back, this time throwing his hat into the never-ending Brady/Manning debate. Fortunately, this isn’t your typical Brady/Manning post, as Adam brings some new stats to the table. You can view all of Adam’s posts here.


By any statistical measure, Tom Brady and Peyton Manning have performed at a nearly identical level in the postseason. Of course, many observers don’t care about passing statistics, and prefer to judge quarterback based on playoff W/L record alone. And as we all know, Brady has a significant edge over Manning in this regard. But if we’re going to judge quarterbacks by the performance of their entire team, it’s only fair to also evaluate the parts of the team the QB has no control over – defense and special teams.

Using PFR’s expected points estimations, I recorded the defensive and special teams EPA for Brady’s and Manning’s teams in each of their playoff games. The “Support” column is the total EPA contributed by defense and special teams. Brady first: [continue reading…]

{ 91 comments }

Manning/Brady 18 will use Manning's uniform number instead of Roman Numerals

Manning/Brady 18 will use Manning’s uniform number instead of Roman Numerals

Tom Brady and Peyton Manning have now played seventeen games against each other. Brady has posted an 11-6 record against Manning, which tends to fuel some of the Brady/Manning narrative. The beginning of their “rivalry” was dominated by Brady and the Patriots: from 2001 to 2004, New England went 6-0 against Indianapolis, including two playoff wins in the snow in Foxboro.

Those four seasons anchored the narrative for the 15-year rivalry of the two players. Since then, Manning has a 6-5 record against Brady, including a 3-0 mark in the playoffs. Each player has also won “only” one Super Bowl despite the two quarterbacks dominating the AFC for most of the last decade (Manning, of course, could win another next week).

The table below shows the statistics from both players for each of the 17 head-to-head games: [continue reading…]

{ 22 comments }

This week at the Washington Post, an old topic is relevant again: why pressuring Tom Brady is the key to success against New England.

Completion percentage is often overrated, and it isn’t a critically important stat generally, but the Patriots are a unique offense. As a general rule, completion percentage is highly correlated with winning, but a large reason for that is leading teams tend to throw conservative passes and trailing teams tend to throw aggressive ones. Thus the stat is a result of success even more than a cause of it. (In other words, completion percentage is a lot like rushing attempts, where the best teams tend to fare well in this metric, but in a misleading way.) This season, teams won 58.4 percent of games when completing at least 60 percent of passes, and just 33.3 percent of games when completing fewer than that. But the Patriots were more extreme, winning 11 of 12 when completing at least 60 percent of passes, with the one loss coming in overtime against the Jets. On the other hand, New England lost three of the four games this season when Brady completed fewer than 60 percent of passes, and the one victory came when New England held Buffalo to just 13 points.

The reason completion percentage matters for New England is because the Patriots don’t really have a running game, at least not in any traditional sense. Against Kansas City on Saturday, the Patriots threw on 24 of the team’s first 26 plays. All game, Patriots running backs had just seven carries, with Steven Jackson — signed in December — taking six of those carries and gaining just 16 yards. In the regular season game against Denver, the Patriots began the game by calling 18 passes to just two runs on the team’s first six drives.

You can read the full article here.

{ 6 comments }

How many Super Bowls should the Patriots have won?

Since 2001, New England had made the playoffs twelve times, reaching the Super Bowl, incredibly, in half of those seasons. The Patriots have won the Super bowl four times over this fourteen-year span, which made me wonder: how many Super Bowls *should* the Patriots have won?

This could be measured in a few ways. We could look at say, the team’s pre-season odds of winning it all each year. I don’t have that historical data, but we can be sure that New England significantly overachieved by that measure. We could also look at the team’s Super Bowl chances at the start of each post-season. For example, at the end of the regular season, Bovada had the Patriots at 3/1 to win the Super Bowl. That would imply a 25% chance of winning it all, although after adjusting for the vigorish, the Patriots’ true odds would have been 21.8%. I don’t have historical data of this sort, although I am sure one could use a combination of SRS and home-field advantage to come up with something similar. Hey, if you have ideas, present them in the comments.

Instead, I used the same methodology I used a couple of weeks ago to determine the randomness of each post-season. Remember, a point spread can be converted into an expected winning percentage using the following formula in Excel (if you put the point spread in cell L2): [continue reading…]

{ 8 comments }

Super Bowl XLIX, and Thoughts on ANY/A

Let’s get something out of the way.

In the final minute of the game, the Seahawks had an 88% of winning Super Bowl XLIX. To make grandiose statements about the Patriots passing attack and football analytics based on New England winning the Super Bowl would be silly given the way the game ended.

Okay, whew.  But I do want to talk about the Patriots offense, and more specifically, ANY/A.  As regular readers know, Adjusted Net Yards per Attempt is calculated as follows:

(Gross Passing Yards + 20*PassTDs – 45*INTs -SkYdsLost) / (Pass Attempts + Sacks)

ANY/A correlates very well with winning, and it’s my favorite basic metric of passing play.  But ANY/A, based around yards per attempt, is not perfect.  And I think SB XLIX provides a good example of that.  Tom Brady finished the day with 320 net passing yards, 4 TDs, and 2 INTs on 51 dropbacks, which translates to an ANY/A of 6.08.  Russell Wilson had 234 net passing yards, 2 TDs, and 1 very fateful INT on his 24 dropbacks; that translates to an ANY/A of 9.54. [continue reading…]

{ 36 comments }
Tom Brady has been known to wear Suggs

Tom Brady has been known to wear Suggs

Disclaimer: Quarterbacks don’t have records, teams do. A quarterback’s “record” is simply shorthand for saying “the record of a quarterback’s teams in all playoff games started by that quarterback.” Please forgive me for using that shorthand for the remainder of this post.

Eight years ago, Doug Drinen wrote a fun post in advance of the 2006 AFC Championship Game. At the time, Peyton Manning had gone 0-2 in playoff games against Tom Brady, so Doug looked at quarterbacks who had gone winless against another particular quarterback in the postseason.

Manning wound up beating Brady in that game, and evened his record against Brady in the 2013 playoffs. No pair of quarterbacks have ever met as starters five times in the playoffs, so Brady/Manning are tied for the most playoff meetings. Joining them on Saturday will be Brady and Joe Flacco. This weekend’s game will be the fourth time since 2009 that the Ravens have traveled to Foxboro in the postseason, and Brady and Flacco have been under center for each game. [continue reading…]

{ 7 comments }

In the third quarter on Monday night, I texted my Patriots fan buddy Matt, “Is it possible that we suck? Maybe the run is finally over.” Bill Barnwell mused on this, and Aaron Schatz also wrote about it. It was hard not to think that, given the way the Patriots were manhandled by a mediocre team playing without several key players. It looked every bit as bad as the 41-14 score and maybe worse.

I remember the last time I wondered if the Pats were done. In a 34-14 loss to the Browns in 2010, the Patriots looked pretty impotent. In that game, as in the Chiefs one, the Pats had just under 300 yards of offense. Peyton Hillis ran over the Patriots. Of course, that wasn’t the end. Maybe this time is different, though. If anything the Chiefs game was even worse, so it’s possible this time really is the end. [1]And those Pats were 6-1 at the time of the loss to the Browns.

Will the Patriots offense be good later this year? To provide a little insight into this, I went back and looked at performance trends for quarterbacks who have had long careers. The first table looks at quarterbacks since 1969 who have the biggest single-season drops in adjusted net yards per attempt (ANY/A) from the previous five year trend. I look just at quarterbacks with at least 100 attempts in a season and I weight by the number of attempts when calculating the average ANY/A over the previous five years.

[continue reading…]

References

References
1 And those Pats were 6-1 at the time of the loss to the Browns.
{ 20 comments }
Previous Posts