≡ Menu

Week 3 (2019) Passing Stats: Kyler Murray Hits Rock Bottom

If you took a quick glance at the passing stats from week 3, you might not notice how bad number one overall pick Kyler Murray performed against the Panthers. You’d see that he threw for only 173 yards with 2 TDs and 2 INTs, and might think that it was a typical underwhelming performance by a rookie quarterback.

What you might not have noticed was that Murray had 43 pass attempts and also was sacked a whopping 8 times, losing 46 yards. He also only passed for 9 first downs, a pitiful number given his 51 passing plays (17.6%). Murray threw for just 127 net passing yards against Carolina, a shockingly-low 2.49 net yards per attempt average. In fact, no passer had averaged under 2.50 NY/A in a game with 40+ attempts since 2003.

Murray finished week 3 with a 1.51 ANY/A average, the second-worst performance in week 3 by any starting quarterback. The worst? Well, that honor belongs to Jets third string QB Luke Falk, who was basically useless against the Patriots. Falk had 27 passing plays on Sunday: 20 of them produced negative EPA, meaning they were a negative play, 3 were slightly positive plays (i.e., a 5-yard pass on 1st-and-10), and 4 picked up first downs. New York scored 14 points courtesy of a special teams touchdown and a defensive touchdown.

On the positive side of things, the top three passing stat lines belonged to Patrick Mahomes, Deshaun Watson, and Kyle Allen. The full week 3 passing stats below: [continue reading…]

{ 0 comments }

In week 1, the passing stats were once again remarkable: the league averaged 7.08 ANY/A and produced a passer rating of 100.2.

In week 2, though, things dipped down quite a bit to 5.96 ANY/A and a passer rating of 87.6. There are injuries to be discussed. Sam Darnold is out with mono and didn’t play last night. Nick Foles broke his left clavicle early in week one and is out indefinitely. In week two, two Hall of Fame quarterbacks went down: Ben Roethlisberger is out for the season with an injured right elbow, and Drew Brees is out for two months torn ligament in the thumb on his throwing hand.

There are also the Dolphins to be discussed. Ryan Fitzpatrick and Josh Rosen combined to be terrible: 7 passing first downs, 4 interceptions, and 7 sacks. And Eli Manning, Carson Wentz, and Derek Carr all had ugly weeks, too.

What did help week 2? The reigning MVP of the NFL, Patrick Mahomes. The best player in football put together a 2nd quarter for the ages on Sunday against the Raiders. Mahomes completed 12 of 17 passes, for a remarkable 278 yards (23.2 yards per completion) and 4 touchdowns, with no interceptions or sacks and *ten* first downs. Jimmy Garoppolo and his former mentor Tom Brady both had great weeks, but there’s no question who was the best quarterback in week two.

The table below shows the full passing stats: [continue reading…]

{ 0 comments }

Jackson squished the fish on Sunday

After every week, I post the weekly passing numbers to look at which passers produced the best stats of the week. The formula is pretty simple.

It begins with Adjusted Net Yards per Attempt, which is (Passing Yards + 20*Passing TDs – 45*INTs – Sack Yards Lost) divided by (Pass Attempts + Sacks). Let’s begin with the best passing performance of week one, which belongs to Ravens second-year quarterback Lamar Jackson. Baltimore’s young quarterback went 17/20 for 324 yards with 5 TDs and 0 INTs, while taking 1 sack and losing one yard. That means Jackson had 423 Adjusted Net Yards on 21 dropbacks, or 20.14 Adjusted Net Yards per Attempt.

The NFL as a whole in week 1 averaged 7.08 ANY/A, which sets our baseline for average play. This means Jackson was 13.06 ANY/A above average over 21 dropbacks, which means he produced 274 Adjusted Net Yards of value over average. That, of course, was the most in the NFL.

It also harkens back to one of the greatest performances in NFL history by another Baltimore quarterback: Johnny Unitas. Historians have long regarded Unitas’s game against the 1967 Falcons as one of the best ever, and the stats confirm that.  In a ‘glitch in the matrix’ moment, the old Baltimore QB went 17/20 against the Falcons that day, for 370 yards with 4 TDs and 0 INTs. Both Unitas and now Jackson are part of the extremely rare 20/20 club: averaging 20 Adjusted Net Yards per Attempt on 20+ pass attempts. In fact, Baltimore has been involved in all three games: Unitas against the Falcons in ’67, Jackson against the Dolphins in week 1 of 2019, and what is the greatest statistical game in NFL history: Joe Namath (in a shootout with Unitas) against Baltimore in 1972.

The full week 1 passing stats below: [continue reading…]
{ 0 comments }

Let’s start with the obvious: Patrick Mahomes was never bad.  He had 7 games this season where he averaged at least 10.0 AY/A, 11 games where he averaged at least 9.0 AY/A, and 15 games where he averaged at least 7.0 AY/A.  His worst statistical game of the season came against a good Jaguars defense in a game that got out of hand in Kansas City’s favor early.

The Chiefs also became the first team in history to score at least 26 points in every game; the 1998 Minnesota Vikings had been the previous champion in this category, having scored at least 24 points in every game.

Mahomes finished with 50 touchdown passes, 11 more than every other quarterback in the league. He averaged 8.13 Net Yards per Pass Attempt, a half-yard better than every other full-time starter in the league (Ryan Fitzpatrick has a way of mucking up these stats), and threw for over 5,000 passing yards.  Mahomes led the league with a remarkable 8.89 ANY/A average, the 6th best in modern history.

The table below shows the final passing leaders for the 33 quarterbacks who threw enough pass attempts to qualify for the passing crown. That’s all 32 teams plus both quarterbacks for Tampa Bay. The league average ANY/A this season was a remarkable 6.32, which tops 2015 (6.26) for the most efficient passing season in NFL history. Mahomes, with an 8.89 AY/A average over 606 dropbacks, meaning he provided 1,554 Adjusted Net Yards of value over average. That easily led the league: [continue reading…]

{ 0 comments }

Week 16 Passing Stats: Late Season Nick Foles Is Back

Late season Nick Foles is back! The Eagles backup quarterback — and 2018 postseason hero — was your top passer in week 16. Foles set a franchise record with 471 passing yards, and averaged 9.94 ANY/A on 50 dropbacks.

The second-best quarterback of the week also wears green: it was Jets rookie Sam Darnold, who has been very good since returning from a foot injury. He threw for over 300 yards and 3 TDs in a losing effort against the Packers.

On the other side, Panthers fans don’t have to worry about a quarterback controversy. Backup Taylor Heinicke led the Panthers on a 14-play, 73 yard opening drive for a touchdown, but the team’s final 10 drives ended with 3 punts, 3 interceptions, 2 turnovers on down, 1 fumble, and 1 field goal. He finished with a 2.58 ANY/A on 55 dropbacks. More notably, Philip Rivers had one of the worst games of his career, gaining just 1.39 ANY/A on 41 dropbacks against the Ravens. [continue reading…]

{ 0 comments }

Week 15 Passing Stats: Rosen Hits The Floor

The Atlanta Falcons have a terrible pass defense, but no matter: Josh Rosen was still the worst passer in the league in week 15. He finished with just 90 net passing yards on 28 dropbacks, and two interceptions dropped his ANY/A to an even 0.00.  It has been a miserable year for Rosen and the Cardinals passing attack as a whole.  What’s truly remarkable is that the Cardinals are now nearly below the Bills this year in ANY/A for the season.

Buffalo, as you may recall, was one of the worst passing teams in the history of the NFL through 6 weeks.  And it didn’t get much better in weeks 7 through 9.  But since then, the Bills have improved significantly under Josh Allen, while the Cardinals have fallen.  Through 15 weeks, Buffalo is averaging 3.48 ANY/A, while the Cardinals are at 3.60 ANY/A (Buffalo is actually ahead in NY/A).  It will be a tight race to the bottom! The graph below shows the game-by-game ANY/A for both Buffalo (in blue and red) and Arizona (in red and yellow). As you can see, the Bills have been the much better passing team over the last five games. [continue reading…]

{ 0 comments }

Week 14 Passing Stats: Primetime Flops

You don’t expect to see Jared Goff’s at the bottom of the weekly ANY/A rankings, at least not since his rookie year.  But Goff had the worst game of his career on Sunday night, throwing for only 180 yards while also throwing 4 interceptions and zero touchdowns against the Bears.  Savvy readers will know that since an interception is worth -45 yards in the ANY/A formula, a passer with 180 yards, no TDs, and zero INTs will have an ANY/A of 0.00, regardless of their number of attempts.

Goff also took three sacks, so he finished with an ANY/A of -0.53.  The quarterback on the opposing sideline, Mitchell Trubisky, wasn’t much better. Trubisky threw a touchdown, but picked up just 110 yards while throwing 3 interceptions; he finished with an ANY/A of -0.48 on 31 dropbacks.

And then on Monday Night Football, we saw some more bad passing from a pair of star quarterbacks.  Russell Wilson was the winning quarterback, and the Seahawks became just the second team in the last 9 years to win a game with 60 or fewer passing yards on 20 or more passing stats (the 2017 Seahawks being the other). Wilson finished with an ANY/A of 0.68 and a passer rating of 37.9, the single worst performance of his career.

Kirk Cousins was the losing quarterback on MNF, and while his final statistics don’t look too bad, they are a bit misleading.  Cousins took a strip sack with three minutes to go that was recovered and returned for a touchdown, putting Seattle up 21-0.  After that, Cousins threw for 70 yards and a touchdown on his final 6 meaningless passes; prior to that moment, he was averaging 4.45 ANY/A.  He had thrown for just 5 first downs on his first 29 passes.

The table below shows the weekly passing results: [continue reading…]

{ 0 comments }

It was a rough week 13 for many franchise quarterbacks.

But Patrick Mahomes was just fine, once against finishing as the top quarterback of the week.  It was yet another 4-TD, 120+ passer rating game for Mahomes, the fifth of this season.  By way of comparison, Jim Kelly and Joe Montana only had four such games in their entire careers.  Mahomes now has had a passer rating of at least 110 in 10 of 12 games this year, the second most by a player through 12 games in history (2011 Rodgers did it 11 times).

Of course, none of those stats are adjusted for era. But Mahomes is having a top-4 season for a 2nd-year quarterback since the merger even once you adjust for era, and arguably a top-2 season depending on how you feel about 2013 Nick Foles and a 28-year-old Kurt Warner in 1999. No, it’s not Dan Marino 1984, but it’s pretty clearly the best season a 23-year-old quarterback has had since Marino.

The full week 13 passing stats below: [continue reading…]
{ 0 comments }

Marcus Mariota went 22/23 against the Texas and he averaged 13.2 yards per attempt. That sounds like it should be one of the great games in NFL history. So how come the Titans scored just 17 points and lost despite such a high completion percentage and no turnovers until the team’s final offensive play? Tennessee even set a new record for completion percentage in a loss! One reason is that the team punted six times, and you might be wondering how is that even possible to have 6 times as many punts as incompletions.

For starters, Mariota took a whopping 6 sacks, a 21% sack rate. And 7 of Mariota’s 22 completions were negative plays according to EPA. That includes three obvious ones: a 4-yard completion on 3rd-and-19, a 7-yard completion on 3rd-and-9, and a 7-yard completion on 3rd-and-8. (Tennessee went for it on 4th-and-1 after that, but failed; the other four failed third down plays that yielded to punts were two Mariota sacks, a Mariota scramble for 8 yards on 3rd-and-16 after another Mariota sack, and a rushing play on 3rd-and-29 following a 15-yard facemask penalty and yet another sack.) But there was also a 2-yard pass on 1st-and-10, a -1 yard completion on 2nd down, a 2-yard completion on 2nd-and-10, and even a 3-yard completion on 2nd-and-5 is considered a negative play (you’d rather re-do the down than take a 3-yard gain on 2nd-and-5). All of the sudden, Mariota’s 22/23 game turns into 15 positive completions on 29 dropbacks, which is a far different story. That’s still a good game, but not a great one, much less an all-time great one.

Mariota finished with the 5th-best performance of the week; below are your week 12 passing stats. [continue reading…]

{ 1 comment }

Week 11 Passing Stats: The Stars Shine

The top 5 passers of week 11 consist of the three best QBs this season — Drew Brees, Patrick Mahomes, and Jared Goff — and the two quarterbacks who, at various times, have been considered the most valuable quarterback assets in the league: Andrew Luck and Aaron Rodgers.

Brees had zero sacks and zero interceptions while averaging over 12 yards per pass attempt and throwing for 4 TDs, making him the best passer of the week. Luck also had no sacks or interceptions, averaged over 10 yards per attempt, and threw 3 TDs. Rodgers averaged 11 yards per attempt and threw a pair of touchdowns, but his 5 sacks knocked him down below Luck. Mahomes had 478 yards and 6 TDs, but also 3 INTs and 3 sacks. Still, he averaged over 10 yards per attempt and threw 6 TD. It’s kind of a quirky stat, but Mahomes had by far the best passer rating in NFL history among players with at least 3 INTs in a game. Jared Goff took 5 sacks, but threw no interceptions and threw for 413 yards and 4 TDs.

The average ANY/A in week 11 was 6.24, making it a below-average week by 2018 standards. Below are the week 11 passing stats: [continue reading…]

{ 0 comments }

In March, the Jets inexplicably signed Josh McCown to a 1-year, $10M contract.

A few days later, the Jets sent three 2nd round picks along with the 6th pick in the 2018 Draft to Indianapolis to move up to the 3rd spot. That made the McCown signing even more odd in retrospect:

The Jets have mucked up the quarterback position for as long as anyone can remember, and you can add giving McCown $10M to Mike Maccagnan’s tab next to “trading up for Bryce Petty,” “using a second round pick on Christian Hackenberg”, and “sending a fortune to get a top-3 quarterback prospect”, and “getting into a stalemate with a journeyman quarterback and then giving him $12M.”

On Sunday, McCown was the worst quarterback in football. Paying $10M to a quarterback coach is not justifiable, and paying $10M to a quarterback mentor — whose mentees include Hackenberg, Petty, Johnny Manziel, and Mike Glennon — only works if he can be a great backup quarterback on a team in need of a great backup quarterback.

The full week 10 passing stats below:

This was another remarkable week for NFL passers, who completed 630 of 925 passes (68.1%) for 7,144 yards, with 50 TDs and just 18 INTs. That translates to a 100.9 passer rating, and there were 19 quarterbacks who had a passer rating of over 100 and threw 20+ passes. This came despite there being just 28 teams active in week 10! The quarterbacks took 69 sacks for 509 yards, and finished with a 6.87 ANY/A average. It was yet another remarkable passing week in the best passing season of all time.

Finally, let’s look at the full season passing stats: you have Philip Rivers at #4, and in front of him is a rival quarterback from his own division, a rival quarterback from his own city, and his former teammate. And the bottom three are all rookies, in a narrative twist from the “why are rookies all of the sudden good” trend we had seen in recent years:

What stands out to you?

{ 0 comments }

Week 9 Passing Stats: Nick Mullens Shines In Debut

Nick Mullens was an undrafted free agent signing by the 49ers last season who was waived as part of the team’s final cuts in September. He was resigned in January, and then was again waived in September as part of San Francisco’s final cutdown.

He was added to the practice squad, and then, after Jimmy Garoppolo tore his ACL, the 49ers brought Mullens up to the active roster. Then, C.J. Beathard injured his throwing wrist in a game against the Cardinals, and while he played through the injury, he was questionable to start the team’s week 9 game on short rest. In a last minute decision, San Francisco went with Mullens — who had never entered an NFL game before — as the team’s week 9 starting quarterback.

And it somehow went magically, as Mullens turned in one of the greatest debuts by a quarterback in NFL history.

Mullens averaged a league-high 14.64 ANY/A, and ranked second to Drew Brees is value added among all quarterbacks for week 9. The weekly ANY/A average in week 9 was 6.40 ANY/A, another strong passing week for the NFL, and that’s even with Nathan Peterman playing.

And yes, a word about the Bills embattled quarterback. Peterman threw a league-high 49 pass attempts this week, and yet — amazingly — finished just 22nd in passing yards! It was another miserable week for the Buffalo passer, who averaged 0.6 ANY/A. That increased his average for the year, as Peterman is still wading in negative ANY/A waters for the season.

The table below shows the week 9 passing results. [continue reading…]

{ 0 comments }

Week 8 Passing Stats: Watson, Wilson, Newton Dominate

The three best dual threat quarterbacks in the NFL right now are Cam Newton, Russell Wilson, and Deshaun Watson. You can make a good case that they were also the three best quarterbacks of week 8.

Watson was the most valuable passer of week 8, throwing for 5 TDs on just 20 dropbacks, with zero interceptions and zero sacks. Wilson was the second most valuable passer of the week, and became just the second player in the last three seasons to have a perfect passer rating while throwing at least three touchdown passes. And Newton led all quarterbacks with 52 rushing yards and a touchdown, led the Panthers to 36 points on 7 scores on 10 drives, and did not take a sack or an interception.

The full week 8 passing stats below. The average ANY/A this week was 6.98; as always, Value is calculated as the difference between each passer’s ANY/A and the weekly average, multiplied by that passer’s number of dropbacks. [continue reading…]

{ 0 comments }

Week 7 Passing Stats: The Rookies Play Like Rookies

This was not a good week to be a rookie quarterback. Josh Allen was on the sidelines due to an injured elbow, and he may have had the best week of any of the top rookie passers.

Josh Rosen was a disaster on Thursday night, as he threw two picks six as his Cardinals were destroyed, 45-10. Even ignoring that two of his three interceptions were returned for touchdowns, Rosen finished with a 0.87 ANY/A average, the worst of any quarterback in week seven.

Sam Darnold was not much better. The Jets had six drives in the second quarter, and picked up zero first downs. For the game, Darnold finished with 45 dropbacks and threw for just 7 first downs, and his 16% passing first down rate was the worst of any quarterback in week seven.

Baker Mayfield was only slightly better: the Browns seven first half drives ended in six straight punts and a turnover on downs when Cleveland took possession at the Tampa Bay 19-yard line. Cleveland had 6 three-and-outs, and the Browns picked up a first down on just 21% of all passing plays: third-worst of the week, ahead of only the Cardinals and Jets.

The top passers this week were Rivers and Mahomes, who have separated themselves as the top two quarterbacks in the AFC this season. The full week 7 passing stats below. On average this week, teams completed 22.1 of 34.0 passes, for 247.4 gross passing yards, with a 93.4 passer rating. [continue reading…]

{ 1 comment }

The Buffalo Bills have the worst passing attack in the NFL, and it is not particularly close. The NFL is averaging 6.5 Adjusted Net Yards per Attempt, the 30th-best passing offense is averaging 4.5 ANY/A, and the 31st-best passing attack is averaging 4.1 ANY/A.  The Bills? They are averaging 2.0 ANY/A and have reached the cellar by being bad at every facet of the passing game.  The Bills rank last in the league in completion percentage, passing yards, passing touchdowns, passing touchdown rate, and yards per attempt. The Bills also have the worst sack rate *and* the worst interception rate in the NFL.

In 1941, the league average completion percentage was 44.3%; the 2018 Bills are completing passes at a 50.6% clip.

In 1941, the average NFL team gained 122 passing yards per game; the 2018 Bills are gaining 123 passing yards per game.

In 1941, NFL teams threw an interception on 10% of passes; the 2018 Bills have thrown an interception on 7.3% of passes.

But if you pick any year more recent than 1941, you might think Buffalo was a below-average passing team.  The league average completion percentage has been over 50.6% in every season since 1961. When it comes to interceptions, 1975 and 1971 are the only post-merger seasons where the league average more than 1.5 interceptions per game.  And in passing yards per game?  It’s been higher than Buffalo’s current average in every season beginning in 1942.

If you want to use yards per attempt, you have to go back to 1935 to find a season where Buffalo’s current 5.39 Y/A average would be above average.   The last time the league average ANY/A was below 2.0 was in 1938, and the NFL has never had a NY/A average as poor as the 2018 Bills.

So yes, Buffalo’s passing performance this season has been otherworldly.  And it got worse in week 6, as Josh Allen and Nathan Peterman combined to gain just 129 passing yards on 31 dropbacks, while throwing two interceptions.  And with 90 seconds left in the 4th quarter of a tie game, Peterson threw a brutal pick six that swung the game to Houston.

Below are the week 6 passing stats, with some familiar names at the top.

And in addition, here are the passing stats to date. I am using 15 dropbacks multiplied by the number of weeks in the season to determine whether a passer has qualified. The table has 58 rows, but for ease of reading, I have defaulted to only showing the top 10.

{ 0 comments }

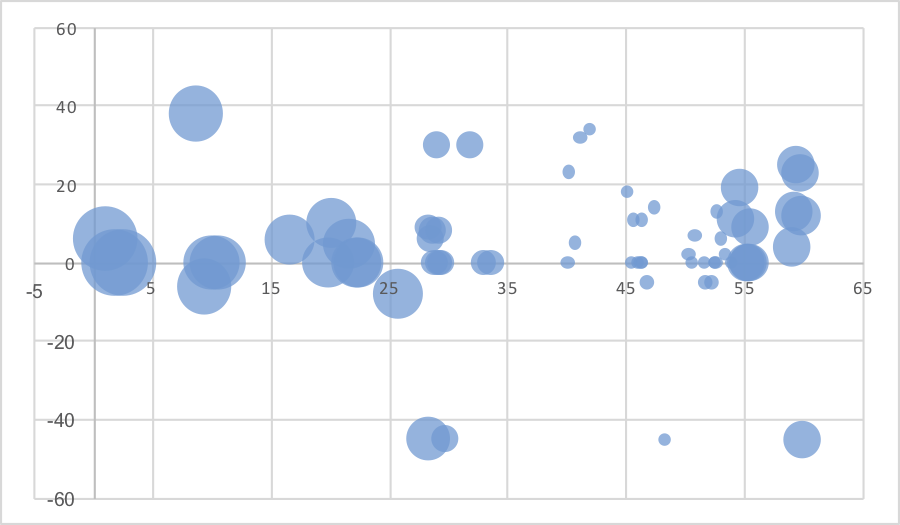
It was not a good day for Blake Bortles and the Jaguars in week 5. He finished the game with a 3.65 ANY/A, going 33/61 for 430 yards, with 1 TD, 4 interceptions, and 5 sacks for 29 yards. Even those numbers overstate things: At halftime, he was averaging 0.92 ANY/A, and after 40 minutes, he was averaging just 1.86 ANY/A. With some good passing numbers when the game was out of hand, Bortles bumped his ANY/A to 4.40, before it dropped to 3.65 when he threw a meaningless interception on the final play of the game.

One interesting way to show how the game progressed is by using a bubble chart, where the size of each bubble represents the scoring differential, the X-Axis represents time elapsed in the game, and the Y-Axis shows adjusted net yards. Each bubble represents one attempt. As you can see, a lot of Bortles’ production came when the game was out of hand (and win probability would be an even better metric to use than scoring differential here, as the “larger” bubbles late in the fourth quarter were also when the game was out of hand due to time remaining as much as scoring differential):

[continue reading…]

{ 0 comments }

As a rookie, Jared Goff threw 5 touchdowns on 205 pass attempts. In week 4, he threw 5 touchdowns on 33 pass attempts.
As, Mitch Trubisky threw 7 touchdowns on 330 pass attempts. In week 4, he threw 6 touchdowns on 26 attempts.

Both joined the exclusive 17/17 club of 17 Adjusted Yards per Attempt on 17 passes. [1]While I prefer using ANY/A to AY/A, the PFR Game Finder only has AY/A as a default search option, hence my use of AY/A there., making a remarkable three such performances in September 2018.

Meanwhile, there is Josh Allen, who became just the 19th quarterback since 2008 to finish a game with a negative ANY/A on at least 30 pass attempts.

And then there’s Matt Ryan, who for the second straight week found himself on the losing side of a passing shootout. He became just the 8th quarterback since the merger to average 11.0 ANY/A or better, throw for 400 passing yards, and lose.  The Falcons join the 1966 Giants as the only teams to score 36+ points in consecutive regular season games… and lose both games.

Note that it was a terrible week for AFC East quarterbacks not named Tom Brady, and actually not even a good week for Brady (because week 4 was absurd, Brady’s 6.97 ANY/A average was actually below-average). Below are the passing stats for week 4: [continue reading…]

References

References
1 While I prefer using ANY/A to AY/A, the PFR Game Finder only has AY/A as a default search option, hence my use of AY/A there.
{ 0 comments }

Here was Matt Ryan’s stat line in week 3: 26 completions on 35 attempts, 359 passing yards, 5 TDs, 0 INTs, 146.3 passer rating, 12.08 ANY/A.

Somehow, Ryan’s Falcons lost. There have been 93 teams in NFL history to average at least 9.0 net yards per pass attempt, throw for 300 passing yards, and have a passer rating of at least 145. Those teams are now 91-2, with Atlanta on the winning side of things in a game against Pittsburgh in 2006.

Or how about this stat: what do you think the record is of quarterbacks who average 10 yards per pass attempt, with 5 TDs, and 0 INTs? Try 50-2, with Ryan now joining Dan Marino in one of his crazy games against the ’80s Jets.

Or what about this: 300 passing yards, no interceptions, and a passer rating of 145? Teams were 117-0 when their quarterbacks did that, until Ryan became the first one to ever lose such a game on Sunday.

So yeah, Matt Ryan had a remarkable game on Sunday, but his Falcons somehow lost. The reason? They were facing Drew Brees, who was nearly as good. This was the second time in three weeks that Brees and the quarterback facing the Saints were two of the best three quarterbacks of the week. If we want to play with a bunch of endpoints, consider: there have been 5 games this season, where a quarterback threw for 370 yards and 3 TDs, with a passer rating of at least 115 and a completion percentage of at least 73%.  Four of those five games came with the Saints on the field.

In between the best (Ryan) and 3rd best (Brees) performances of the week was Ryan Tannehill.  The Dolphins star had a wonderful game, even if his numbers were inflated a bit by a 74-yard touchdown “pass” and an 18-yard touchdown “pass” where the ball traveled about one foot from Tannehill’s hands each time.  Add in an Albert Wilson touchdown pass — he had a remarkable game, too — and it was one of the most efficient passing games in Miami history.

As for the league as a whole?  It was a less remarkable passing week than the historic numbers we saw in week 2, but it was still pretty darn efficient.  The league averaged 6.38 ANY/A, a passer rating of 94.6, and 257 passing yards per game. The table below shows the full week 3 results: [continue reading…]

{ 0 comments }

Last week, the Buffalo Bills had the worst quarterback in the NFL. And after switching from Nathan Peterman to Josh Allen, Buffalo had… the second-worst quarterback in the NFL in week two.  Sam Bradford was bad in week 1, but he was really bad in week two: the journeyman quarterback averaged under 5.3 yards per completion, the lowest of any quarterback since 2009.

Meanwhile, Ryan Fitzpatrick and Patrick Mahomes were once again two of the top three passers in the league.  The big story, of course, was that the league as a whole averaged an NFL record 6.99 ANY/A in week two; that means when Matthew Stafford throws for 347 yards and 3 TDs with no interceptions on 53 dropbacks, and averaged 7.07 ANY/A, he was basically average.  That is going to take some time to get used to.

The full week two results, below:

This Week In Completion Percentage Is Meaningless

Eli Manning ranks poorly in ANY/A this week despite a sparkling 75% completion percentage.  Do you know why? Because the Giants had one of the worst performances for a team that completed 75% of their passes, at least as measured by simple net yards per pass attempt. New York’s first five drives ended in punts, and the sixth ended in a fumble. The 7th drive was a field goal and the 8th drive was a 3-and-out, before the Giants scored 10 points on their final two possessions. Even still, New York averaged just 3.81 yards per play, the third worst performance by the Giants since the start of the 2015 season.

{ 0 comments }

The Jets and Sam Darnold Have A Remarkable Debut

The savior

The Ravens blew out the Bills on Sunday, 47-3, giving Baltimore the biggest win of week one. Baltimore was a 7.5-point favorite, so the 44-point win means that the Ravens covered by 36.5 points.

That’s a lot. Last year, the Rams shocked the Colts with a 46-9 win, covering by 33.5 points.

Last night? The Jets began the Sam Darnold experience in the most ugly way possible: the rookie quarterback from USC threw a pick six on his first pass, something Jets fans are all too familiar with.

And then? It was a script for the ages for the Jets. Darnold went 16/20 for 198 yards with 2 TDs and 0 INTs the rest of the way. Free agent acquisition Isaiah Crowell rushed for 102 yards and 2 TDs on just 10 carries. Quincy Enunwa returned from a devastating injury and had 6 catches for 63 yards and a touchdown. 2016 first round pick Darron Lee, who has had an up and down career, recorded two interceptions, including a pick six. 2017 first round pick Jamal Adams picked up his first career interception. Trumaine Johnson, the team’s big acquisition at cornerback in free agency, had an interception; so too did the team’s big acquisition at cornerback in 2017, Morris Claiborne. Oh, and the Jets added a 79-yard punt return from Andre Roberts.

The Jets won 48-17, with the game ending as both team took knees near the Lions goal line. New York was a 7-point underdog, meaning the Jets covered by a whopping 38 points. That’s more than the Ravens this year or the Rams last year; in fact, it’s the fourth largest cover in opening week history!

In 1987, the Bucs, as 2-point home underdogs to Atlanta, beat the Falcons 48-10, covering by 40 points.

In 1998, in a game that is near and dear to Jets fans’ hearts, New York stunned Seattle 41-3 as 6.5-point underdogs (44.5 point cover) in the opening game of the Bill Parcells era.

Finally, in 1989, the Browns shut out the Steelers 51-0 despite being just 2-point favorites.

For New York, it was the 4th-largest cover in franchise history (or, at least, going back to 1978), behind the Seattle game in ’98, this upset over Houston in 1988, and this upset over the 2002 Chargers.

It was a game that was shocking on just about every level.  The Jets hadn’t scored a defensive or special teams touchdown since 2013; they did both on Monday night.  Since 2000, the Jets had thrown 5 or more interceptions in a game three times, but hadn’t done so to an opposing quarterback since 1999.  They did that to a Pro Bowler in Matthew Stafford (4 INTs) and his backup (Matt Cassel) on Monday Night. The Jets draft history has been disappointing in recent years, but then the team’s last three first round picks all had big nights.

Will this last for the Jets? Probably not. But for one night, it was the game Jets fans dream about. [continue reading…]

{ 0 comments }
Next Posts