≡ Menu

On Thursday, I posted a methodology to determine which wide receivers played on the most pass-happy teams, and yesterday, I posted another method of examining the same concept. Today, we will use the same approach to measure which receivers played in the most efficient passing offenses.

Efficiency is defined using Relative ANY/A, which is Team ANY/A minus League Average ANY/A. Let’s use Jerry Rice as an example. You will not be surprised to see that he generally played on very efficient passing offenses.  In 1995, Rice had 1,848 receiving yards, which was 8.1% of his career receiving yardage.  The 1995 49ers had a Relative ANY/A of +1.19 which means 8.1% of Rice’s career RANY/A grade is going to have a weight of +1.19.  Do this calculation for every season of his career, and you see that Rice had a career RANY/A of +1.57.

The table below shows the career RANY/A grades for all receivers with at least 5,000 receiving yards:

None of the Hall of Fame receivers have negative RANY/A grades, although Larry Fitzgerald and Calvin Johnson will probably change that.

Here’s a look at the 23 receivers with 8,000 career receiving yards and played on below-average passing teams:

You will not be surprised to see Joey Galloway on there at -0.45, at least not if you have been paying attention.

{ 1 comment }

Which receivers played on the most pass-happy teams? It’s a bit tricky to measure that: if a receiver played on run-heavy teams most of his career, but plays a couple of final seasons for teams that throw for 600+ attempts while he is a reserve, that would skew his average. So we need to adjust for a player’s best seasons when measuring how pass-happy his teams were.

Let’s use Calvin Johnson as an example. He played for the Lions in each season of his career, and Detroit has been very pass-happy throughout his career.  In 2015, he had 1,214 receiving yards, which was 10.4% of his career receiving yards.  That year, the Lions threw 632 times, or 39.5 times per game.  So for Johnson’s career pass-happy grade, 10.4% of it will be based off of an average of 39.5 attempts per game.  In 2012, Johnson had 16.9% of his career receiving total, so 16.9% of his pass-happy grade will be based off of the 740 attempts the Lions had that year.  Perform that analysis for every season, and Johnson has an adjusted average of teams throwing 39.5 times per game, as per the table below.

I did this calculation for every receiver in NFL history with at least 5,000 pass attempts. The table below is fully sortable and searchable, but it is initially sorted by career receiving yards. [continue reading…]

{ 0 comments }

Larry Fitzgerald led the NFL in receptions this year, with 107. That’s good, but how important is leading the league in catches? The triple crown is thought of as the leaders in receptions, receiving yards, and receiving touchdowns, but I think we can all agree that receiving first downs is a better indicator of receiver play than receptions. If I was in charge of stats-keeping, I’d place far more emphasis of receiving first downs than receptions, because receptions that don’t go for first downs are far less valuable than receptions that do go for a first down. And while receptions may be a decent proxy for receiving first downs, there’s a lot of variance there.

The leader in receiving first downs this year was Mike Evans, and he certainly had a better statistical year than Fitzgerald.  Evans had a stat line of 96-1321-12, with 81 first downs, compared to Fitzgerald’s 107-1023-6 and 59 first downs.  That’s right: Evans had 22 more first downs on just 11 fewer grabs, thanks to his 84.4% first down rate compared to Fitzgerald’s 55.1%. Evans dominated the league in this metric, finishing with 15 more than anyone else. [1]Best as we can tell, the record for receiving first downs in a season was 92, shared by Calvin Johnson (2012) and Marvin Harrison (2002), until Julio Jones broke it last year with 93. Evans finished with 6 out of the 100 votes cast for the AP All-Pro team, which seems like a criminally low number that would be higher in first downs were as widely-reported as they should be.

In the interest of data disclosure, the table below shows the receptions, receiving yards, touchdowns, *and receiving first downs* for the top receivers last season. I have also included each player’s receiving first down percentage, and their total number of Adjusted Catch Yards, defined here as receiving first downs * 9, plus receiving yards, plus receiving touchdowns * 11 (because a receiving TD already gets 9 yards since it is counted as a first down, too). [continue reading…]

References

References
1 Best as we can tell, the record for receiving first downs in a season was 92, shared by Calvin Johnson (2012) and Marvin Harrison (2002), until Julio Jones broke it last year with 93.
{ 58 comments }

Farewell to one of the greats

Farewell to one of the greats

Detroit Lions superstar wide receiver Calvin Johnson has likely retired. He had a pretty incredible six-year peak: Megatron gained 8,548 receiving yards in his last six years, the most by any player during their age 25-30 seasons. I don’t think there’s much of a debate that Johnson is a Hall of Famer, although I do think he’s not quite an inner circle member of the Hall.

The big reason for that is Johnson’s numbers have always been inflated by playing on a pass-happy team.  I’ve looked at this before, but (a) those numbers are now two years stale and (b) I want to use a different methodology today. So here’s what I did:

1) Calculate the number of pass attempts per game for each team in every season.

2) For the top 200 players, I then calculated the number of career games for that player.

3) Then, in each season, weight the number of team pass attempts per game by the percentage of games that player played relative to his entire career. For example, Johnson played 11.9% of his career games in 2012, and that year, the Lions threw 46.3 pass attempts per game. Therefore, for Johnson’s career, 46.3 pass attempts per game will be given a weight of 11.9%. Do this for every season of each player’s career, and you will derive the average pass attempts per game for that player. [continue reading…]

{ 20 comments }

Antonio Brown, after hearing he leads the league in ACY/TmAtt

Antonio Brown, after hearing he leads the league in ACY/TmAtt

Last year, Antonio Brown edged Jordy Nelson in Adjusted Catch Yards per Team Attempt by a few thousands of a yard. Brown beat Nelson for the True Receiving Yards crown in 2014, too, repeating as champion after a great 2013 campaign. Antonio Brown is awesome, so seeing him lead the league in a metric isn’t very surprising anymore. But let’s run through the process for new readers.

  • We begin with each player’s number of receiving yards. Then, we add 20 yards for every touchdown catch, and 9 yards (here’s why) for every first down gained (other than first downs that resulted in touchdowns). For Brown, this gives him exactly 1,900 Adjusted Catch Yards, as he has totaled 1,310 receiving yards, 57 first downs (including touchdowns), and 7 touchdowns this season.
  • Next, we divide that number by the number of team pass attempts, excluding sacks, [1]Why am I excluding sacks? Just to save time. In the offseason, I will re-run these numbers and include sack data. by that player’s offense in the games he played. Now Brown hasn’t missed a game this season, so it’s pretty simple: Pittsburgh has thrown 426 passes so far in 2015, which means Brown is averaging 4.46 ACY/TmAtt. By comparison, Julio Jones — who leads all players in Adjusted Catch Yards with 2,016 (1,338 receiving yards, 68 (!) first downs, 6 touchdowns) — is averaging “only” 4.21 ACY/TmAtt, because the Falcons have thrown 479 passes. Think of it this way: Jones has essentially played in one more, super high-volume passing game than Brown, yet has “only” 116 more Adjusted Catch Yards than him (and Brown is averaging 158 ACY/G). As a result, after adjusting for pass attempts, Brown is number one in this metric.
  • One player who really stands out by looking at Adjusted Catch Yards per Attempt but excluding games that player missed is Alshon Jeffery. The Bears wide receiver has had a somewhat quiet season: after all, he’s scored just two touchdowns and has missed five games. But the Bears have been pretty run-heavy this year, and Jeffery has been a first down machine. He has 47 catches for 690 yards and 37 first downs, good enough for 1,045 Adjusted Catch Yards in seven games. Chicago has thrown only 236 pass attempts in those games, giving Jeffery a remarkable 4.43 ACY/TmAtt average this year. Thought of another (perhaps simpler) way, Jeffery ranks 3rd in the NFL in receiving yards per game. In fact, the Bears have totaled just 49% of the pass attempts in Jeffery games as the Falcons have in Jones games, while Jeffery has 52% as many ACY. As a result, he slides past Jones into the number two slot.

[continue reading…]

References

References
1 Why am I excluding sacks? Just to save time. In the offseason, I will re-run these numbers and include sack data.
{ 4 comments }

Brown was number one in 2014

Brown was number one in 2014

On Monday, I noted that Pittsburgh wide receiver Antonio Brown led the NFL in True Receiving Yards for the second straight season. He also, by the slimmest of margins, your leader in Adjusted Catch Yards per Attempt, too.

On October 1st, I looked at the leaders in Adjusted Catch Yards per Team Pass Attempt; at the time, Jordy Nelson had a big lead on the rest of the NFL, although Brown was in second place. You can read the fine details of the system in that post, but the short version is:

  • Begin with each player’s number of receiving yards. Add 9 yards for every first down gained, other than first downs that resulted in touchdowns, to which we add 20 yards. For Brown, this gives him 2,624 Adjusted Catch Yards (1,698 receiving yards, 87 first downs, 13 touchdowns).
  • Divide that number by the number of team pass attempts, including sacks, by that player’s offense. Pittsburgh recorded 645 dropbacks in 2014, which means Brown averaged 4.07 ACY/TmAtt. Jordy Nelson (1519/71/13) had 2,301 Adjusted Catch Yards and the Packers had 566 team pass attempts. That translates to .. 4.07 ACY/TmAtt, too. But go to three decimal places, and Brown (4.068 to 4.065) becomes your winner.
  • I have also included a column for Adjusted Catch Yards per Estimated Team Dropback; here, we use the same formula, but multiply the numerator by 16, and the denominator by the number of games played by the receiver. Let’s use Odell Beckham as an example. The Giants wide receiver finished with 1,959 ACY (1305/58/12) and New York had 637 dropbacks, giving Beckham 3.08 ACY/TmAtt. But if we adjust for the fact that Beckham missed four games, he gets credited with 4.10 ACY/EstTmAtt, which is the highest rate in the NFL.

The table below shows the top 50 receivers in ACY/TmAtt: [continue reading…]

{ 5 comments }

Leading Receivers Trivia

The GOAT

The GOAT.

Roger Craig, 1985.

Terrell Owens, 1999.
Terrell Owens, 2000.
Tim Brown, 2001.

Neil Paine wrote a fantastic post today at 538 about wide receivers competing with their teammates for production. That inspired me to start crunching some numbers. From 1985 to 2003, Jerry Rice played in at least 8 games in 18 different seasons. In fourteen of those seasons — including every year from age 24 through age 36, inclusive — Rice led his team in receiving yards per game. In the other four years, Rice ranked 2nd on his team in receiving yards per game, and usually not far behind the number one man. [1]In ’85, Craig averaged 63.5 YPG, while Rice averaged 57.9. In 2000, Rice led the team in receiving yards, but Owens averaged 53.9 yards per game, Rice 51.9. Owens blew Rice out of the water … Continue reading Rice finished his career with a forgettable season in Seattle, where three more players — Darrell Jackson, Koren Robinson, and Bobby Engram — out-gained a 42-year-old Rice in receiving yards per game.

What about Marvin Harrison? He led the Colts in receiving yards per game in nine of his 12 seasons in which he played in at least eight games. In 1997, Sean Dawkins edged a Harrison by 3.3 yards per game. In 2004, Reggie Wayne bested Harrison by six yards per game. And in Harrison’s final year, both Wayne and Dallas Clark outgained Harrison. [continue reading…]

References

References
1 In ’85, Craig averaged 63.5 YPG, while Rice averaged 57.9. In 2000, Rice led the team in receiving yards, but Owens averaged 53.9 yards per game, Rice 51.9. Owens blew Rice out of the water in 2000; in 2001, Brown edged him, 72.8-71.2.
{ 10 comments }

Gordon smoked the defensive back on this play

Gordon smoked the defensive back on this play.

Josh Gordon led the league with 1,646 receiving yards last year. That’s impressive: perhaps even more impressive is that he did it on “only” 159 targets, meaning he averaged 10.35 yards per target. [1]That’s the most of any receiver with over 130 targets. It’s the second most among players with 100 targets, behind DeSean Jackson‘s 10.6 average on 126 targets. It’s the … Continue reading But the most impressive part, of course, was that he did it for the Browns. You know, the Browns, quarterbacked by a three-headed monster of Jason Campbell, Brandon Weeden, and Brian Hoyer, each of whom managed to average a around the same mediocre 6.4 yards per attempt.

Here’s another way to think of it. While Jordan Cameron was somewhat efficient (7.7 yards per target), the other three Browns to finish in the top five in Cleveland targets were Greg Little (4.7 yards per target), Chris Ogbonnaya (4.6), and Davone Bess (4.2!). And here’s yet another way to think of it: the Browns threw 681 passes last year and gained 4,372 passing yards. But 1,646 of those yards came on the 159 passes intended for Gordon. Remove those plays, and Cleveland averaged just 5.22 yards per pass attempt on passes to all other Browns last year.

That means Cleveland averaged 5.13 more yards per target on passes to Gordon in 2013 than on passes to everyone else. That’s insane, particularly over 159 targets. How insane? If we multiply those two numbers, we get a “value relative to teammates” metric: Gordon gained 816 more yards on his targets than the other Browns averaged per target. Now, in the abstract, maybe 816 doesn’t mean much to you. But it’s the most of any player since at least 1999. The table below shows the top 75 wide receivers in value relative to teammates: the columns should be self-explanatory, and the “ROT Y/A” shows the yards per attempt on passes to the rest of the team. As always, it’s fully sortable and searchable; by default, it displays only the top 25 receivers, but you can switch that by clicking on the dropdown box to the left. [continue reading…]

References

References
1 That’s the most of any receiver with over 130 targets. It’s the second most among players with 100 targets, behind DeSean Jackson‘s 10.6 average on 126 targets. It’s the third most among players with more than 60 targets, behind Jackson and Doug Baldwin (10.7, 73). And it’s the fourth most among players with at least 40 targets, behind Jackson, Baldwin, and Kenny Stills (12.8, 50).
{ 5 comments }
Megatron at his best

Megatron at his best.

In his seven-year career, Calvin Johnson has already recorded 9,328 receiving yards. And for those curious about these sorts of things, he’s the career leader in receiving yards per game at 88.0, too. But Johnson has also benefited greatly from playing on teams that have thrown a weighted average of 635 pass attempts per season.

What is a weighted average of team pass attempts? I’m defining it as an average of pass attempts per season weighted by the number of receiving yards by that player. Why use that instead of a simple average? When thinking about whether a receiver played for a run-heavy or pass-happy team, we tend to think of that receiver during his peak years. If he caught 10 passes for 150 yards as a rookie on a very pass-happy team, that should not be given the same weight as the number of pass attempts his team produced in his best season. For example, here is how I derived the 635 attempt number for Megatron.

Twenty-one percent of his career receiving yards came in 2012, when Detroit passed 740 times (excluding sacks). Therefore, 21% of his team pass attempts average comes from that season, while 18% comes from his 2011 season, 16% from his 2013 season, and so on. In the table below, the far right column shows how we get to that 635 figure: by multiplying in each season the percentage of career receiving yards recorded by him in that season by Detroit’s Team Pass Attempts.

There are 121 players with 7,000 career receiving yards. Unsurprisingly, Johnson has the highest weighted average number of team pass attempts, which must be recognized when fawning over his great raw totals. Marques Colston is just a hair behind Johnson, but no other player has an average of 600+ team pass attempts.

The table below contains data for all 121 players (by default, the table displays only the top 25, but you can change that). Here’s how to read it, starting with the GOAT: Jerry Rice ranks first in career receiving yards, and he played from 1985 to 2004. Rice played in 303 games, gained 22,895 receiving yards, and his teams threw a weighted average of 547 passes per season. Among these 121 players, that rank Rice as playing for the 25th highest or most pass-happy team. Rice also averaged 76 receiving yards per game, which ranks 5th among this group. [continue reading…]

{ 16 comments }

Brady needs to channel another Tom (Flores) this season

Brady needs to channel another Tom (Flores) this season

As Jason Lisk and I wrote about before the season, Tom Brady and Ben Roethlisberger have become something of the poster children so far this year when it comes to veteran QBs working with inexperienced and otherwise less-than-notable receiving groups. And, lo and behold, each has put up career-low RANY/A marks through 2 games. But how do their receiving corps rank relative to those of other teams so far this year, and how do they stack up historically?

To take a stab at answering these questions, I turned to True Receiving Yards. For each player who debuted in 1950 or later, I computed their Weighted Career True Receiving Yards for every year, as of the previous season, to get a sense of how experienced/accomplished they’d been going into the season in question. Then, I calculated a weighted averaged of those numbers for every receiver on a given team, using TRY during the season in question as the weights. For example, here are the 2013 Patriots receivers:

PlayerAgeDebutTRY% of TmAt-the-time WCTRY
Julian Edelman27200913938%615.7
Danny Amendola2820097220%1541.9
Kenbrell Thompkins2520135615%0.0
Shane Vereen2420114412%110.9
Aaron Dobson2220134312%0.0
Michael Hoomanawanui25201051%278.8
James Develin25201341%0.0
Weighted Average560.7

The way to read that is: Julian Edelman has accounted for 38 percent of the Pats’ TRY so far. Going into the season, he had a career Weighted TRY of 615.7, so he contributes to 38% of the 2013 Pats’ weighted average with his 615.7 previous career weighted TRY; Danny Amendola contributes to 20% of the team weighted average with his 1541.9 previous career weighted TRY; etc. Multiply each guy’s previous weighted career TRYs by the percentage of the team’s 2013 TRY he contributed, and you get a cumulative weighted average of 560.7 — meaning the average TRY of a 2013 Pats receiver has been gained by a guy who had a previous career weighted TRY of 560.7.

Is that a low number? Well, here are the numbers for all of the 2013 team receiving corps (not including Thursday night’s Eagles-Chiefs tilt), inversely sorted by weighted average (asterisks indicate rookies):

[continue reading…]

{ 3 comments }

This guy was pretty good.

This guy was pretty good.

About a month ago, Chase & I developed a stat called True Receiving Yards, which seeks to put all modern & historical receiving seasons on equal footing by adjusting for the league’s passing YPG environment & schedule length, plus the amount the player’s team passed (it’s easier to produce raw receiving stats on a team that throws a lot), with bonuses thrown in for touchdowns and receptions. It’s not perfect — what single stat in a sport with so many moving parts is? — but it does a pretty good job of measuring receiving productivity across different seasons and across teams with passing games that operated at vastly different volumes.

Anyway, today’s post is basically a data dump to let everyone know we’ve extended TRY data back to 1950 (before, it was only computed for post-merger seasons). Here are the new all-time career leaders among players who debuted in 1950 or later (see below for a key to the column abbreviations):
[continue reading…]

{ 13 comments }

Straight cash, homey.

Straight cash, homey.

In 1998, 21-year-old Randy Moss made a stunning NFL debut, racking up 17 touchdowns and 1,260 True Receiving Yards, the 2nd-best total in football that season. The Vikings’ primary quarterback that year, Randall Cunningham, was a former Pro Bowler and MVP, but all that seemed like a lifetime ago before the ’98 season. He’d been out of football entirely in 1996, and in 1997 he posted an Adjusted Net Yards per Attempt average that was 1.2 points below the league’s average (for reference’s sake, replacement level is usually around 0.75 below average). With Moss in ’98, though, Cunningham’s passing efficiency numbers exploded: he posted a career best +3.2 Relative Adjusted Net Yards per Attempt, miles ahead of his perfectly-average overall career mark. If we adjust for the fact that Cunningham was also 35 at the time (an age at which quarterbacks’ RANY/A rates tend to be 1.1 points below what they are at age 27), Cunningham’s 1998 rate was actually 4.3 points better than we’d expect from the rest of his career, a staggering outlier.

The following year, Jeff George took over as the Vikings primary quarterback, and he promptly posted a Relative ANY/A 2.2 points higher than expected based on his age and the rest of his career. [1]Cunningham’s RANY/A was also 1.0 better than expected in limited action. George left Moss and Minnesota after the season, and he would throw only 236 passes the rest of his career, producing a cumulative -0.6 RANY/A in Washington before retiring.

From 2000-04, Moss was the primary target of Daunte Culpepper, whose RANY/A was 0.7 better than expected (based on Culpepper’s career numbers) when Moss was around. [2]That number is an average weighted by the number of TRY Moss had in each season Although he’d enjoyed one of the best quarterback seasons in NFL history in 2004, Culpepper was never the same after Moss was traded to Oakland; in fact, he never even had another league-average passing season, producing a horrible -1.2 RANY/A from 2005 until his retirement in 2009. [3]To be fair, Culpepper tore his ACL, MCL, and PCL halfway through the 2005 season, which also was a factor in his decline.

Moss’s stint with the Raiders was famously checkered — although Kerry Collins’ RANY/A was 0.6 better than expected in 2005, Aaron Brooks played 2.5 points of RANY/A below his previous standards in 2006 — but we all know what happened when he joined the Patriots in 2007. With Moss, Tom Brady’s RANY/A was a whopping 1.3 points higher than expected from the rest of his career, and Moss also played a big role in Matt Cassel’s RANY/A being +1.0 relative to expectations after Brady was lost for the season in 2008.

While Moss’s post-Pats career hasn’t exactly been the stuff of legends, the majority of his career (weighted by True Receiving Yards) saw him dramatically improve his quarterbacks’ play relative to the rest of their careers. In fact, his lifetime WOWY (With or Without You) mark of +1.1 age-adjusted RANY/A ranks 3rd among all receivers who: a) had at least 3,000 career TRY, b) started their careers after the merger, and c) played exclusively with quarterbacks who started their careers after the merger. And the first two names on the list are possibly explained by other means. The table below lists all 301 receivers with 3,000 career TRY. The table is fully sortable and searchable, and you can click on the arrows at the bottom of the table to scroll. The table is sorted by the QB WOWY column.
[continue reading…]

References

References
1 Cunningham’s RANY/A was also 1.0 better than expected in limited action.
2 That number is an average weighted by the number of TRY Moss had in each season
3 To be fair, Culpepper tore his ACL, MCL, and PCL halfway through the 2005 season, which also was a factor in his decline.
{ 7 comments }
As always, the G.O.A.T.

As always, the G.O.A.T.

On Thursday, Neil and I introduced you to the concept of True Receiving Yards. That’s required background reading, but in a nutshell, True Receiving Yards is designed to place all receivers since 1970 into the same environment. It starts with receiving yards, but gives a bonus for receptions and touchdowns, adjusts for how frequently a player’s team passes, adjusts for the league passing environment, and adjusts for the number of games played on the NFL schedule in that season.

Neil and I listen to your comments, and we’ve made a big tweak to the methodology: we agree that True Receiving Yards, version 1.0, was a bit biased in favor of receivers on low-volume passing teams.  Based on yesterday’s research, we are now going to limit the adjustment for how frequently a player’s team passes (relative to league average) to just 50% of the old adjustment.

This now moves Cliff Branch up to #1 on the single-season list, presented below.  Let’s run through the math one time to explain it. In 1974, Branch’s 60-1092-13 stat line translates to 1,652 Adjusted Catch Yards. The Adjusted Catch Yards to Receiving Yards ratio for the entire league that season was 65.6%, so that translates to 1,083 receiving yards for Branch.  Now, the league average team that year passed 401 times, while Oakland had just 359 dropbacks. Instead of an 11.7% adjustment in Branch’s favor (as we did in TRYv1.0), he gets a 5.85% adjustment, bringing him up to 1,146 yards. Next, we multiply that by 214.54 (the average receiving yards per game over the 43-year period) and divide by 171, which represents the low-octane era of 1974; that gives us 1,436 yards. Finally, we pro-rate to 16 games, and end up with 1,641 True Receiving Yards. That’s the most in any season since 1970:
[continue reading…]

{ 9 comments }

Calvin Johnson doesn't like adjustments for pass attempts

Calvin Johnson doesn't like adjustments for pass attempts.

On Thursday, Neil and I introduced you to the concept of True Receiving Yards. True Receiving Yards is designed to place every receiver into the same environment. TRY starts with receiving yards, but gives a bonus for receptions and touchdowns, adjusts for how frequently a player’s team passes, adjusts for the league passing environment, and adjusts for the number of games scheduled for the team that season.

The bolded adjustment caused some consternation for some of the commenters. Some folks feel that if Team X passes twice as often as Team Y, we shouldn’t just expect the top WR on Team X to gain as many receiving yards as the top WR on Team Y. There’s some merit to that argument: in general, high-pass teams probably have more receivers on the field on a given play, and low-pass teams are often in more favorable situations. Being the only wide receiver on the field on a play-action pass is probably an easier situation to gain yards than being one of four wide receivers in an obvious passing situation.

In other words, some feel that we shouldn’t expect a one-to-one increase in receiving yards (or Adjusted Catch Yards) relative to team pass attempts. Is there a way to test that? Neil and I came up with three such methods.

Year-to-Year Case Study

Neil looked at all wide receivers since 1970, ages 23-30, who started every game for the same team in back-to-back seasons (Years Y and Y+1). The sample was 245 pairs of player-seasons, after removing 2 extreme outliers: Drew Hill 1985 (went from 335 True Receiving Yards without the team attempt adjustment in 1984 to 1048 in 1985) and Roger Carr 1976 (went from 591 to 1438).
[continue reading…]

{ 10 comments }

True Receiving Yards, Part I

One of many Rams greats to wear #29

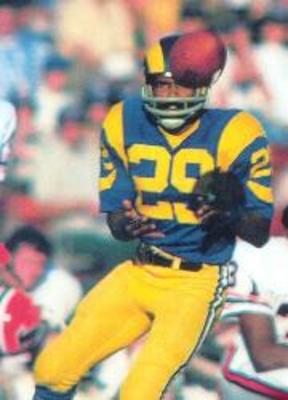
One of many Rams greats to wear #29.

As you guys know, Neil Paine is the man. Here’s the latest reason: he came up with a metric called True Receiving Yards, the latest in a long line of thoughts in our Wide Receiver Project. So, what are True Receiving Yards?

We start with Adjusted Catch Yards, defined as 5 * Receptions + Receiving Yards + 20 * Receiving Touchdowns.

1) Then, we convert each player’s Adjusted Catch Yards to the same scale as pure receiving yards using the following formula:

Adjusted Catch Yards * League Receiving Yards / League Adjusted Catch Yards

2) Next, we adjust for how often the receiver’s team passed.  We use the following formula:

[Result in Step 1] * League_Avg_Team_Pass_Attempts / Team_Pass_Attempts

For purposes of this post, Team Pass Attempts include sacks.

3) Then we adjust for the league passing environment, by using this formula:

[Result in Step 2] * by (214.54/Avg_Team_Receiving_Yards_Per_Game).

Why 214.54? Because that’s how many yards the average NFL team has passed for in each season since 1970.

4) Finally, we need to adjust for schedule length. This one’s pretty simple:

[Result in Step 2] * 16 / Team Games

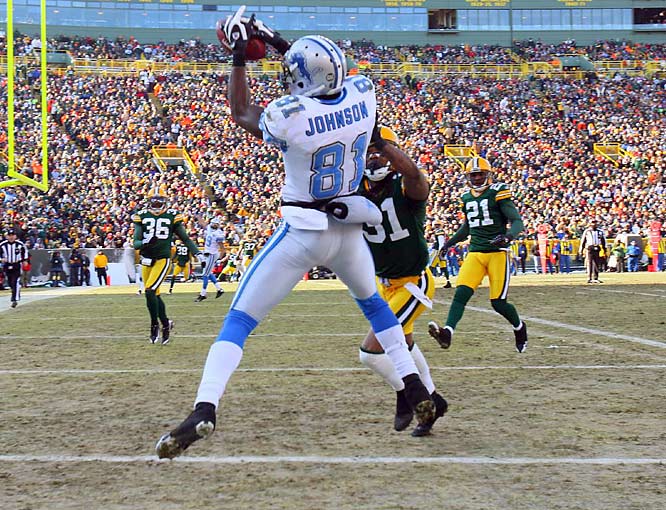
As it turns out, the single-season leader in True Receiving Yards is….. Harold Jackson for the 1973 Rams. That will probably surprise some folks; heck, it surprised me. So let’s walk through Jackson’s season by comparing it to Calvin Johnson’s 2012. Jackson caught 40 passes for 874 yards and 13 touchdowns. That gives him 1,334 Adjusted Catch Yards, while Megatron’s 122-1964-5 translates to 2,674 Adjusted Catch Yards, more than twice what Jackson produced.

1) First, we need to convert those ACY numbers into receiving yards.  In 1973, that conversion ratio is 65.5%, and in 2012, it was 64.5%; this means Jackson is credited with 874 receiving yards (ironically, his actual number) while Johnson is pushed down to only 1,725 yards. This is because Johnson had a ton of yards but only five touchdowns.  In other words, based on his receptions, receiving yards, and receiving touchdowns, Johnson was more like a 1,725-yard receiver last year.

2) Jackson’s Rams had just 288 Team Pass Attempts, while the average team in 1973 averaged 373.3 pass attempts. So we need to bump Jackson up by 29.6%, which would give him 1,132 receiving yards. The 2012 Lions had 769 Team Pass Attempts compared to a league average of 592.4; therefore, we need to give Johnson credit for only 77% of his ACY, bringing him down to 1,329 receiving yards.

3) Next, we adjust for league environment. In 1973, the average team passed for 159 yards per game, which means we need to bump Jackson up by 34.6% (the result of 214.54 divided by 159); this gives him 1,524 receiving yards. For Megatron, since the average team in 2012 passed for 246 yards per game, we need to multiply his result in step 2 by 87.2%, leaving him with only 1,159 receiving yards.

4) For Calvin Johnson, that’s it: he is credited with 1,159 True Receiving Yards, after reducing his numbers for playing in a pass-happy offense, playing in a pass-happy era, and not having many touchdowns. For Jackson, his 1,524 gets pro-rated to a 16-game season, giving him 1,742 True Receiving Yards.
[continue reading…]

{ 33 comments }

Smith likes ranking receivers by yards per team attempt

Smith likes ranking receivers by yards per team attempt.

When I wrote my ode to Steve Smith earlier this week, I discovered an incredible stat. In 2008, Smith played in 14 games and gained 1,421 receiving yards. But the more incredible part is that the Panthers passed only 352 times in 2008, meaning Smith averaged an absurd 4.04 yards per team pass attempt. At this point, we all know that passing yards is a meaningless way to measure quarterbacks: yards per attempt is a much better indicator of talent. It’s much easier to throw for 4,000 yards on 600 attempts than it is on 500 attempts, and it’s silly to pretend otherwise. But most analysts don’t make the same adjustment when dealing with the man catching those passes. But it’s much easier to gain 1,500 receiving yards on a team that passes 700 times than it is to do it on a team that passes only 500 times. Hence my interest in Yards per Team Pass Attempt as a statistic.

So, how absurd was Smith’s 4.04 Yards per attempt average? We have individual player game logs going back to 1960, so I went through and measured every game each receiver “played” in each season since then. I use that word in quotes, because it’s possible that a receiver was active in a game but did not record any statistics, and therefore he may not show up in our game logs. That caveat aside, the table below shows the single-season leaders since 1960 in Receiving Yards per Team Pass Attempt (minimum 170 passes, so I could bring in Paul Warfield), with only the games in which the player “played” counting in the attempts column. As always, the table is sortable and searchable, and you can click the arrows at the bottom to scroll to the next names on the list (the table contains the 138 receivers to average 2.75 Yd/Att.)
[continue reading…]

{ 5 comments }

Smith has excelled despite playing for a ground-based attack

Smith has excelled despite playing for a ground-based attack.

We don’t rank quarterbacks by passing yards because “passing yards” is largely a function of pass attempts. The same is true for receiving yards, as the number of times a team passes the ball has a big impact on a receiver’s yardage total. I’ve spent some time this year looking at ways to rank wide receivers and am throwing another log on that fire today. One idea I like in theory is receiving yards per team pass attempt, as it helps to solve the problem of dealing with receivers who play on pass-heavy teams.

But there are some obvious drawbacks to that approach. There are more passing options on the field now than ever before, so it’s tough to use receiving yards per team pass attempt across eras. For example, Jim Benton in 1945 owns the record in this metric at 5.36 yards per team attempt in 1945; even if you consider that high number a byproduct of World War II, Harlon Hill averaged 4.5 yards per team pass in 1956 for the Bears. Carolina’s Steve Smith is the single-season leader in yards per team attempt since 1970. And he also holds down the #2 on that list. Smith averaged 3.48 yards per team pass attempt in 2005; three years later, he averaged 3.43 Yd/TPA (but in the 14 games he played, Smith averaged an absurd 4.04 Yd/TPA).

A few weeks ago, I ranked receivers by their percentage of team receiving yards in their best six seasons. I thought it would be fun to do the same thing with yards per team pass attempt (excluding sacks). The results are listed below for the top 200 receivers; I’ve also included the six years selected for each receiver to come up with their average. As always, you can use the search box to find your favorite receiver, and the table is sortable, too. [1]Note that I am only giving a receiver credit for his receiving yards with each team in each season, so for say, Wes Chandler, his 1981 season is undervalued.
[continue reading…]

References

References
1 Note that I am only giving a receiver credit for his receiving yards with each team in each season, so for say, Wes Chandler, his 1981 season is undervalued.
{ 18 comments }

Bambi shouldered much of the Chargers passing offense.

Bambi shouldered much of the Chargers passing offense.

Seven years ago, Doug wrote this post analyzing wide receivers by team receiving yards. That post was overdue for an update for three reasons: (1) it was written seven years ago; (2) Doug only went back to 1978, while we now can go back to 1932; and (3) I think using Adjusted Catch Yards (which gives receivers 5 additional yards for every reception and 20 additional yards for every touchdown) is better than just using receiving yards.

For every year of every receiver’s career, I computed the percentage of his team’s Adjusted Catch Yards that he accounted for. I then averaged together each receiver’s 6 best six seasons according to that metric, and ignored all wide receivers who have played in fewer than six seasons. The results are listed below for the 161 receivers to hit the 25% mark, along with the six years selected for each receiver. As always, you can use the search box to find your favorite receiver, and the table is sortable, too.
[continue reading…]

{ 10 comments }

Examining Paul Warfield’s career

Warfield played for Woody Hayes, Paul Brown, Don Shula, and John McVay

Warfield played for Woody Hayes, Don Shula, and John McVay.

Paul Warfield has been confounding stat heads for years. Warfield was a rare first-ballot Hall of Fame wide receiver and one of the most athletic and talented wide receivers in history. However, his statistics look downright unimpressive to the modern eye. That’s not too surprising, though, since he played the prime of his career in football’s deadball era for one of its best teams.

I was pretty happy when I noticed that Warfield ranked 16th in my wide receiver ranking project last month; that’s much higher than most (all?) stats-based ranking systems place him, although some would argue that it would still underrate him.

One way to understand Warfield’s statistics is to see just how infrequently his teams passed. The table below shows some of the top wide receivers in football history to enter the league since 1960, including some Warfield contemporaries like Gary Garrison, Fred Biletnikoff, Harold Carmichael, and Gene A. Washington. While career numbers are interesting, you can often learn more by just looking at a player’s best seasons.

The table below shows the top 7 seasons for each wide receiver (based on the formula from this post) and how many pass attempts per game his team attempted during those seasons:
[continue reading…]

{ 12 comments }

Don Hutson and Curly Lambeau

Don Hutson is down with era adjustments.

I’ve written several posts about how to grade wide receivers and did a three-part series on one ranking system two weeks ago. Grading wide receivers requires one to adjust for era, but there are many different ways to do that.

Calvin Johnson caught 122 passes last year for 1,964 yards and five touchdowns. In 1973, Harold Carmichael had 67 receptions, 1,116 yards and nine scores. Which season was better? You might be inclined to think Johnson’s season was much better regardless of era, but both receivers led their respective leagues in both receptions and receiving yards. But let’s think about it another way.

In 1973, all the players on the 26 teams in the NFL combined for a total of 4,603 catches and 58,009 receiving yards. That means Carmichael was responsible for 1.46% of all receptions and 1.92% of all receiving yards. Of course, with only 26 teams, we need to multiply those numbers by 26/32 make for an apples-to-apples comparison of the modern environment. If we want to transport Carmichael into 2012, that means he needs to be credited with 1.18% of all receptions and 1.56% of all receiving yards accumulated last year. That would give him 128 catches and 1,970 receiving yards, and thanks to recording 1.93% of all receiving touchdowns in 2012, 14.6 touchdowns.

This analysis is actually unfair to active players, as there are more three-, four-, and five-wide receiver sets than ever before. Elroy Hirsch gained 1,495 receiving yards in 12 games — an outstanding rate of production in any era — but that translates to an absurd 2,667 receiving yards in 2012. In Don Hutson’s magical 1942 season, after multiplying by 10/32, he gained 2.3% of the league’s receptions, 2.8% of the receiving yards, and 4.9% of the touchdowns — for a 254/3501/37 stat line.
[continue reading…]

{ 6 comments }

On Monday, I explained my methodology for ranking every wide receiver in football history, and yesterday, I presented a list of the best single seasons of all time. Today the career list of the top 150 wide receivers. As usual, I implemented a 100/95/90 formula, giving a player credit for 100% of his production in his best season, 95% of his value in his second-best season, 90% in his third year, and so on. The table below is fully sortable and lists the first and last year each person played wide receiver [1]Note that I have excluded seasons where a wide receiver played running back or tight end. This is generally not a big deal, but does hurt someone like Lenny Moore.; you can use the search feature to find the best receiver to ever play for each team (for example, typing ‘ram’ for the Rams ‘clt’ for the Colts.)
[continue reading…]

References

References
1 Note that I have excluded seasons where a wide receiver played running back or tight end. This is generally not a big deal, but does hurt someone like Lenny Moore.
{ 55 comments }

Yesterday, I explained my methodology for ranking every wide receiver in football history. Today I’m going to present a list of single-season leaders, which presents some problems.

I think the method I described yesterday does a good job adjusting for era, as receivers are only given credit for their yards above the baseline, which is different each season. But there are some other complicating factors unique to football. Seasons have had varying lengths: a receiver who plays 12 games in a 12-game season can’t be penalized the way you would penalize a receiver who only plays in 12 games now. Since older receivers are generally at a disadvantage for many reasons, I decided to simply pro-rate the value for all non-16 game seasons as if it was a 16-game season. However, I have also included downward adjustments for players in other leagues and during World War II. [1]The fine print: For players in 1943, 1944, and 1945, and for players in the AAFC, I only gave the receivers credit for 60% of the value they created. For the AFL, I gave players 60% of their value in … Continue reading

The table below lists the top 200 wide receiver seasons of all-time.
[continue reading…]

References

References
1 The fine print: For players in 1943, 1944, and 1945, and for players in the AAFC, I only gave the receivers credit for 60% of the value they created. For the AFL, I gave players 60% of their value in 1960 and 1961, 70% in 1962, 80% in 1963, 90% in 1964, and 100% in 1965 through 1969. In case it wasn’t obvious, all of these adjustments are arbitrary.
{ 12 comments }

We know how this story will end.

We know how this story will end.

Regular readers know that one of my projects this off-season is to come up with a better way to grade wide receivers. I first attempted to rank every wide receiver four years ago. That study, which I will reproduce this week, has some positives and negatives. My goal is to eventually come up with four or five different ranking systems, so consider the series this week to be the first of several ranking systems to come.

The first step in this system is to combine the three main stats — receptions, receiving yards and receiving touchdowns — into one stat: Adjusted Catch Yards. We know that a passing touchdown is worth about 20 yards, so I’m crediting a receiver with 20 yards for every touchdown reception. Next, we need to decide on an appropriate bonus for each reception.

We want to give receivers credit for receptions because, all else being equal, a receiver with more receptions is providing more value because he’s likely generating more first downs. I looked at all receivers over a 12-year period who picked up at least 30 receiving first downs. I then used the number of receptions and receiving yards those players had as inputs, and performed a regression to estimate how many first downs should be expected. The best-fit formula was:
[continue reading…]

{ 6 comments }

The predictive value of target data, part II

On Monday, I argued that target data has some predictive value. I wanted to update that post with a few observations.

Wide Receiver Targets

In the original post, I looked at year-to-year data for all players with at least 500 receiving yards in Year N and at least 8 games played for the same team in Years N and N+1. But it makes more sense to limit the sample to only wide receivers if we want to predict how wide receivers project in the next season.

There are 554 pairs of wide receiver seasons that meet the above criteria. [1]I have again pro-rated all seasons to sixteen games. The best fit formula to project future receptions based on prior receptions and prior targets is:

Year N+1 Receptions = 14.0 + 0.547 * Yr_N_Rec + 0.124 * Yr_N_Tar

The R^2 is 0.39, and while the receptions variable is statistically significant by any measure, the targets variable just barely qualifies (p = 0.044) as such. Still, this tells us that for every 8 additional targets a receiver sees in Year N, we can expect one more reception in Year N+1, holding his number of receptions equal.

If we want to project receiving yards instead of receptions, we get:

Year N+1 Receiving Yards = 180.3 + 0.434 * Yr_N_RecYd + 2.55 * Yr_N_Tar

The R^2 is 0.33, implying a slightly less strong relationships, which makes sense: yards are more variable to large outliers than receptions, so you would expect receiving yards to be slightly harder to predict. Another interesting note: the targets variable here is statistically significant at the p = 0.0003 level, and as expected, the receiving yards variable is statistically significant at all levels. Holding receiving yards equal, a receiver would need an additional 19 targets to increase his projected number of receiving yards by 50, so the practical effect may not be all that large.

Addressing the multicollinearity problem
[continue reading…]

References

References
1 I have again pro-rated all seasons to sixteen games.
{ 2 comments }

Analyzing the leaders in targets in 2012

Reggie Wayne led the NFL in targets last year, but that’s a little misleading since the Colts ranked 6th in pass attempts. As a percentage of team targets, Wayne ranked second in the league, but he was a distant number two to Brandon Marshall, who saw two out of every five Bears passes in 2013.

But that doesn’t make him the best receiver. It was easier for Marshall to receive a high number of targets because the rest of the Chicago supporting cast was weak, so Jay Cutler consistently looked Marshall’s way. Chicago ranked 25th last year in Adjusted Net Yards per Attempt, so essentially we have a player on a bad passing offense receiving a ton of targets. It’s not all that obvious how you compare a player like that to Roddy White, who deserves credit for being in a great passing offense but loses targets because of the presence of Julio Jones and Tony Gonzalez (of course, without them, would Matt Ryan start looking like Jay Cutler?)

I identified the leader in targets for each team, and then calculated the percentage of team targets each leading receiver had in 2012. The table below lists that percentage on the Y-Axis; the X-Axis represents the number of ANY/A that player’s team averaged. Someone like Marshall (represented by the first four letters of his last name and the first two letters of his first name, MarsBr) will therefore be high and to the left, while Randall Cobb is low and to the right:

2012 targets
[continue reading…]

{ 16 comments }

The predictive value of target data

Demaryius Thomas made the most of his targets in 2012.

Demaryius Thomas made the most of his targets in 2012.

In 2007, Doug Drinen and I wrote a pair of articles discussing our views on targets. I’m working on a wide receiver project this off-season, and a complete discussion of receiving statistics includes a discussion of targets.

Let me start with the prevailing few: targets are important, and if two receivers have the same production on a different number of targets, the one who produced on fewer targets is better/more valuable. Similarly, if all else is equal, the receiver with a higher catch rate — calculated as catches/target — is the better/more valuable one.

There are some problems with the prevailing view. By placing targets in the denominator of a formula, we’re implying that targets are a bad thing, or at a minimum, an opportunity wasted. But targets aren’t like pass attempts. Pro Football Focus has a stat called yards per pass route run, and that actually is the receiver version of yards per pass attempt. [1]Unfortunately, yards per pass route run is not going to help us if we want to grade receivers on a historical basis.

But targets don’t help identify the player who deserves blame: on a random incomplete pass, assume three receivers are running routes, and one of them is targeted. Absent a drop, I have a hard time saying that of the three wide receivers, the targeted one did the worst of the three. If we grade a receiver by his yards per route run, each receiver is equally penalized with one route run on the play; if we grade a receiver by yards per target, the two wide receivers that did not get open are not penalized, while the one that was targeted is penalized. That seems fundamentally wrong to me.

Here’s another problem: In a broad sense, the player with more targets (or percentage of his team’s targets) is in a very real sense a bigger part of his team’s offense. Either he’s open more often, or the quarterback is throwing in his direction even when he’s not open (whether because the coaches call more plays for him or because he’s earned the quarterback’s trust). In any event, the target itself is an indicator of quality, and penalizing a player — which is what you do when you place targets in the denominator — for an event that is highly correlated with quality is not something I’m comfortable doing.
[continue reading…]

References

References
1 Unfortunately, yards per pass route run is not going to help us if we want to grade receivers on a historical basis.
{ 12 comments }

Trivia: Single-season Leaders in Yards per Target

San Diego’s Danario Alexander caught 37 passes for 658 yards and 7 touchdowns in 10 games last year. Those might not look like great numbers, but when Philip Rivers looked his way, Alexander tended to produce. Alexander only saw 62 targets last season, but led the league with a 10.6 yards-per-target average (minimum 50 targets). Since 2000, there have been 21 receivers to average at least 11 yards per target on 50 targets.

I’ve blanked out the first two rows, because the same player has recorded the two highest yards/target seasons over the last thirteen years. Can you guess who it is?
[continue reading…]

{ 10 comments }

The off-season is here.

But Football Perspective isn’t going anywhere. I prefer off-season writing to in-season writing, as football theory and history is more compelling to me than figuring out whether to rank the Lions ahead of the Bills. At the old Pro-Football-Reference Blog, we did some of our best work in the off-season, and I hope for the same results here.

Evan Silva just published a great piece detailing what each team needs in the off-season, but you’re not going to find that type of article here in the off-season. I will have some draft articles, but I don’t intend on staying topical all that often. My first big off-season project is to come up with a wide receiver ranking system.

I won’t bore you with all the details yet, but I think grading wide receivers (or for that matter, receiving tight ends) is much, much more complicated than people realize. I hope you guys are excited to participate the discussion, as I am in the early stages of this project and will go where the research takes me. One possible result I envision: the ultimate wide receiver ranking system does not exist, but a series of four or five ranking systems might give us the complete picture of a wide receiver.

Let me start with a question: which team had a better passing offense last year, Houston or Detroit? For now, try to ignore what we saw out of Matt Schaub in the post-season and just focus on the regular season results.
[continue reading…]

{ 34 comments }