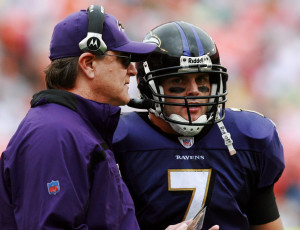
The 2004 Ravens were hardly Brian Billick’s most interesting team. But those Ravens serve as a shining example of what you envision when you think of Baltimore in the 2000s: terrible on offense and great on defense. The team went 9-7 despite the Kyle Boller-led offense producing just 24 touchdowns, tied for the second fewest in the league. But Ray Lewis, Ed Reed, Terrell Suggs, Chris McAlister, and even Deion Sanders were on a defense that allowed only 23 touchdowns, the second best mark in the NFL. So Baltimore was +1 in net offensive touchdowns, but that doesn’t really demonstrate the type of team the Ravens were.
Here’s a better way: the average team in 2004 produced 35.9 offensive touchdowns. This means the Baltimore offense fell 11.9 touchdowns shy of average, while the defense was 12.9 touchdowns above average. So if you don’t like watching offensive touchdowns, the 2004 Ravens were the team for you: 24.8 fewer offensive scores came in Ravens games than in the average game that season.
That’s the 4th largest negative differential in NFL history, behind…
- The 2002 Bucs (-25.1), who allowed 18.1 fewer touchdowns than average while scoring 7.1 fewer offensive touchdowns;
- The 2005 Bears (-26.2), who allowed 14.6 fewer offensive touchdowns to opponents, and produced 11.6 fewer offensive touchdowns than average; and
- The 1967 Oilers (-28.7), who allowed 17.3 fewer offensive touchdowns than average and scored 11.3 fewer offensive touchdowns than the rest of the AFL.
So why the focus on Brian Billick? Because 2004 wasn’t that much of an outlier year for him. Billick got the head coaching job in Baltimore after his work with the Minnesota offense in 1998 that scored 23 more touchdowns than average. But with the Ravens, a lack of offensive touchdowns — for both teams in Ravens games — defined his tenure. Take a look:
All told, Brian Billick’s Ravens offenses scored 53.5 fewer touchdowns than league average, while his defenses allowed 74.5 fewer touchdowns than average. Add those numbers together, and Billick’s Ravens produced 128 fewer touchdowns than league average during his tenure. That’s, by a decent margin, the most of any coach in NFL history. Hence, the name Billick Index.
The table below shows the top 75 coaches since 1932 [1]As always, coaches from prior to 1932 are included, but only their seasons beginning in 1932 are included. in the Billick Index. Here’s how to read the line for Bill Cowher, who checks in at #2: He began coaching in 1992 and last coached in 2006, for a total of 240 games. His offenses, over those 15 years, scored a total of 5.6 more touchdowns than average, while his defenses allowed 105.4 fewer touchdowns than average. That means Cowher’s games produced 99.9 fewer touchdowns than average, or 6.7 fewer offensive touchdowns per 16 games.
This was almost called the Lovie Index: I originally ran this study by looking just at offensive ANY/A, and Lovie Smith dominated that formula. [2]Unfortunately, I couldn’t quite get comfortable with the methodology, so the project was scrapped. Still, Smith comes up pretty high on this list, and his career — and his record and single Super Bowl appearance — is remarkably similar to Billick’s.
Billick’s “success” in this formula has been carried on by his predecessor, John Harbaugh. In fact, Baltimore finished 1st in this metric in 2013 (-11.9 offense, +5.9 defense). Speaking of the brothers Harbaugh, Jim Harbaugh has produced a nearly identical per-season average. Both deserve their low-octane reputations.
I thought Rex Ryan would finish higher in this [3]As for his father? To my surprise, Buddy Ryan comes out as perfectly average in this formula, as his defenses simply were not great at preventing touchdowns when he was a head coach., but he winds up as “only” 28th on this list. Part of the reason: the Jets have only allowed 6.8 fewer touchdowns than average over the last four years combined. But here’s the more interesting Rex stat: in his five seasons and 80 games, the Jets have scored 158 offensive touchdowns and allowed 158 offensive touchdowns. That ranked tied for 4th over that time period in defense, and 10th from the bottom on offense.
Perhaps an even bigger surprise to me is Jeff Fisher’s low ranking. He doesn’t even show up in the top 75, checking in at number 87 on the list. Part of the reason is that he had some pretty bad defenses with the Titans: the ’01, ’04, ’05, ’06, and ’09 teams all allowed at least ten more touchdowns than average. His 2000 team does fare pretty well in the Billick Index: those Titans finished 1.7 touchdowns below average on offense, and 16.7 touchdowns better than average on defense.
And let me be the first to say that the Swamp Fox comes in at #11. Tomorrow, we’ll take a look at the reverse: the coaches whose teams most exceeded the average number of offensive touchdowns scored in their games.
References
| ↑1 | As always, coaches from prior to 1932 are included, but only their seasons beginning in 1932 are included. |
|---|---|
| ↑2 | Unfortunately, I couldn’t quite get comfortable with the methodology, so the project was scrapped. |
| ↑3 | As for his father? To my surprise, Buddy Ryan comes out as perfectly average in this formula, as his defenses simply were not great at preventing touchdowns when he was a head coach. |

