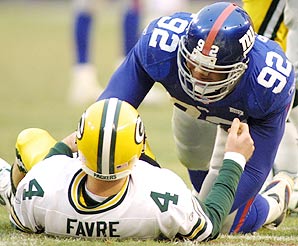
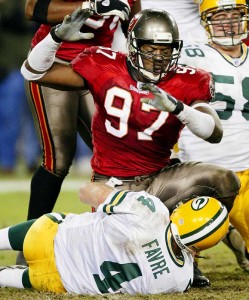
Thirty years ago, the NFL began officially recording defensive player sacks. Prior to 1982, all teams kept their own individual sack data, but those records (with few exceptions) have never been verified. As a result, it’s an unfortunate reality that for much of NFL history, we simply do not have reliable sack data for individual defensive players.
Three times, Deacon Jones produced 20+ unofficial sacks in the 1960s. [1]According to research done by John Turney. In 1967, Raiders defensive end Ben Davidson Ike Lassiter had 17 sacks [2]Source. in the AFL. Jack Youngblood and Jim Katcavage both led the league in sacks on two different occasions in the pre-1982 era. [3]Source: Turney/Webster Cincinnati Bengal Coy Bacon has been credited with 21.5 unofficial sacks during in 1976. The first team to record 60 sacks in a season was the ’57 Bears, and we can be sure that Doug Atkins recorded more than his fair share of that number. For players like Gino Marchetti, Norm Willey, and Len Ford, even unofficial records weren’t kept during their time, leaving us unsure as to who is the true sack king.
It’s important to remember that just because we don’t have official sack data before 1982 doesn’t mean there were great sack artists before then. But that’s a topic for another today. So while we can’t precisely measure how the forefathers of the game played, we do have official data for the last 30 years. So who has been the best pass rusher of the last three decades?
Using total sacks isn’t a fair method to current players, or to those players who chose to retire instead of sticking around to compile six-sack seasons. So if we want to measure sack dominance, we can’t simply look at total sacks any more than we can grade running backs by looking at career rushing yards. One method I like that I’ve used before is sacks over one-half sack per game. This makes 8 sacks in a 16-game season the bar; a player only gets credit for their production over that level. This means that 12 sacks in a 16-game season brings a value of +4.00, while 16 sacks is twice as valuable at +8.00.There’s no great reason to choose 8 over 6 or 10 or any other number. I chose 8 because it feels right, but I don’t claim that it’s based on anything other than my personal, subjective preference.
In addition, there are two adjustments that I think help level the playing field. The first is an era adjustment, not unlike what you see when discussing wide receivers — except this one goes the other way. In 1984, the league sack rate was at 9.2%, but in 2009, it was just 6.5%. In other words, it was significantly easier for defenders to record sacks — on a per pass attempt basis — in 1984 than it was 25 years later. The other is to take into account the number of pass attempts each team faced. In 1984, Rulon Jones recorded 11 sacks for the Broncos, but Denver faced an incredible 688 pass attempts that season. Compare that to Jason Taylor, who had 11 sacks in 2007 for the Dolphins. That season, Miami faced just 439 pass attempts. I don’t think it’s controversial to say that Taylor’s sack total was much more impressive. As a result, I’ve adjusted each player’s “sacks over 0.5 sacks/game” metric for era and based on the number of attempts his team faced.
Here are the single-season leaders for each of the last 30 years. In addition to listing the player’s sack totals, I’ve listed the number of pass attempts their teams faced per game, the league sack rate that season, the number of sacks over 0.5 games played, and then an adjusted score, which is how the table is sorted.
Year | Team | Player | G | SK | PA/G | LgSkRt | SkOv0.5 | ADJ Score |
---|---|---|---|---|---|---|---|---|
2001 | NYG | Michael Strahan | 16 | 22.5 | 35.4 | 7.4 | 14.5 | 14.41 |
2011 | MIN | Jared Allen | 16 | 22 | 36.8 | 6.8 | 14 | 14.27 |
1987 | PHI | Reggie White | 12 | 21 | 41.2 | 8.2 | 15 | 13.17 |
2008 | DAL | DeMarcus Ware | 16 | 20 | 35.4 | 6.3 | 12 | 13.11 |
1989 | MIN | Chris Doleman | 16 | 21 | 34.9 | 7.7 | 13 | 12.7 |
1984 | NYJ | Mark Gastineau | 16 | 22 | 34.7 | 9.2 | 14 | 12.14 |
1989 | GNB | Tim Harris | 16 | 19.5 | 31.9 | 7.7 | 11.5 | 11.91 |
1990 | KAN | Derrick Thomas | 15 | 20 | 35.8 | 7.9 | 12.5 | 11.81 |
2011 | DAL | DeMarcus Ware | 16 | 19.5 | 36.7 | 6.8 | 11.5 | 11.79 |
1990 | BUF | Bruce Smith | 16 | 19 | 31.1 | 7.9 | 11 | 11.41 |
2003 | NYG | Michael Strahan | 16 | 18.5 | 35.3 | 6.6 | 10.5 | 11.3 |
2002 | MIA | Jason Taylor | 16 | 18.5 | 35.4 | 6.8 | 10.5 | 11.06 |
2006 | SDG | Shawne Merriman | 12 | 17 | 37.4 | 7.1 | 11 | 10.85 |
2011 | PHI | Jason Babin | 16 | 18 | 35.5 | 6.8 | 10 | 10.54 |
1983 | NYJ | Mark Gastineau | 16 | 19 | 31.9 | 8.6 | 11 | 10.53 |
2008 | MIA | Joey Porter | 16 | 17.5 | 36.9 | 6.3 | 9.5 | 10.32 |
1986 | NYG | Lawrence Taylor | 16 | 20.5 | 40.4 | 8.3 | 12.5 | 10.14 |
2009 | DEN | Elvis Dumervil | 16 | 17 | 34.3 | 6.5 | 9 | 10.11 |
1995 | BUF | Bryce Paup | 15 | 17.5 | 39.4 | 6.4 | 10 | 10.2 |
2007 | KAN | Jared Allen | 14 | 15.5 | 31.2 | 6.5 | 8.5 | 10.02 |
1989 | MIN | Keith Millard | 16 | 18 | 34.9 | 7.7 | 10 | 9.7 |
1992 | PHI | Clyde Simmons | 16 | 19 | 35.8 | 8.5 | 11 | 9.6 |
1991 | NOR | Pat Swilling | 16 | 17 | 33.8 | 7.1 | 9 | 9.59 |
2008 | ATL | John Abraham | 16 | 16.5 | 36.4 | 6.3 | 8.5 | 9.42 |
2008 | PIT | James Harrison | 15 | 16 | 36.5 | 6.3 | 8.5 | 9.34 |
1988 | PHI | Reggie White | 16 | 18 | 38.8 | 7.3 | 10 | 9.25 |
1986 | WAS | Dexter Manley | 16 | 18.5 | 36.7 | 8.3 | 10.5 | 9.09 |
1988 | NYG | Lawrence Taylor | 12 | 15.5 | 38.6 | 7.3 | 9.5 | 8.97 |
1999 | ARI | Simeon Rice | 16 | 16.5 | 32.9 | 7.5 | 8.5 | 8.88 |
2000 | NOR | La'Roi Glover | 16 | 17 | 34.6 | 7.5 | 9 | 8.98 |
2005 | OAK | Derrick Burgess | 16 | 16 | 32.6 | 7.2 | 8 | 8.75 |
1992 | SDG | Leslie O'Neal | 15 | 17 | 33.9 | 8.5 | 9.5 | 8.66 |
1986 | PHI | Reggie White | 16 | 18 | 36.6 | 8.3 | 10 | 8.62 |
1984 | CHI | Richard Dent | 16 | 17.5 | 31.7 | 9.2 | 9.5 | 8.49 |
2003 | TAM | Simeon Rice | 16 | 15 | 31.9 | 6.6 | 7 | 8.5 |
1984 | NWE | Andre Tippett | 16 | 18.5 | 35.5 | 9.2 | 10.5 | 8.41 |
2002 | TAM | Simeon Rice | 16 | 15.5 | 34.6 | 6.8 | 7.5 | 8.23 |
2010 | DAL | DeMarcus Ware | 16 | 15.5 | 35.9 | 6.5 | 7.5 | 8.29 |
2011 | NYG | Jason Pierre-Paul | 16 | 16.5 | 39.8 | 6.8 | 8.5 | 8.14 |
2000 | MIA | Trace Armstrong | 16 | 16.5 | 36.1 | 7.5 | 8.5 | 8.14 |
1991 | PHI | Reggie White | 16 | 15 | 32.6 | 7.1 | 7 | 7.85 |
2006 | GNB | Aaron Kampman | 16 | 15.5 | 35.1 | 7.1 | 7.5 | 7.8 |
1983 | SFO | Fred Dean | 16 | 17.5 | 36.4 | 8.6 | 9.5 | 7.83 |
2001 | STL | Leonard Little | 13 | 14.5 | 36.6 | 7.4 | 8 | 7.7 |
2003 | MIA | Adewale Ogunleye | 16 | 15 | 35.8 | 6.6 | 7 | 7.7 |
1988 | RAM | Kevin Greene | 16 | 16.5 | 39.2 | 7.3 | 8.5 | 7.66 |
1999 | STL | Kevin Carter | 16 | 17 | 40.8 | 7.5 | 9 | 7.55 |
1992 | DEN | Simon Fletcher | 16 | 16 | 32 | 8.5 | 8 | 7.6 |
2008 | MIN | Jared Allen | 16 | 14.5 | 35.9 | 6.3 | 6.5 | 7.51 |
2004 | IND | Dwight Freeney | 16 | 16 | 37.6 | 7.3 | 8 | 7.52 |
Lawrence Taylor in ’86 and Elvis Dumervil in 2009 provide good examples of how this system works. On the surface, Taylor’s 20.5 sacks looks well, 3.5 sacks better than Dumervil’s 17 quarterback takedowns. But we need to consider that from ’82 to ’11, the average sack rate was 7.43% and the average defense faced 34.84 pass attempts per game. Taylor in ’86 was fortunate enough to face 16% more pass attempts than the average player and he played in an era that was 11% more sack-friendly than the average player. Combined, that put him in an environment that was 29% more favorable for achieving sacks than the average player. Therefore, instead of calculating sacks over 0.50 games played for Taylor in ’86, we calculate his sacks over 0.65 games played, which represents a 29% increase in the size of the denominator. His 20.5 sacks therefore translates to 10.1 sacks over 0.65 games played.
Dumverill, however, played in an era where sack rates were just 87% of what they have been, on average, over the last three decades. Considering he also faced slightly fewer pass attempts per game, too, he will get credit for sacks over 0.43 games played. His 17 sacks means he also gets credited with a score of 10.1, because he gained 10.1 sacks over 0.43 games played.
We can also create career lists based on how each player performed in each season since 1982. I’ve eliminated all seasons where a player fell below the baseline, i.e., a season of fewer than 0.5 (adjusted) sacks per game played. But if we total all other seasons, we can get their career total of sacks over X games played.
Rank | Player | Year | Sk | Gms | Grade |
---|---|---|---|---|---|
1 | Reggie White | 1985--2000 | 198 | 232 | 74.9 |
2 | Bruce Smith | 1985--2003 | 200 | 279 | 67.6 |
3 | Kevin Greene | 1986--1999 | 160 | 213 | 56.3 |
4 | Simeon Rice | 1996--2007 | 122 | 168 | 49.4 |
5 | Jared Allen | 2004--2011 | 105 | 125 | 47.5 |
6 | DeMarcus Ware | 2005--2011 | 99.5 | 112 | 47.3 |
7 | Michael Strahan | 1993--2007 | 141.5 | 216 | 46.2 |
8 | Derrick Thomas | 1989--1999 | 126.5 | 169 | 45.1 |
9 | Chris Doleman | 1985--1999 | 150.5 | 232 | 44.9 |
10 | Jason Taylor | 1997--2011 | 139.5 | 233 | 43.4 |
11 | Lawrence Taylor | 1982--1993 | 132.5 | 168 | 42.5 |
12 | Leslie O'Neal | 1986--1999 | 132.5 | 196 | 41 |
13 | Richard Dent | 1983--1997 | 137.5 | 200 | 40.9 |
14 | John Abraham | 2000--2011 | 112 | 159 | 40.6 |
15 | Dwight Freeney | 2002--2011 | 102.5 | 149 | 38.4 |
16 | John Randle | 1990--2003 | 137.5 | 219 | 34.4 |
17 | Leonard Little | 1998--2009 | 87.5 | 141 | 31.8 |
18 | Julius Peppers | 2002--2011 | 100 | 154 | 31.5 |
19 | Mark Gastineau | 1982--1988 | 74 | 89 | 31 |
20 | Pat Swilling | 1986--1998 | 107.5 | 185 | 29.8 |
21 | Dexter Manley | 1982--1991 | 97.5 | 123 | 27.7 |
22 | Simon Fletcher | 1985--1995 | 97.5 | 172 | 27.6 |
23 | Andre Tippett | 1983--1993 | 100 | 142 | 27.3 |
24 | Robert Mathis | 2003--2011 | 83.5 | 135 | 27.3 |
25 | Clyde Simmons | 1986--2000 | 121.5 | 236 | 27.2 |
26 | Tim Harris | 1986--1995 | 81 | 118 | 26.6 |
27 | Hugh Douglas | 1995--2004 | 80 | 138 | 25.8 |
28 | Neil Smith | 1988--1999 | 104.5 | 181 | 25.7 |
29 | William Fuller | 1986--1998 | 100.5 | 194 | 25.5 |
30 | Jacob Green | 1982--1991 | 97.5 | 148 | 25 |
31 | Charles Haley | 1986--1999 | 100.5 | 169 | 25 |
32 | Rickey Jackson | 1982--1995 | 128 | 211 | 24.2 |
33 | Greg Townsend | 1983--1994 | 109.5 | 186 | 23.2 |
34 | Sean Jones | 1984--1996 | 113 | 201 | 22.1 |
35 | Elvis Dumervil | 2006--2011 | 52.5 | 75 | 21.5 |
36 | Trace Armstrong | 1989--2003 | 106 | 211 | 21.5 |
37 | Kabeer Gbaja-Biamila | 2000--2008 | 74.5 | 124 | 21.4 |
38 | Patrick Kerney | 1999--2009 | 82.5 | 159 | 21.2 |
39 | Robert Porcher | 1992--2003 | 95.5 | 187 | 21.1 |
40 | Osi Umenyiora | 2003--2011 | 69 | 113 | 20.8 |
41 | Aaron Schobel | 2001--2009 | 78 | 133 | 20.7 |
42 | Wayne Martin | 1989--1999 | 82.5 | 171 | 20.6 |
43 | Warren Sapp | 1995--2007 | 96.5 | 198 | 20.5 |
44 | Joey Porter | 1999--2011 | 98 | 188 | 20.4 |
45 | Trent Cole | 2005--2011 | 68 | 108 | 20 |
46 | Terrell Suggs | 2003--2011 | 82.5 | 141 | 20 |
47 | Mario Williams | 2006--2011 | 53 | 82 | 19.8 |
48 | James Harrison | 2004--2011 | 58 | 106 | 19.6 |
49 | Lee Williams | 1984--1993 | 82.5 | 140 | 19.5 |
50 | Michael Sinclair | 1992--2001 | 73.5 | 144 | 19.5 |
It’s not too surprising to see Reggie White and Bruce Smith on top of the list. They’re the best two defensive ends of the official sack era, and also rank 1-2 in total sacks. Kevin Greene was a star 3-4 outside linebacker in Los Angeles, Pittsburgh, Carolina and San Francisco; how many people know that he’s third on the official sack list? Greene wasn’t really a “compiler” either, although he did seem to play forever. He finished his career with double digit sacks in each of his last four seasons, and recorded 12 sacks for the Panthers in 1999 at the age of 37; in fact, he’s responsible for two of the five seasons of 12+ sacks by a player over the age of 35. Greene had a reputation for being extremely one dimensional, but few excelled at one dimension for as long as he did.
The next names have a more modern flair, and I’ll be honest, caused some head scratching on my part. Rice is an interesting guy: he was basically done after his tenth season, recording only three more sacks after turning 32. And he spent the first five seasons on miserable Cardinals teams, that had two borderline Hall of Famers on defense and little else on the roster. But Rice had a dominant prime: three times from ’99 to ’04 he ranked 2nd in the league in sacks. From ’98 to ’05, he was the only player to record 100 sacks. But what’s interesting about Rice’s production is that among elite pass rushers, no player faced fewer pass attempts.
From ’01 to ’06, the Bucs ranked in the bottom 8 in pass attempts faced each season. During his Cardinals days, Arizona ranked in the bottom five in pass attempts faced three different times. Rice doesn’t have extremely impressive career totals, but he’s one of just 8 players to record double digit sacks in 8 seasons since ’82. Considering the low number of pass attempts he faced, that production was enough to vault him into the fourth spot on the list. In that
Jared Allen and DeMarcus Ware slot behind Rice, and both just completed dominant seasons in 2011. I wrote a lot about Ware yesterday; as for Allen, he’s become the best pass rushing defensive end of this era. Both are at a “sack per game” pace over the last five years, and no one else is particularly close. Because of the lower sack rates in today’s NFL, Ware and Allen have vaulted ahead of some players who produced more sacks in more sack friendly environments. I guess that makes him the pass rushing version of a Paul Warfield, a wide receiver who played on run-oriented teams during a run-heavy era.
Comparing Derrick Thomas and Lawrence Taylor is interesting. Remember, the above table ignores the 9.5 unofficial sacks Taylor had his rookie season. Leaving out Taylor’s rookie year, the two played in a nearly identical number of games, and Taylor holds a slight edge in sacks. But Taylor faced more pass attempts and played the prime of his career during a more sack-friendly era; as a result, Thomas vaults him on the list.
I’ll close today with one more table, showing the top 50 pass rushers from the above table. The below focuses just on the adjustments you might want to make for each player. For example, let’s look at the second row of the final table. Mario Williams has a rank of 47, which is where he ranked on the top 50 pass rushers list above. He had 53 sacks from 2006 to 2011, and has a career total of 15.5 sacks over 0.5 games played (this is calculated per season). He has a weighted average in the “Attempts” column of 1.00, which means that he’s faced a perfectly average number of pass attempts (Simeon Rice is at 0.94, which means he’s faced only 94% as many pass attempts as the average pass rusher). Williams has a 0.87 in the ERA column, which means that in his era, sacks were only 87% as common as they were over the average of the last 30 years. The final column is the combined adjustment, which simply multiplies the “Attempts” and “Era” adjustments together. On the bottom of the list, you see players who dominated in the mid-1980s, when sack rates were north of eight percent. This table is a handy guide to understanding which players were helped and hurt most by factors largely out of their control.
Rank | Master | Year | SKs | SkOv0.5 | ATT | ERA | COMB |
---|---|---|---|---|---|---|---|
35 | Elvis Dumervil | 2006--2011 | 52.5 | 18 | 0.97 | 0.89 | 0.86 |
47 | Mario Williams | 2006--2011 | 53 | 15.5 | 1 | 0.87 | 0.87 |
24 | Robert Mathis | 2003--2011 | 83.5 | 20.5 | 0.99 | 0.91 | 0.9 |
4 | Simeon Rice | 1996--2007 | 122 | 43 | 0.94 | 0.96 | 0.9 |
5 | Jared Allen | 2004--2011 | 105 | 43 | 1.01 | 0.89 | 0.91 |
41 | Aaron Schobel | 2001--2009 | 78 | 16 | 0.98 | 0.93 | 0.91 |
14 | John Abraham | 2000--2011 | 112 | 35 | 1 | 0.91 | 0.92 |
48 | James Harrison | 2004--2011 | 58 | 17 | 1.06 | 0.87 | 0.92 |
17 | Leonard Little | 1998--2009 | 87.5 | 26 | 0.97 | 0.95 | 0.92 |
15 | Dwight Freeney | 2002--2011 | 102.5 | 31.5 | 1 | 0.92 | 0.92 |
6 | DeMarcus Ware | 2005--2011 | 99.5 | 43.5 | 1.05 | 0.88 | 0.92 |
45 | Trent Cole | 2005--2011 | 68 | 16.5 | 1.05 | 0.88 | 0.93 |
29 | William Fuller | 1986--1998 | 100.5 | 22.5 | 1.01 | 0.93 | 0.93 |
10 | Jason Taylor | 1997--2011 | 139.5 | 37.5 | 0.99 | 0.94 | 0.94 |
44 | Joey Porter | 1999--2011 | 98 | 19 | 1.04 | 0.9 | 0.94 |
18 | Julius Peppers | 2002--2011 | 100 | 28.5 | 1.03 | 0.91 | 0.94 |
46 | Terrell Suggs | 2003--2011 | 82.5 | 17 | 1.04 | 0.92 | 0.96 |
38 | Patrick Kerney | 1999--2009 | 82.5 | 19.5 | 1.04 | 0.93 | 0.96 |
27 | Hugh Douglas | 1995--2004 | 80 | 24 | 1 | 0.98 | 0.97 |
28 | Neil Smith | 1988--1999 | 104.5 | 25 | 1 | 0.99 | 0.99 |
40 | Osi Umenyiora | 2003--2011 | 69 | 20 | 1.09 | 0.92 | 1 |
8 | Derrick Thomas | 1989--1999 | 126.5 | 43 | 0.97 | 1.03 | 1 |
37 | Kabeer Gbaja-Biamila | 2000--2008 | 74.5 | 19.5 | 1.06 | 0.95 | 1.01 |
22 | Simon Fletcher | 1985--1995 | 97.5 | 27 | 0.97 | 1.04 | 1.01 |
36 | Trace Armstrong | 1989--2003 | 106 | 20.5 | 1.01 | 1 | 1.02 |
42 | Wayne Martin | 1989--1999 | 82.5 | 20 | 1.02 | 1 | 1.02 |
33 | Greg Townsend | 1983--1994 | 109.5 | 26 | 0.97 | 1.06 | 1.03 |
2 | Bruce Smith | 1985--2003 | 200 | 69 | 1 | 1.03 | 1.03 |
26 | Tim Harris | 1986--1995 | 81 | 27 | 0.96 | 1.06 | 1.03 |
7 | Michael Strahan | 1993--2007 | 141.5 | 47 | 1.05 | 0.98 | 1.03 |
12 | Leslie O'Neal | 1986--1999 | 132.5 | 42 | 1.01 | 1.03 | 1.04 |
39 | Robert Porcher | 1992--2003 | 95.5 | 21 | 1.02 | 1.02 | 1.04 |
31 | Charles Haley | 1986--1999 | 100.5 | 27 | 1.05 | 0.99 | 1.04 |
16 | John Randle | 1990--2003 | 137.5 | 37.5 | 1.06 | 0.99 | 1.04 |
20 | Pat Swilling | 1986--1998 | 107.5 | 32.5 | 1.03 | 1.01 | 1.04 |
3 | Kevin Greene | 1986--1999 | 160 | 59.5 | 1.05 | 1 | 1.05 |
25 | Clyde Simmons | 1986--2000 | 121.5 | 27 | 1 | 1.05 | 1.05 |
34 | Sean Jones | 1984--1996 | 113 | 24.5 | 1.03 | 1.03 | 1.06 |
9 | Chris Doleman | 1985--1999 | 150.5 | 48 | 1.02 | 1.05 | 1.07 |
49 | Lee Williams | 1984--1993 | 82.5 | 22 | 0.99 | 1.08 | 1.08 |
43 | Warren Sapp | 1995--2007 | 96.5 | 20 | 1.07 | 1.01 | 1.08 |
32 | Rickey Jackson | 1982--1995 | 128 | 30 | 0.99 | 1.1 | 1.09 |
50 | Michael Sinclair | 1992--2001 | 73.5 | 21 | 1.07 | 1.01 | 1.09 |
13 | Richard Dent | 1983--1997 | 137.5 | 47 | 1.01 | 1.11 | 1.12 |
1 | Reggie White | 1985--2000 | 198 | 84.5 | 1.07 | 1.06 | 1.13 |
19 | Mark Gastineau | 1982--1988 | 74 | 35.5 | 0.97 | 1.18 | 1.14 |
30 | Jacob Green | 1982--1991 | 97.5 | 31.5 | 1 | 1.15 | 1.15 |
11 | Lawrence Taylor | 1982--1993 | 132.5 | 50.5 | 1.06 | 1.1 | 1.16 |
23 | Andre Tippett | 1983--1993 | 100 | 32 | 1.02 | 1.17 | 1.19 |
21 | Dexter Manley | 1982--1991 | 97.5 | 36.5 | 1.04 | 1.15 | 1.2 |
References
↑1 | According to research done by John Turney. |
---|---|
↑2 | Source. |
↑3 | Source: Turney/Webster |