Using the same formula, we can grade each quarterback in each game and adjust for era [1]Note that I do not have individual playoff sack data prior to 2008, so I am using pro-rated sack numbers based on team sack data.. However, it should be obvious that the sample sizes here are incredibly small, and the stats are even less likely to tell the true story when looking at just one game. Strength of schedule becomes a significant factor here, as well. But, caveats aside, there’s a lot we can do with playoff data. For example, we can rank every quarterback performance in Super Bowl history:
Rk | QB | Tm | Opp | SB | W/L | Att | Pyd | TD | INT | CY | CYP | VAL |
---|---|---|---|---|---|---|---|---|---|---|---|---|
1 | Joe Montana | SFO | MIA | 19 | W | 35 | 331 | 3 | 0 | 406 | 11 | 272 |
2 | Steve Young | SFO | SDG | 29 | W | 36 | 325 | 6 | 0 | 431 | 11.1 | 264 |
3 | Troy Aikman | DAL | BUF | 27 | W | 30 | 273 | 4 | 0 | 381 | 12.3 | 258 |
4 | Joe Montana | SFO | DEN | 24 | W | 29 | 297 | 5 | 0 | 397 | 13.3 | 256 |
5 | Kurt Warner | STL | TEN | 34 | W | 45 | 414 | 2 | 0 | 447 | 9.7 | 225 |
6 | Jim Plunkett | OAK | PHI | 15 | W | 21 | 261 | 3 | 0 | 320 | 14.5 | 219 |
7 | Phil Simms | NYG | DEN | 21 | W | 25 | 268 | 3 | 0 | 323 | 12.4 | 216 |
8 | Doug Williams | WAS | DEN | 22 | W | 29 | 340 | 4 | 1 | 358 | 11.6 | 211 |
9 | John Elway | DEN | ATL | 33 | W | 29 | 336 | 1 | 1 | 331 | 11 | 181 |
10 | Jim McMahon | CHI | NWE | 20 | W | 20 | 256 | 0 | 0 | 284 | 11.6 | 174 |
11 | Joe Montana | SFO | CIN | 23 | W | 36 | 357 | 2 | 0 | 351 | 9 | 165 |
12 | Jake Delhomme | CAR | NWE | 38 | L | 33 | 323 | 3 | 0 | 325 | 8.8 | 146 |
13 | Tom Brady | NWE | CAR | 38 | W | 48 | 354 | 3 | 1 | 369 | 7.7 | 141 |
14 | Terry Bradshaw | PIT | DAL | 13 | W | 30 | 318 | 4 | 1 | 266 | 7.8 | 140 |
15 | Mark Rypien | WAS | BUF | 26 | W | 33 | 292 | 2 | 1 | 287 | 8.7 | 128 |
16 | Terry Bradshaw | PIT | RAM | 14 | W | 21 | 309 | 2 | 3 | 214 | 10.2 | 123 |
17 | Bart Starr | GNB | KAN | 1 | W | 23 | 250 | 2 | 1 | 224 | 8.7 | 121 |
18 | Terry Bradshaw | PIT | DAL | 10 | W | 19 | 209 | 2 | 0 | 200 | 9.5 | 121 |
19 | Aaron Rodgers | GNB | PIT | 45 | W | 39 | 304 | 3 | 0 | 348 | 8.3 | 118 |
20 | Brett Favre | GNB | NWE | 31 | W | 27 | 246 | 2 | 0 | 268 | 8.1 | 111 |
21 | Drew Brees | NOR | IND | 44 | W | 39 | 288 | 2 | 0 | 321 | 8 | 107 |
22 | Ken Stabler | OAK | MIN | 11 | W | 19 | 180 | 1 | 0 | 183 | 8.7 | 103 |
23 | Troy Aikman | DAL | PIT | 30 | W | 23 | 209 | 1 | 0 | 218 | 8.7 | 91 |
24 | Kurt Warner | ARI | PIT | 43 | L | 43 | 377 | 3 | 1 | 329 | 7.3 | 87 |
25 | John Elway | DEN | NYG | 21 | L | 37 | 304 | 1 | 1 | 270 | 6.5 | 81 |
26 | Bart Starr | GNB | OAK | 2 | W | 24 | 202 | 1 | 0 | 182 | 6.5 | 79 |
27 | Joe Montana | SFO | CIN | 16 | W | 22 | 157 | 1 | 0 | 188 | 7.8 | 76 |
28 | Tom Brady | NWE | PHI | 39 | W | 33 | 236 | 2 | 0 | 259 | 7.4 | 75 |
29 | Joe Namath | NYJ | BAL | 3 | W | 28 | 206 | 0 | 0 | 195 | 6.5 | 68 |
30 | Peyton Manning | IND | NOR | 44 | L | 45 | 333 | 1 | 1 | 308 | 6.8 | 67 |
31 | Ken Anderson | CIN | SFO | 16 | L | 34 | 300 | 2 | 2 | 254 | 6.4 | 67 |
32 | Jeff Hostetler | NYG | BUF | 25 | W | 32 | 222 | 1 | 0 | 234 | 6.9 | 66 |
33 | Bob Lee | MIN | OAK | 11 | L | 9 | 81 | 1 | 0 | 100 | 10.9 | 65 |
34 | Roger Staubach | DAL | MIA | 6 | W | 19 | 119 | 2 | 0 | 140 | 6.7 | 63 |
35 | Steve McNair | TEN | STL | 34 | L | 36 | 214 | 0 | 0 | 208 | 5.6 | 61 |
36 | Eli Manning | NYG | NWE | 46 | W | 40 | 296 | 1 | 0 | 302 | 7 | 61 |
37 | Terry Bradshaw | PIT | MIN | 9 | W | 14 | 96 | 1 | 0 | 104 | 6.5 | 59 |
38 | Kurt Warner | STL | NWE | 36 | L | 44 | 365 | 1 | 2 | 287 | 6 | 55 |
39 | Roger Staubach | DAL | PIT | 13 | L | 30 | 228 | 3 | 1 | 161 | 4.6 | 53 |
40 | Jim Kelly | BUF | NYG | 25 | L | 30 | 212 | 0 | 0 | 205 | 6.6 | 52 |
41 | Jim Plunkett | RAI | WAS | 18 | W | 25 | 172 | 1 | 0 | 174 | 6.4 | 48 |
42 | Roger Staubach | DAL | DEN | 12 | W | 25 | 183 | 1 | 0 | 142 | 4.8 | 45 |
43 | Brad Johnson | TAM | OAK | 37 | W | 34 | 215 | 2 | 1 | 210 | 6.2 | 45 |
44 | Earl Morrall | BAL | DAL | 5 | W | 15 | 147 | 0 | 1 | 102 | 6.8 | 43 |
45 | Ben Roethlisberger | PIT | ARI | 43 | W | 30 | 256 | 1 | 1 | 209 | 6.5 | 37 |
46 | Bob Griese | MIA | MIN | 8 | W | 7 | 73 | 0 | 0 | 63 | 7.9 | 34 |
47 | Brett Favre | GNB | DEN | 32 | L | 42 | 256 | 3 | 1 | 240 | 5.6 | 34 |
48 | Daryle Lamonica | OAK | GNB | 2 | L | 34 | 208 | 2 | 1 | 181 | 4.9 | 32 |
49 | Fran Tarkenton | MIN | MIA | 8 | L | 28 | 182 | 0 | 1 | 141 | 4.5 | 31 |
50 | Gary Kubiak | DEN | NYG | 21 | L | 4 | 48 | 0 | 0 | 45 | 10.2 | 25 |
51 | Troy Aikman | DAL | BUF | 28 | W | 27 | 207 | 0 | 1 | 159 | 5.5 | 21 |
52 | Tom Brady | NWE | NYG | 46 | L | 41 | 276 | 2 | 1 | 261 | 6.1 | 20 |
53 | Len Dawson | KAN | GNB | 1 | L | 27 | 211 | 1 | 1 | 135 | 4.2 | 19 |
54 | Trent Dilfer | BAL | NYG | 35 | W | 25 | 153 | 1 | 0 | 154 | 5.5 | 17 |
55 | Tom Brady | NWE | STL | 36 | W | 27 | 145 | 1 | 0 | 154 | 5.3 | 14 |
56 | Len Dawson | KAN | MIN | 4 | W | 17 | 142 | 1 | 1 | 97 | 4.9 | 10 |
57 | Gary Kubiak | DEN | SFO | 24 | L | 3 | 28 | 0 | 0 | 25 | 6.8 | 7 |
58 | Frank Reich | BUF | WAS | 26 | L | 1 | 11 | 0 | 0 | 10 | 9.4 | 5 |
59 | Steve Young | SFO | DEN | 24 | W | 3 | 20 | 0 | 0 | 20 | 6.5 | 5 |
60 | Vince Ferragamo | RAM | PIT | 14 | L | 25 | 212 | 0 | 1 | 127 | 4.4 | 4 |
61 | Danny White | DAL | DEN | 12 | W | 2 | 5 | 0 | 0 | 3 | 1.1 | 4 |
62 | Matt Hasselbeck | SEA | PIT | 40 | L | 49 | 273 | 1 | 1 | 234 | 4.5 | 3 |
63 | Ben Roethlisberger | PIT | GNB | 45 | L | 40 | 263 | 2 | 2 | 211 | 5.1 | 2 |
64 | Bill Musgrave | SFO | SDG | 29 | W | 1 | 6 | 0 | 0 | 6 | 5.2 | 0 |
65 | Fran Tarkenton | MIN | OAK | 11 | L | 35 | 205 | 1 | 2 | 132 | 3.7 | -4 |
66 | Babe Parilli | NYJ | BAL | 3 | W | 1 | 0 | 0 | 0 | 0 | -0.4 | -5 |
67 | Zeke Bratkowski | GNB | KAN | 1 | W | 1 | 0 | 0 | 0 | -1 | -0.8 | -5 |
68 | Jay Schroeder | WAS | DEN | 22 | W | 1 | 0 | 0 | 0 | -1 | -0.6 | -6 |
69 | Pete Beathard | KAN | GNB | 1 | L | 5 | 17 | 0 | 0 | 7 | 1.3 | -6 |
70 | Tony Banks | BAL | NYG | 35 | W | 1 | 0 | 0 | 0 | -1 | -0.7 | -6 |
71 | Eli Manning | NYG | NWE | 42 | W | 34 | 255 | 2 | 1 | 182 | 4.9 | -8 |
72 | Bob Griese | MIA | WAS | 7 | W | 11 | 88 | 1 | 1 | 44 | 3.4 | -8 |
73 | Peyton Manning | IND | CHI | 41 | W | 38 | 247 | 1 | 1 | 184 | 4.7 | -10 |
74 | John Elway | DEN | GNB | 32 | W | 22 | 123 | 0 | 1 | 98 | 4.3 | -12 |
75 | Don Strock | MIA | WAS | 17 | L | 3 | 0 | 0 | 0 | -3 | -0.9 | -17 |
76 | Steve Fuller | CHI | NWE | 20 | W | 4 | 0 | 0 | 0 | -3 | -0.6 | -23 |
77 | Ron Jaworski | PHI | OAK | 15 | L | 38 | 291 | 1 | 3 | 146 | 3.8 | -28 |
78 | Joe Theismann | WAS | MIA | 17 | W | 23 | 143 | 2 | 2 | 74 | 2.8 | -33 |
79 | Dan Marino | MIA | SFO | 19 | L | 50 | 318 | 1 | 2 | 219 | 4.1 | -33 |
80 | Elvis Grbac | SFO | SDG | 29 | W | 1 | 0 | 0 | 0 | -30 | -28.2 | -36 |
81 | Johnny Unitas | BAL | NYJ | 3 | L | 24 | 110 | 0 | 1 | 65 | 2.7 | -37 |
82 | David Woodley | MIA | WAS | 17 | L | 14 | 97 | 1 | 1 | 28 | 1.9 | -37 |
83 | Donovan McNabb | PHI | NWE | 39 | L | 51 | 357 | 3 | 3 | 249 | 4.5 | -40 |
84 | Norris Weese | DEN | DAL | 12 | L | 10 | 22 | 0 | 0 | -18 | -1.6 | -42 |
85 | Gale Gilbert | SDG | SFO | 29 | L | 6 | 30 | 0 | 1 | -17 | -2.7 | -44 |
86 | Gary Cuozzo | MIN | KAN | 4 | L | 3 | 16 | 0 | 1 | -32 | -9.6 | -46 |
87 | Johnny Unitas | BAL | DAL | 5 | W | 9 | 88 | 1 | 2 | -12 | -1.3 | -47 |
88 | Tom Brady | NWE | NYG | 42 | L | 48 | 266 | 1 | 0 | 219 | 4.1 | -53 |
89 | Bob Griese | MIA | DAL | 6 | L | 23 | 134 | 0 | 1 | 30 | 1.3 | -58 |
90 | Boomer Esiason | CIN | SFO | 23 | L | 25 | 144 | 0 | 1 | 78 | 2.6 | -65 |
91 | Jim Kelly | BUF | DAL | 28 | L | 50 | 260 | 0 | 1 | 182 | 3.4 | -66 |
92 | Stan Humphries | SDG | SFO | 29 | L | 49 | 275 | 1 | 2 | 189 | 3.7 | -67 |
93 | Ben Roethlisberger | PIT | SEA | 40 | W | 21 | 123 | 0 | 2 | 45 | 2 | -67 |
94 | Tony Eason | NWE | CHI | 20 | L | 6 | 0 | 0 | 0 | -40 | -5.6 | -72 |
95 | Roger Staubach | DAL | PIT | 10 | L | 24 | 204 | 2 | 3 | 37 | 1.2 | -78 |
96 | Chris Chandler | ATL | DEN | 33 | L | 35 | 219 | 1 | 3 | 91 | 2.5 | -79 |
97 | Joe Kapp | MIN | KAN | 4 | L | 25 | 183 | 0 | 2 | 39 | 1.4 | -81 |
98 | John Elway | DEN | WAS | 22 | L | 38 | 257 | 1 | 3 | 93 | 2.2 | -90 |
99 | Rex Grossman | CHI | IND | 41 | L | 28 | 165 | 1 | 2 | 54 | 1.9 | -90 |
100 | Steve Grogan | NWE | CHI | 20 | L | 30 | 177 | 1 | 2 | 56 | 1.6 | -105 |
101 | Jim Kelly | BUF | DAL | 27 | L | 7 | 82 | 0 | 2 | -72 | -9.3 | -107 |
102 | Joe Theismann | WAS | RAI | 18 | L | 35 | 243 | 0 | 2 | 73 | 1.8 | -112 |
103 | Craig Morton | DAL | BAL | 5 | L | 26 | 127 | 1 | 3 | -2 | -0.1 | -112 |
104 | Fran Tarkenton | MIN | PIT | 9 | L | 26 | 102 | 0 | 3 | -33 | -1.3 | -127 |
105 | Earl Morrall | BAL | NYJ | 3 | L | 17 | 71 | 0 | 3 | -64 | -3.8 | -136 |
106 | Frank Reich | BUF | DAL | 27 | L | 31 | 194 | 1 | 2 | 16 | 0.5 | -137 |
107 | Neil O'Donnell | PIT | DAL | 30 | L | 49 | 239 | 1 | 3 | 122 | 2.3 | -147 |
108 | Billy Kilmer | WAS | MIA | 7 | L | 28 | 104 | 0 | 3 | -48 | -1.6 | -159 |
109 | Drew Bledsoe | NWE | GNB | 31 | L | 48 | 253 | 2 | 4 | 74 | 1.4 | -178 |
110 | John Elway | DEN | SFO | 24 | L | 26 | 108 | 0 | 2 | -22 | -0.7 | -182 |
111 | Rich Gannon | OAK | TAM | 37 | L | 44 | 272 | 2 | 5 | 35 | 0.7 | -212 |
112 | Craig Morton | DEN | DAL | 12 | L | 15 | 39 | 0 | 4 | -157 | -9 | -214 |
113 | Jim Kelly | BUF | WAS | 26 | L | 58 | 275 | 2 | 4 | 30 | 0.5 | -269 |
114 | Kerry Collins | NYG | BAL | 35 | L | 39 | 112 | 0 | 4 | -124 | -2.9 | -335 |
If you type Montana’s name into the search box, you can see that he has the 1st, 4th, 11th and 27th best performance in Super Bowl history. The best performance in a losing effort goes to Jake Delhomme, who shredded the Patriots secondary in the second half of Super Bowl XXXVIII (he began the game 1 for 9 for 1 yard). The worst performance in a winning effort, unsurprisingly, goes to Ben Roethlisberger in Super Bowl XL, although Joe Theismann against the Dolphins gets an honorable mention. Worst performance overall goes to Kerry Collins, although Craig Morton’s 4 interceptions and 39 yards on 15 attempts against his former team in Super Bowl XII could give Collins a run for his money.
What about best championship game performances in the pre-Super Bowl era?
Rk | QB | Tm | Opp | Year | W/L | Att | Pyd | TD | INT | CY | CYP | VAL |
---|---|---|---|---|---|---|---|---|---|---|---|---|
1 | Tobin Rote | DET | CLE | 1957 | W | 19 | 280 | 4 | 0 | 380 | 19 | 304 |
2 | Sid Luckman | CHI | WAS | 1943 | W | 26 | 286 | 5 | 0 | 386 | 14.8 | 248 |
3 | Otto Graham | CLE | RAM | 1950 | W | 33 | 298 | 4 | 1 | 292 | 7.7 | 236 |
4 | Sammy Baugh | WAS | CHI | 1937 | W | 33 | 335 | 3 | 1 | 320 | 9.7 | 228 |
5 | Harry Newman | NYG | CHI | 1933 | L | 19 | 209 | 2 | 1 | 204 | 10.7 | 197 |
6 | Charlie Conerly | NYG | CHI | 1956 | W | 10 | 195 | 2 | 0 | 232 | 22.1 | 192 |
7 | Bart Starr | GNB | NYG | 1961 | W | 17 | 164 | 3 | 0 | 224 | 13.2 | 152 |
8 | Otto Graham | CLE | DET | 1954 | W | 12 | 163 | 3 | 2 | 193 | 12.9 | 135 |
9 | Frank Ryan | CLE | BAL | 1964 | W | 18 | 206 | 3 | 1 | 212 | 11.2 | 132 |
10 | Norm Van Brocklin | RAM | CLE | 1951 | W | 6 | 128 | 1 | 0 | 148 | 24.7 | 129 |
11 | Tobin Rote | SDG | BOS | 1963 | W | 15 | 173 | 2 | 0 | 226 | 13.1 | 127 |
12 | Sid Luckman | CHI | NYG | 1941 | W | 12 | 160 | 0 | 0 | 160 | 13.3 | 125 |
13 | George Blanda | HOU | LAC | 1960 | W | 31 | 301 | 3 | 0 | 361 | 11.6 | 123 |
14 | Charlie Conerly | NYG | BAL | 1958 | W | 14 | 187 | 1 | 0 | 190 | 11.6 | 122 |
15 | Arnie Herber | GNB | NYG | 1938 | L | 14 | 123 | 1 | 0 | 143 | 10.2 | 117 |
16 | Johnny Unitas | BAL | NYG | 1959 | W | 29 | 264 | 2 | 0 | 267 | 7.4 | 115 |
17 | Charlie O'Rourke | CHI | WAS | 1942 | L | 7 | 128 | 0 | 0 | 128 | 18.3 | 105 |
But we can look at more than just individual game performances. After grading each quarterback in each post-season game, we can then come up with a career post-season rating. There’s an argument to be made for placing more weight on the most important games; what I’ve done in the table below is created an unweighted post-season value added grade and a weighted grade, with the conference championship game counting twice as much as an early-round playoff game, and the Super Bowl (or the championship game in the pre-SB era) counting for three times as much. Here are the career post-season ratings for each quarterback with at least 175 career playoff attempts [2]Attempts includes passing attempts, sacks, and rushing touchdowns, sorted by their weighted value. I’ve also listed their number of playoff games, their playoff record (in starts), and their converted yards per play during the playoffs (unweighted):
QB | G | Rec | VALUE | WTVALUE | ATT | CYP |
---|---|---|---|---|---|---|
Joe Montana | 23 | 16-7 | 1810 | 3777 | 780 | 6.9 |
Kurt Warner | 13 | 9-4 | 1219 | 2081 | 482 | 7.6 |
Terry Bradshaw | 19 | 14-5 | 1108 | 1955 | 483 | 5.9 |
Troy Aikman | 16 | 11-4 | 746 | 1877 | 536 | 6.2 |
Bart Starr | 10 | 9-1 | 727 | 1766 | 238 | 7.1 |
Steve Young | 20 | 8-6 | 711 | 1347 | 507 | 5.8 |
Peyton Manning | 19 | 9-10 | 1142 | 1330 | 746 | 6.6 |
Brett Favre | 24 | 13-11 | 795 | 1292 | 828 | 5.9 |
John Elway | 22 | 14-7 | 942 | 1268 | 698 | 5.9 |
Ken Stabler | 13 | 7-5 | 794 | 1155 | 381 | 5.7 |
Drew Brees | 9 | 5-4 | 764 | 1025 | 408 | 7.2 |
Jim Plunkett | 10 | 8-2 | 369 | 1018 | 300 | 5.7 |
Tom Brady | 22 | 16-6 | 531 | 950 | 836 | 5.7 |
Daryle Lamonica | 11 | 4-5 | 643 | 884 | 279 | 6.2 |
Aaron Rodgers | 6 | 4-2 | 517 | 756 | 240 | 7.4 |
Mark Rypien | 8 | 5-2 | 313 | 756 | 242 | 6 |
Otto Graham | 12 | 4-3 | 232 | 686 | 334 | 4.3 |
Ken Anderson | 6 | 2-4 | 368 | 618 | 188 | 6 |
Bernie Kosar | 9 | 3-4 | 412 | 569 | 285 | 6.1 |
Len Dawson | 8 | 5-3 | 249 | 552 | 216 | 5 |
Matt Hasselbeck | 11 | 5-6 | 391 | 496 | 426 | 5.9 |
Dan Marino | 18 | 8-10 | 395 | 494 | 711 | 5.3 |
Roger Staubach | 19 | 11-6 | 303 | 463 | 470 | 4 |
Jake Delhomme | 8 | 5-3 | 178 | 408 | 243 | 5.6 |
Phil Simms | 10 | 6-4 | -99 | 365 | 302 | 4.2 |
Ben Roethlisberger | 14 | 10-4 | 222 | 307 | 447 | 5.6 |
Eli Manning | 11 | 8-3 | 223 | 302 | 381 | 5.9 |
Doug Williams | 7 | 4-3 | -87 | 274 | 176 | 4.1 |
Johnny Unitas | 9 | 6-2 | 175 | 243 | 247 | 4.6 |
Dan Fouts | 7 | 3-4 | 201 | 223 | 299 | 5.2 |
Vinny Testaverde | 5 | 2-3 | 205 | 212 | 196 | 6 |
Bob Griese | 12 | 6-5 | 124 | 181 | 224 | 4.2 |
Joe Theismann | 8 | 6-2 | 391 | 162 | 237 | 6.1 |
Warren Moon | 10 | 3-7 | 141 | 141 | 427 | 5.1 |
Philip Rivers | 7 | 3-4 | 144 | 66 | 245 | 5.8 |
Steve McNair | 10 | 5-5 | -142 | 43 | 331 | 4 |
Randall Cunningham | 10 | 3-6 | 77 | 41 | 395 | 4.8 |
Jeff Garcia | 6 | 2-4 | -37 | -37 | 228 | 4.7 |
Jack Kemp | 6 | 2-4 | -21 | -52 | 179 | 2.9 |
Wade Wilson | 6 | 2-3 | -22 | -75 | 211 | 4.5 |
Billy Kilmer | 7 | 2-5 | 108 | -76 | 184 | 4.3 |
Vince Ferragamo | 7 | 3-3 | -105 | -76 | 201 | 3.9 |
Brad Johnson | 7 | 4-3 | -241 | -84 | 234 | 3.8 |
Jim Harbaugh | 5 | 2-3 | -197 | -109 | 178 | 3.7 |
Danny White | 13 | 5-5 | -119 | -171 | 382 | 4.2 |
Chad Pennington | 6 | 2-4 | -200 | -200 | 233 | 4.3 |
Jake Plummer | 6 | 2-4 | -161 | -239 | 207 | 4.2 |
Dave Krieg | 11 | 3-6 | -53 | -280 | 308 | 4.6 |
Neil O'Donnell | 9 | 3-4 | -53 | -285 | 290 | 4.7 |
Rich Gannon | 9 | 4-3 | 83 | -343 | 257 | 5.1 |
Ron Jaworski | 9 | 4-4 | -56 | -354 | 292 | 4.1 |
Mark Brunell | 11 | 5-5 | -169 | -363 | 325 | 4.2 |
Jim Everett | 5 | 2-3 | -195 | -383 | 183 | 3.7 |
Fran Tarkenton | 11 | 6-5 | -109 | -435 | 314 | 3.3 |
Donovan McNabb | 16 | 9-7 | -148 | -440 | 628 | 4.6 |
Joe Flacco | 9 | 5-4 | -328 | -446 | 269 | 4.2 |
Stan Humphries | 6 | 3-3 | -393 | -487 | 240 | 3.1 |
George Blanda | 8 | 2-2 | -236 | -540 | 197 | 2.5 |
Kerry Collins | 7 | 3-4 | -42 | -571 | 252 | 4.8 |
Jim Kelly | 17 | 9-8 | -14 | -822 | 570 | 4.7 |
Craig Morton | 12 | 5-5 | -446 | -938 | 251 | 2.1 |
Drew Bledsoe | 7 | 3-3 | -634 | -1104 | 269 | 2.5 |
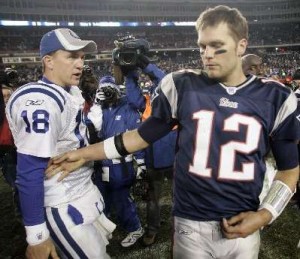
One thing that might jump out at you is seeing Peyton Manning ahead of Tom Brady as a playoff quarterback. But as Brady has become a more dominant regular season quarterback, his playoff success has faded. Whereas at one time in his career Manning had the choker label — and to some, whenever he makes a mistake in the playoffs, he re-earns such label — he’s had a number of dominant playoff performances. Take a look at the career numbers for both Manning and Brady in the post-season:
QB | CMP | ATT | YD | TD | INT | SK | SKYD | Rsh | Ryd | RTD | Fum | Fum Rec | NetFum | CY | CY/P | ANY/A | VALUE |
---|---|---|---|---|---|---|---|---|---|---|---|---|---|---|---|---|---|
Brady | 499 | 793 | 5285 | 38 | 20 | 40 | 258 | 53 | 80 | 3 | 8 | 3 | 5 | 4797 | 5.7 | 5.9 | 531 |
Manning | 453 | 718 | 5389 | 29 | 19 | 25 | 194 | 23 | 27 | 3 | 3 | 1 | 2 | 4920 | 6.6 | 6.6 | 1142 |
It’s still early, but Drew Brees and Aaron Rodgers have been outstanding in the postseason. Kurt Warner was an excellent post-season quarterback, which is what will likely push him over the edge as a Hall of Fame candidate.
What sticks out to you when looking at the postseason data?