That’s a lot. Last year, the Rams shocked the Colts with a 46-9 win, covering by 33.5 points.
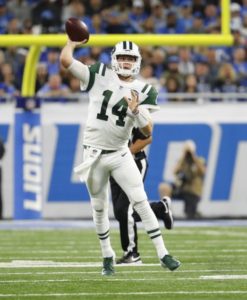
Last night? The Jets began the Sam Darnold experience in the most ugly way possible: the rookie quarterback from USC threw a pick six on his first pass, something Jets fans are all too familiar with.
And then? It was a script for the ages for the Jets. Darnold went 16/20 for 198 yards with 2 TDs and 0 INTs the rest of the way. Free agent acquisition Isaiah Crowell rushed for 102 yards and 2 TDs on just 10 carries. Quincy Enunwa returned from a devastating injury and had 6 catches for 63 yards and a touchdown. 2016 first round pick Darron Lee, who has had an up and down career, recorded two interceptions, including a pick six. 2017 first round pick Jamal Adams picked up his first career interception. Trumaine Johnson, the team’s big acquisition at cornerback in free agency, had an interception; so too did the team’s big acquisition at cornerback in 2017, Morris Claiborne. Oh, and the Jets added a 79-yard punt return from Andre Roberts.
The Jets won 48-17, with the game ending as both team took knees near the Lions goal line. New York was a 7-point underdog, meaning the Jets covered by a whopping 38 points. That’s more than the Ravens this year or the Rams last year; in fact, it’s the fourth largest cover in opening week history!
In 1987, the Bucs, as 2-point home underdogs to Atlanta, beat the Falcons 48-10, covering by 40 points.
In 1998, in a game that is near and dear to Jets fans’ hearts, New York stunned Seattle 41-3 as 6.5-point underdogs (44.5 point cover) in the opening game of the Bill Parcells era.
Finally, in 1989, the Browns shut out the Steelers 51-0 despite being just 2-point favorites.
For New York, it was the 4th-largest cover in franchise history (or, at least, going back to 1978), behind the Seattle game in ’98, this upset over Houston in 1988, and this upset over the 2002 Chargers.
It was a game that was shocking on just about every level. The Jets hadn’t scored a defensive or special teams touchdown since 2013; they did both on Monday night. Since 2000, the Jets had thrown 5 or more interceptions in a game three times, but hadn’t done so to an opposing quarterback since 1999. They did that to a Pro Bowler in Matthew Stafford (4 INTs) and his backup (Matt Cassel) on Monday Night. The Jets draft history has been disappointing in recent years, but then the team’s last three first round picks all had big nights.
Will this last for the Jets? Probably not. But for one night, it was the game Jets fans dream about.
The table below shows the weekly ANY/A for the opening week of the season.
The value column represents the difference between each passer’s ANY/A from the weekly average, multiplied by the number of dropbacks.

