≡ Menu

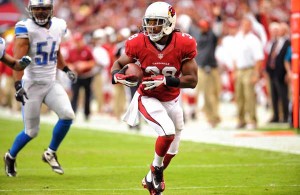
Ellington races for a long touchdown

Ellington races for a long touchdown.

In November, I wrote about the unique running back by committee taking place in Arizona. At the time, Rashard Mendenhall was averaging 3.1 yards per carry, while backup Andre Ellington was averaging 7.2 yards per rush on 54 carries. I thought it would be fun to revisit the Ellington/Mendenhall time share now that the season is over, and to use a slightly different methodology.

Mendenhall ended the season with 687 yards on 217 yards, a 3.2 yards per carry average. Ellington finished his rookie year with 118 carries for 652 yards, producing 5.5 yards per rush. One way to measure the magnitude of the difference in the effectiveness of these two players — and boy was there a large difference — is to simply look at the delta in the players’ yards per carry averages. In this case, that’s 2.36 yards per carry.

Where does that rank historically? Some teams — I’m looking at the Lions in the early Barry Sanders years — gave only a handful of carries to their backup running backs. So one thing we can do is to take the difference in the yards per carry between the team’s top two running backs and multiply that number by the number of carries by the running back with the lower number of carries. In each instance, I’ve defined the running back with the most carries as the team’s RB1, and the running back with the second most carries as the RB2. In Arizona’s case, that would mean multiplying -2.36 (Mendenhall’s average, since he was the RB1, minus Ellington’s average) by 118, the number of carries Ellington recorded. That produces a value of -278.

So what does -278 mean? In the abstract, maybe not much. But I looked at the top two running backs on every team since 1960, and used the same methodology. And only six teams in the last 54 years produced a more extreme value than -278. The most extreme case, by far, came under the watch of the brilliant and affable Todd Haley. In 2010, Thomas Jones rushed 245 times for 896 yards, while Jamaal Charles gained 1,467 yards on just 230 carries. Multiply the -2.72 YPC differential by 230, and you get a value of -626.

Here’s a list of the all timeshares where the second running back outperformed the first and they produced a value of -100 or lower, using the methodology described above:

RkTmYearRB1RB1 Rsh-Yd-YPCRB2RB2 Rsh-Yd-YPCYPC DiffVALUE
1KAN2010Thomas Jones245-896-3.66Jamaal Charles230-1467-6.38-2.72-626
2KAN1990Christian Okoye245-805-3.29Barry Word204-1015-4.98-1.69-345
3SFO1975Larry Schreiber134-337-2.51Delvin Williams117-631-5.39-2.88-337
4PIT1970Preston Pearson173-503-2.91John Fuqua138-691-5.01-2.1-290
5NYG2000Ron Dayne228-770-3.38Tiki Barber213-1006-4.72-1.35-287
6ATL2007Warrick Dunn227-720-3.17Jerious Norwood103-613-5.95-2.78-286
7ARI2013Rashard Mendenhall217-687-3.17Andre Ellington118-652-5.53-2.36-278
8BAL1961Joe Perry168-675-4.02Lenny Moore92-648-7.04-3.03-278
9MIA1973Larry Csonka219-1003-4.58Mercury Morris149-954-6.4-1.82-272
10MIA1981Andra Franklin201-711-3.54Tony Nathan147-782-5.32-1.78-262
11WAS1983John Riggins375-1347-3.59Joe Washington145-772-5.32-1.73-251
12RAI1987Marcus Allen200-754-3.77Bo Jackson81-554-6.84-3.07-249
13IND2013Trent Richardson157-458-2.92Donald Brown102-537-5.26-2.35-239
14CIN1973Boobie Clark254-988-3.89Essex Johnson195-997-5.11-1.22-238
15ATL2006Warrick Dunn286-1140-3.99Jerious Norwood99-633-6.39-2.41-238
16NOR2009Mike Bell172-654-3.8Pierre Thomas147-793-5.39-1.59-234
17DAL1970Calvin Hill153-577-3.77Duane Thomas151-803-5.32-1.55-234
18RAM1961Jon Arnett158-609-3.85Dick Bass98-608-6.2-2.35-230
19NYG2001Ron Dayne180-690-3.83Tiki Barber166-865-5.21-1.38-229
20PIT1999Jerome Bettis299-1091-3.65Richard Huntley93-567-6.1-2.45-228
21NOR1984George Rogers239-914-3.82Hokie Gajan102-615-6.03-2.21-225
22RAI1990Marcus Allen179-682-3.81Bo Jackson125-698-5.58-1.77-222
23NWE1974Mack Herron231-824-3.57Sam Cunningham166-811-4.89-1.32-219
24CIN1969Paul Robinson160-489-3.06Jess Phillips118-578-4.9-1.84-217
25BAL1971Tom Matte173-607-3.51Norm Bulaich152-741-4.88-1.37-208
26CAR2007DeShaun Foster247-876-3.55DeAngelo Williams144-717-4.98-1.43-206
27RAM1967Dick Bass187-627-3.35Les Josephson178-800-4.49-1.14-203
28PIT1960Tom Tracy192-680-3.54John Henry Johnson118-621-5.26-1.72-203
29CLE1985Earnest Byner244-1002-4.11Kevin Mack222-1104-4.97-0.87-192
30SEA2009Julius Jones177-663-3.75Justin Forsett114-619-5.43-1.68-192
31CIN1979Pete Johnson243-865-3.56Archie Griffin140-688-4.91-1.35-190
32DAL1962Don Perkins222-945-4.26Amos Marsh144-802-5.57-1.31-189
33SFO2005Kevan Barlow176-581-3.3Frank Gore127-608-4.79-1.49-189
34PIT1963Dick Hoak216-679-3.14John Henry Johnson186-773-4.16-1.01-188
35DEN2005Mike Anderson239-1014-4.24Tatum Bell173-921-5.32-1.08-187
36NOR1974Jess Phillips174-556-3.2Alvin Maxson165-714-4.33-1.13-187
37BAL1999Errict Rhett236-852-3.61Priest Holmes89-506-5.69-2.08-185
38OAK2011Michael Bush256-977-3.82Darren McFadden113-614-5.43-1.62-183
39DET1975Altie Taylor195-638-3.27Dexter Bussey157-696-4.43-1.16-182
40DET1984James Jones137-532-3.88Billy Sims130-687-5.28-1.4-182
41MIA1983Andra Franklin224-746-3.33Tony Nathan151-685-4.54-1.21-182
42DEN2009Knowshon Moreno247-947-3.83Correll Buckhalter120-642-5.35-1.52-182
43CHI1995Rashaan Salaam296-1074-3.63Robert Green107-570-5.33-1.7-182
44OAK1999Tyrone Wheatley242-936-3.87Napoleon Kaufman138-714-5.17-1.31-180
45PHI1995Ricky Watters337-1273-3.78Charlie Garner108-588-5.44-1.67-180
46DAL2009Marion Barber214-932-4.36Felix Jones116-685-5.91-1.55-180
47ATL2003T.J. Duckett197-779-3.95Warrick Dunn125-672-5.38-1.42-178
48PIT1976Franco Harris289-1128-3.9Rocky Bleier220-1036-4.71-0.81-177
49NYJ1971Emerson Boozer188-618-3.29John Riggins180-769-4.27-0.98-177
50TEN2001Eddie George315-939-2.98Skip Hicks56-341-6.09-3.11-174
51JAX2012Rashad Jennings101-283-2.8Maurice Jones-Drew86-414-4.81-2.01-173
52HOU2011Arian Foster278-1224-4.4Ben Tate175-942-5.38-0.98-171
53NYG2009Brandon Jacobs224-835-3.73Ahmad Bradshaw163-778-4.77-1.05-170
54DEN1966Abner Haynes129-304-2.36Wendell Hayes105-417-3.97-1.61-170
55SDG1967Dickie Post161-663-4.12Brad Hubbert116-643-5.54-1.43-165
56NYG2010Ahmad Bradshaw276-1235-4.47Brandon Jacobs147-823-5.6-1.12-165
57DET1970Altie Taylor198-666-3.36Mel Farr166-717-4.32-0.96-159
58BOS1969Jim Nance193-750-3.89Carl Garrett137-691-5.04-1.16-159
59SFO1977Delvin Williams268-931-3.47Wilbur Jackson179-780-4.36-0.88-158
60GNB1972John Brockington274-1027-3.75MacArthur Lane177-821-4.64-0.89-158
61STL1975Jim Otis269-1076-4Terry Metcalf165-816-4.95-0.95-156
62KAN1965Curtis McClinton175-661-3.78Mack Lee Hill125-627-5.02-1.24-155
63ATL1997Jamal Anderson290-1002-3.46Byron Hanspard53-335-6.32-2.87-152
64TAM2005Cadillac Williams290-1178-4.06Michael Pittman70-436-6.23-2.17-152
65SFO1962J.D. Smith258-907-3.52Billy Kilmer93-478-5.14-1.62-151
66CIN1993Harold Green215-589-2.74Derrick Fenner121-482-3.98-1.24-151
67DEN2007Travis Henry167-691-4.14Selvin Young140-729-5.21-1.07-150
68SEA1988Curt Warner266-1025-3.85John Williams189-877-4.64-0.79-149
69MIA1969Jim Kiick180-575-3.19Larry Csonka131-566-4.32-1.13-148
70CLE1970Leroy Kelly206-656-3.18Bo Scott151-625-4.14-0.95-144
71SEA2007Shaun Alexander207-716-3.46Maurice Morris140-628-4.49-1.03-144
72ATL2001Maurice Smith237-760-3.21Bob Christian44-284-6.45-3.25-143
73ARI2008Tim Hightower143-399-2.79Edgerrin James133-514-3.86-1.07-143
74STL1977Wayne Morris165-661-4.01Terry Metcalf149-739-4.96-0.95-142
75STL2004Marshall Faulk195-774-3.97Steven Jackson134-673-5.02-1.05-141
76BAL1964Lenny Moore157-584-3.72Tony Lorick100-513-5.13-1.41-141
77NYG1993Rodney Hampton292-1077-3.69Lewis Tillman121-585-4.83-1.15-139
78HOU1977Ronnie Coleman185-660-3.57Rob Carpenter144-652-4.53-0.96-138
79SFO1967Ken Willard169-510-3.02John David Crow113-479-4.24-1.22-138
80JAX1999James Stewart249-931-3.74Fred Taylor159-732-4.6-0.86-138
81DAL2001Emmitt Smith261-1021-3.91Troy Hambrick113-579-5.12-1.21-137
82SDG2004LaDainian Tomlinson339-1335-3.94Jesse Chatman65-392-6.03-2.09-136
83NOR2011Mark Ingram122-474-3.89Pierre Thomas110-562-5.11-1.22-135
84PHI1992Herschel Walker267-1070-4.01Heath Sherman112-583-5.21-1.2-134
85DEN1981Dave Preston183-640-3.5Rick Parros176-749-4.26-0.76-133
86PIT1991Merril Hoge165-610-3.7Barry Foster96-488-5.08-1.39-133
87KAN2011Thomas Jones153-478-3.12Jackie Battle149-597-4.01-0.88-131
88NYJ1969Matt Snell191-695-3.64Emerson Boozer130-604-4.65-1.01-131
89DAL2008Marion Barber238-885-3.72Tashard Choice92-472-5.13-1.41-130
90CLE1972Leroy Kelly224-811-3.62Bo Scott123-571-4.64-1.02-126
91WAS1991Earnest Byner274-1048-3.82Ricky Ervins145-680-4.69-0.86-125
92CLE1993Tommy Vardell171-644-3.77Eric Metcalf129-611-4.74-0.97-125
93PHI2002Duce Staley269-1029-3.83Dorsey Levens75-411-5.48-1.65-124
94CLE2008Jamal Lewis279-1002-3.59Jerome Harrison34-246-7.24-3.64-124
95GNB2013Eddie Lacy284-1178-4.15James Starks89-493-5.54-1.39-124
96TAM1995Errict Rhett332-1207-3.64Jerry Ellison26-218-8.38-4.75-123
97MIA2007Jesse Chatman128-515-4.02Ronnie Brown119-602-5.06-1.04-123
98DAL1986Tony Dorsett184-748-4.07Herschel Walker151-737-4.88-0.82-123
99WAS1995Terry Allen338-1309-3.87Brian Mitchell46-301-6.54-2.67-123
100NOR1990Rueben Mayes138-510-3.7Craig Heyward129-599-4.64-0.95-122
101KAN1987Christian Okoye157-660-4.2Herman Heard82-466-5.68-1.48-121
102MIN2003Moe Williams174-745-4.28Onterrio Smith107-579-5.41-1.13-121
103OAK2009Justin Fargas129-491-3.81Michael Bush123-589-4.79-0.98-121
104PIT1983Franco Harris279-1007-3.61Frank Pollard135-608-4.5-0.89-121
105NWE2011BenJarvus Green-Ellis181-667-3.69Stevan Ridley87-441-5.07-1.38-120
106NWE2008Sammy Morris156-727-4.66Kevin Faulk83-507-6.11-1.45-120
107CHI1962Ronnie Bull113-363-3.21Joe Marconi89-406-4.56-1.35-120
108NWE2010BenJarvus Green-Ellis229-1008-4.4Danny Woodhead97-547-5.64-1.24-120
109NYG2008Brandon Jacobs219-1089-4.97Derrick Ward182-1025-5.63-0.66-120
110NOR1991Gill Fenerty139-477-3.43Fred McAfee109-494-4.53-1.1-120
111WAS1974Larry Brown Jr.163-430-2.64Moses Denson103-391-3.8-1.16-119
112NYG1997Tyrone Wheatley152-583-3.84Charles Way151-698-4.62-0.79-119
113DET1986James Jones252-903-3.58Garry James159-688-4.33-0.74-118
114STL1969Johnny Roland138-498-3.61Cid Edwards107-504-4.71-1.1-118
115NOR1971Bob Gresham127-383-3.02Jim Strong95-404-4.25-1.24-118
116JAX2006Fred Taylor231-1146-4.96Maurice Jones-Drew166-941-5.67-0.71-117
117RAM1964Ben Wilson159-553-3.48Les Josephson96-451-4.7-1.22-117
118PHI2001Duce Staley166-604-3.64Correll Buckhalter129-586-4.54-0.9-117
119DET1980Billy Sims313-1303-4.16Dexter Bussey145-720-4.97-0.8-116
120CIN2012BenJarvus Green-Ellis278-1094-3.94Cedric Peerman36-258-7.17-3.23-116
121GNB1963Jim Taylor248-1018-4.1Tom Moore132-658-4.98-0.88-116
122IND1986Randy McMillan189-609-3.22Albert Bentley73-351-4.81-1.59-116
123CHI1987Walter Payton146-533-3.65Neal Anderson129-586-4.54-0.89-115
124NYG1963Phil King161-613-3.81Joe Morrison119-568-4.77-0.97-115
125NYJ2001Curtis Martin333-1513-4.54LaMont Jordan39-292-7.49-2.94-115
126SEA2010Marshawn Lynch165-573-3.47Justin Forsett118-523-4.43-0.96-113
127STL1963Joe Childress174-701-4.03Bill Triplett134-652-4.87-0.84-112
128OAK1980Mark van Eeghen222-838-3.77Kenny King172-761-4.42-0.65-112
129CIN2013BenJarvus Green-Ellis220-756-3.44Giovani Bernard170-695-4.09-0.65-111
130PHI2003Correll Buckhalter126-542-4.3Brian Westbrook117-613-5.24-0.94-110
131DET2012Mikel Leshoure215-798-3.71Joique Bell82-414-5.05-1.34-110
132PHI2000Darnell Autry112-334-2.98Duce Staley79-344-4.35-1.37-108
133OAK1975Pete Banaszak187-672-3.59Mark van Eeghen136-597-4.39-0.8-108
134NWE1978Sam Cunningham199-768-3.86Andy Johnson147-675-4.59-0.73-108
135NWE2013Stevan Ridley178-773-4.34LeGarrette Blount153-772-5.05-0.7-108
136MIN1993Barry Word142-458-3.23Scottie Graham118-488-4.14-0.91-107
137PIT2004Jerome Bettis250-941-3.76Duce Staley192-830-4.32-0.56-107
138STL1996Lawrence Phillips193-632-3.27Harold Green127-523-4.12-0.84-107
139ATL1991Erric Pegram101-349-3.46Steve Broussard99-449-4.54-1.08-107
140RAI1983Marcus Allen266-1014-3.81Frank Hawkins110-526-4.78-0.97-107
141CHI1975Walter Payton196-679-3.46Roland Harper100-453-4.53-1.07-107
142STL1998Robert Holcombe98-230-2.35June Henley88-313-3.56-1.21-106
143MIA1992Mark Higgs256-915-3.57Bobby Humphrey102-471-4.62-1.04-106
144CHI1960Rick Casares160-566-3.54Willie Galimore74-368-4.97-1.44-106
145CLE2013Willis McGahee138-377-2.73Chris Ogbonnaya49-240-4.9-2.17-106
146DAL2006Julius Jones267-1084-4.06Marion Barber135-654-4.84-0.78-106
147SDG1992Marion Butts218-809-3.71Rod Bernstine106-499-4.71-1-106
148BOS1962Jim Crawford139-459-3.3Ron Burton134-548-4.09-0.79-106
149OAK1968Hewritt Dixon206-865-4.2Charlie Smith95-504-5.31-1.11-105
150SFO1990Roger Craig141-439-3.11Dexter Carter114-460-4.04-0.92-105
151STL1984Ottis Anderson289-1174-4.06Stump Mitchell81-434-5.36-1.3-105
152NYJ2008Thomas Jones290-1312-4.52Leon Washington76-448-5.89-1.37-104
153NYJ1966Matt Snell178-644-3.62Emerson Boozer97-455-4.69-1.07-104
154HOU2002Jonathan Wells197-529-2.69James Allen155-519-3.35-0.66-103
155DEN1980Dave Preston111-385-3.47Otis Armstrong106-470-4.43-0.97-102
156KAN1996Marcus Allen206-830-4.03Greg Hill135-645-4.78-0.75-101
157OAK1967Hewritt Dixon153-559-3.65Clem Daniels130-575-4.42-0.77-100

I’ll let you guys scroll through the table and comment on what you find interesting. Here’s something that jumped out to me (remember, the table is searchable and sortable — you can type in ‘nyj’ to find all Jets pairings or ‘pit’ to find all Steelers pairings, and so on). BenJarvus Green-Ellis appears in the table in each of the last four years with four different backup running backs.

What about the numbers from last year? [1]Note that I am only comparing the top two running backs. So in Minnesota, Toby Gerhart produced a fantastic YPC average, but since he ranked 3rd on the team in rush attempts, he is not included. A negative number means the backup averaged more YPC, while a positive means the starter averaged more YPC. Here’s the full list, from Mendenhall/Ellington and Trent Richardson/Donald Brown to the teams where the running back with the most carries produced a higher YPC average than the running back with the second most carries:

RkTmYearRB1RB1 Rsh-Yd-YPCRB2RB2 Rsh-Yd-YPCYPC DiffVALUE
1ARI2013Rashard Mendenhall217-687-3.17Andre Ellington118-652-5.53-2.36-278
2IND2013Trent Richardson157-458-2.92Donald Brown102-537-5.26-2.35-239
3GNB2013Eddie Lacy284-1178-4.15James Starks89-493-5.54-1.39-124
4CIN2013BenJarvus Green-Ellis220-756-3.44Giovani Bernard170-695-4.09-0.65-111
5NWE2013Stevan Ridley178-773-4.34LeGarrette Blount153-772-5.05-0.7-108
6CLE2013Willis McGahee138-377-2.73Chris Ogbonnaya49-240-4.9-2.17-106
7NOR2013Pierre Thomas147-549-3.73Mark Ingram78-386-4.95-1.21-95
8BUF2013Fred Jackson206-890-4.32C.J. Spiller202-933-4.62-0.3-60
9DEN2013Knowshon Moreno241-1038-4.31Montee Ball120-559-4.66-0.35-42
10SFO2013Frank Gore276-1128-4.09Kendall Hunter78-358-4.59-0.5-39
11HOU2013Ben Tate181-771-4.26Arian Foster121-542-4.48-0.22-27
12PIT2013Le'Veon Bell244-860-3.52Jonathan Dwyer49-197-4.02-0.5-24
13ATL2013Steven Jackson157-543-3.46Jacquizz Rodgers96-332-3.4600
14TEN2013Chris Johnson279-1077-3.86Shonn Greene77-295-3.830.032
15JAX2013Maurice Jones-Drew234-803-3.43Jordan Todman76-256-3.370.065
16NYG2013Andre Brown139-492-3.54Peyton Hillis73-247-3.380.1611
17WAS2013Alfred Morris276-1275-4.62Roy Helu Jr.62-274-4.420.212
18MIA2013Lamar Miller177-709-4.01Daniel Thomas109-406-3.720.2831
19BAL2013Ray Rice214-660-3.08Bernard Pierce152-436-2.870.2233
20MIN2013Adrian Peterson279-1266-4.54Matt Asiata44-166-3.770.7634
21TAM2013Bobby Rainey137-532-3.88Doug Martin127-456-3.590.2937
22SDG2013Ryan Mathews285-1255-4.4Danny Woodhead106-429-4.050.3638
23STL2013Zac Stacy250-973-3.89Daryl Richardson69-215-3.120.7854
24SEA2013Marshawn Lynch301-1257-4.18Robert Turbin77-264-3.430.7558
25CAR2013DeAngelo Williams201-843-4.19Mike Tolbert101-361-3.570.6263
26PHI2013LeSean McCoy314-1607-5.12Bryce Brown75-314-4.190.9370
27CHI2013Matt Forte289-1339-4.63Michael Bush63-197-3.131.5195
28DET2013Reggie Bush223-1006-4.51Joique Bell166-650-3.920.699
29KAN2013Jamaal Charles259-1287-4.97Knile Davis70-242-3.461.51106
30NYJ2013Chris Ivory182-833-4.58Bilal Powell176-697-3.960.62109
31DAL2013DeMarco Murray217-1121-5.17Joseph Randle54-164-3.042.13115
32OAK2013Rashad Jennings163-733-4.5Darren McFadden114-379-3.321.17134

References

References
1 Note that I am only comparing the top two running backs. So in Minnesota, Toby Gerhart produced a fantastic YPC average, but since he ranked 3rd on the team in rush attempts, he is not included.
{ 28 comments }