Previous Passing Stats:
Patience is a virtue best served cold for Dolphins fans. It took six failed breakout seasons, but eventually, Dr. Kevorkian finally came for the Ryan Tannehill era in Miami. Maybe all Tannehill needed for his breakout season to be realized was to change teams?
Here’s Ryan Tannehill’s ANY/A average in every game of his career (min: 10 pass attempts). Dolphins colors and Titans colors as appropriate.
Black line is his trailing 7 game ANY/A average. pic.twitter.com/x2Kv8WaKaP
— Football Perspective (@fbgchase) December 9, 2019
On Sunday, Tannehill had yet another career game, completing 21 of 27 passes for 391 yards, with 3 TDs and one tipped interception. Shockingly, he didn’t take a single sack, for just the 7th time in his career. He threw for 15 first downs. In Tannehill’s last game with the Dolphins, he was seen throwing for just 8 first downs on 35 dropbacks (31 attempts, 4 sacks). His success in Tennessee is unsustainable — he’s not going to average 13.4 yards per completion or complete 73% of his passes — but he’s been legitimately great over the last two months. Nobody ever knows how the Ryan Tannehill Experience will change week to week, but it’s been a fun ride for a player who never could put it together for long with the Dolphins.
The table below shows the week 14 passing stats.
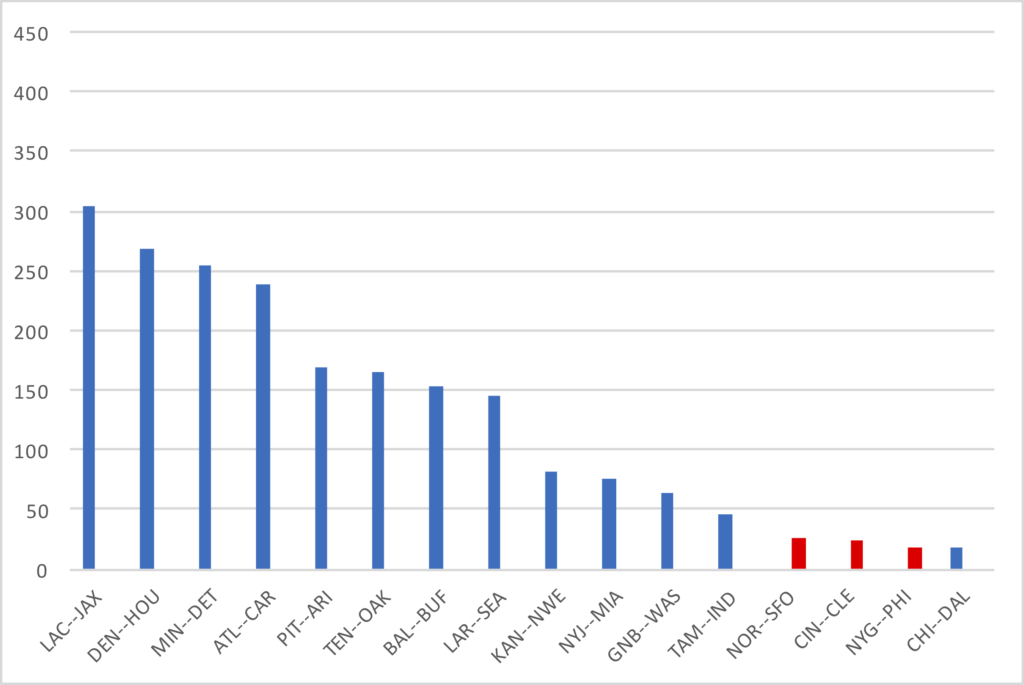
As usual, the better passing teams won in week 14. There were 11 teams who won the ANY/A value battle by more than 50 adjusted net yards, and those teams went 11-0. The notable exception was Drew Brees outplaying Jimmy Garoppolo, but this analysis includes the 35-yard touchdown pass thrown by Emmanuel Sanders to narrow the gape. That was the game of the week, and while the 49ers escaped with a last-second, 48-46 victory, I’ll note there was a hidden reason the Saints lost this game: they had one fewer possession than the 49ers.
San Francisco scored 48 points on 12 drives, while the Saints scored 46 points on 11 drives. New Orleans got the ball at the end of the first half with 37 seconds remaining at their own 28-yard line. The Saints called a running play for 6 yards, let the clock run down, and then called a short pass. The drive ended with the half expiring, which cost New Orleans a drive: the Saints got the opening kickoff, and each team had 5 first half drives. In the second half, the 49ers received the kickoff and ended the game with the ball, stealing an extra drive for the 49ers.
 In the Bengals/Browns game, Baker Mayfield was not good, but the stats here probably overstate how effective Andy Dalton was for Cincinnati. He may have won the ANY/A battle, but he threw a pick 6, and the Bengals went 3/12 on 3rd down and converted on just 1 of 5 trips inside the red zone. The Giants/Eagles game was another example of situational football deciding the game: the Giants were 2/12 on 3rd down and 0-1 in the red zone, while Philadelphia was 9/21 on 3rd down and 3/4 in the red zone.
What stands out to you?
