The first game involved Chip Kelly’s blitzkrieg offense. Nick Foles threw for seven touchdowns against the Raiders in one of the most lopsided (and surprising) games of the season. The Eagles held a 28-13 lead at halftime and 49-13 at the end of the third quarter; over the course of the game, Philadelphia held an average lead of 21.3 points.
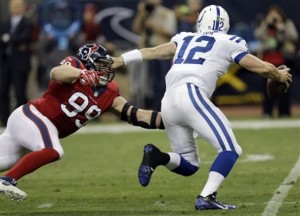
At the other end of the spectrum, we have yet another Andrew Luck comeback victory. The Texans led 14-0 after the first quarter and 21-3 at halftime; on average, Houston held an 11-point lead throughout the game, but a 15-0 edge in the fourth quarter gave Indianapolis the win. That’s the highest Game Script of any team to lose a game in 2012, replacing…. Houston’s victory over the Chargers on opening week, when the Texans had a Game Script of -7.7 points.
In addition to the Colts-Texans game, the crazy comeback in Seattle now gives each of the Seahawks and the Bucs two of the five biggest comebacks/giveaways of the year. In week four, Seattle won in overtime against Houston despite trailing by, on average, 7.7 points in regulation. That was probably an even more crazy game than the win against Tampa Bay, where Seattle came back from a 21-0 deficit but only outscored the Bucs by 10 points in the fourth quarter. As for Tampa Bay, this was the fourth game of the season where the team lost despite having a 95% win probability at some point in the game. This was also the second time the Bucs lost a game with a Game Script of over 6.0 points, joining the come-from-ahead loss to Arizona.
Without further ado, the table below shows the week 9 Game Scripts data:
In general, the usual trend held as teams with negative Game Scripts passed more frequently than their opponents, with a couple of notable exceptions. After Aaron Rodgers went down, the Packers executed a run-heavy game plan centered around Eddie Lacy, and therefore passed less often than Chicago despite trailing by, on average, 1.6 points.
The Dallas/Minnesota game was even more extreme. In some ways, it’s not surprising seeing Tony Romo and the Cowboys pass more often than a Vikings team with Adrian Peterson, but it’s the magnitude of the disparity that is jarring. Through five weeks, I noted that the Cowboys had the second strongest pass identity in the league. Things haven’t changed too much, other than an uncharacteristically ground-heavy performance (30 passes, 26 runs) in a 1-point loss to Detroit (Game Script of +1.2) in week eight. Against the Washington and Philadelphia in weeks six and seven, Dallas passed often despite holding strong leads, but against Minnesota, the Cowboys’ pass identity was off the charts. Dallas passed on 85.7% of all plays — tied for the highest mark of the season — despite holding an average lead of 1.4 points.
The other games all went according to (game) script, with the trailing team passing more often than the leading team, although the San Diego/Washington game was pretty extreme, too. This was an even game — Washington had a Game Script of +0.1 — so the large disparity in the teams’ pass/run ratios provides a window into each team’s true identity. For Washington, that involves a heavy dose of the run: Alfred Morris has 25 carries, Robert Griffin III had six runs, and Darrel Young had three touchdowns on five carries. Washington rushed 40 times for 209 yards and 4 touchdowns, while passing just 32 times. That’s probably the ideal split for the Shanaclan, as Griffin was very efficient: he picked up 291 passing yards (and was not sacked) on 32 dropbacks, and Pierre Garcon had 7 catches for 172 yards.
San Diego represents the other extreme. Danny Woodhead and Ryan Mathews each had seven carries, and that was it for the running game (although Philip Rivers technically added 14 yards on two scrambles). The Chargers star quarterback is having a magnificent season as part of the team’s new horizontal offense. But this was far from his best day: Rivers threw for 50 more yards than Griffin, but it took him fifteen more dropbacks.
As a reminder, you can view the game scripts from every game this year at this page. Finally, let’s close with some average field position data from week nine.
Against the Saints, the Jets scored 26 points despite throwing for only 115 yards and picking up just 14 first downs. Field position played a key role in that production. The Jets last touchdown was set up by an Antonio Cromartie interception that gave New York the ball at the Saints 39-yard line. The Jets first score of the game was a field goal set up by another Drew Brees interception, which put the Jets on the New Orleans 48. The Jets did start one drive at their own 4-yard line, but on the second play of that drive, Chris Ivory ran for 52 yards, putting the Jets in Saints territory.

