Yesterday, I wrote that the range of passer ratings is getting smaller. Today, let’s investigate why. As you know, passer rating is made up of four variables: completion percentage, yards per attempt, touchdown rate, and interception rate.
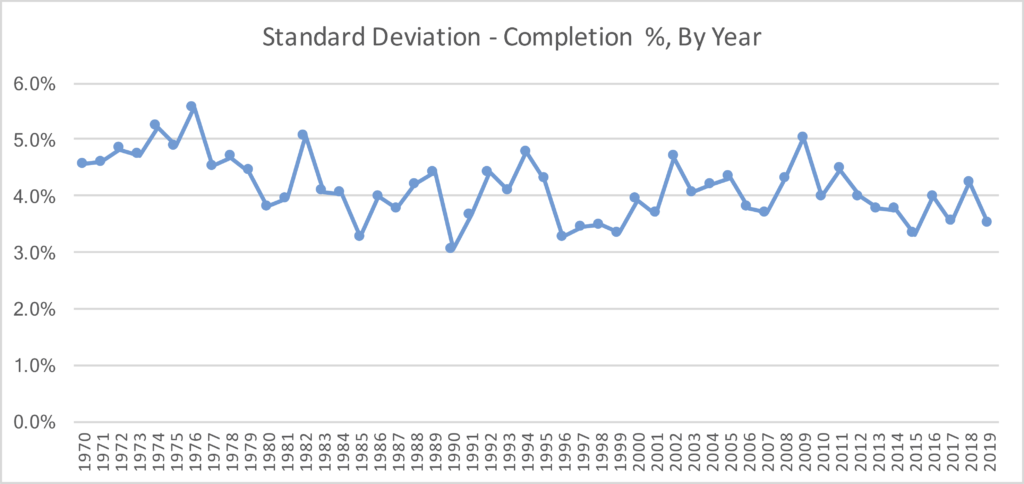
For each of the four variables, I calculated the standard deviation in that metric for all of the teams in the league in that season. Last year, for example, the standard deviation in completion percentage was about 3.5%. That’s on the low end historically, although not the absolute lowest mark. But in general, it’s fair to say that the league-wide completion percentages are getting more compressed. Last season, the Saints completed 72% of the team’s passes, and the Bengals were last at 58%. But in 1976, the Raiders were at 64%, while the Bills were at 41%. That In 1994, the 49ers were a big outlier as they completed 70% of their passes at a time when two teams (Washington, Houston) completed just under 50% of their passes.
With a much higher floor now — the league average completion percentage was 58% in 1994, the same as what the 32nd-ranked Bengals did in 2019 — completion percentages as a whole are simply more compressed.
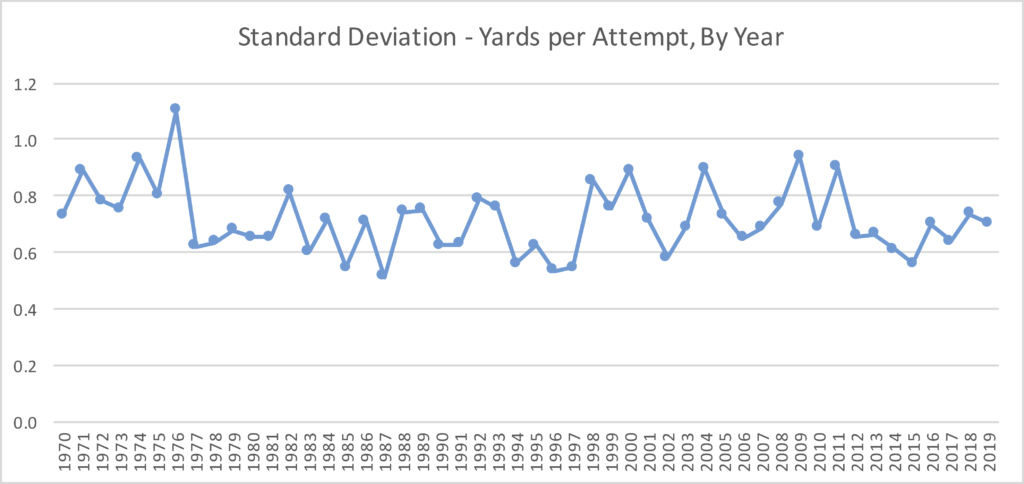
 When it comes to yards per attempt, there isn’t much of a trend. The variation was a bit higher in the ’70s, but over the last 40 years, the standard deviation is around 0.7 yards per attempt each season.
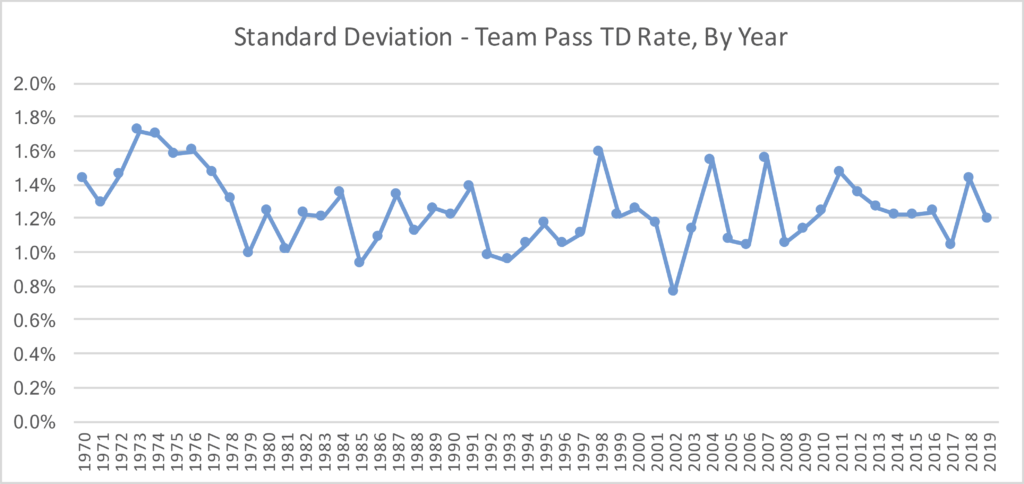
 There is no trend in the variation with touchdown rate, either. Once again, the variation was higher in the early ’70s, but over the last 40 seasons, if anything, the variation has been increasing.
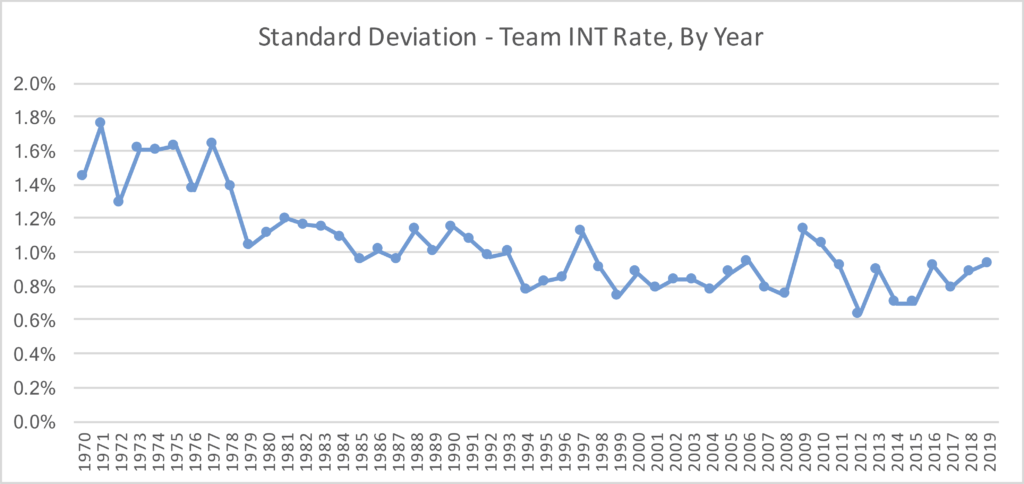
 The biggest trend, however, comes with interception rate. There used to be a significant variation in INT rates. In 1971, there were two teams who had 3% interception rates and two teams that had 9% interception rates. But no team has had an interception rate above 5.0% since the 2013 Giants, and every team last season was below 4% except the Bucs. With interception rates dropping significantly, this naturally means the rates are compressed; after all, the difference between the best and worst teams was 6% in 1971, which can’t be replicated in today’s environment.
 So we see that interception rates have become much more compressed, completion percentages have become more compressed, and not much has changed in the variation of the other two metrics. But this does have the impact of compressing passer ratings overall, and as INT rates continue to decline and completion percentages continue to rise, we should only expect these trends to continue.
