≡ Menu

TD/INT Ratio Leaders (1946 to 2024)

A salute to the 6-time champion… of TD/INT ratio.

Back in March 2017, I wrote about the single-season leaders in touchdown-to-interception ratio.  Despite being a stat that is frequently referenced, there is no official tracking of TD/INT ratio. Of course, it’s not that hard to calculate yourself, so I went ahead and calculated the leader in every season since World War II.  Today, we update that to account for what’s happened over the last eight seasons.

When I wrote the original article, Tom Brady was tied for the most TD/INT titles in league history.  He led the league in TD/INT ratio in 2007, 2010, 2015, and 2016. That tied him with Roger Staubach and Charlie Conerly, who also each led the NFL in the category in four different seasons.  However, since then, Aaron Rodgers has broken the record.

Rodgers led the NFL in TD/INT ratio in 2011, 2013, and 2014.  Then, in 2018, he had one of the best TD/INT seasons of all time.  This was not a vintage Rodgers season by any stretch — he was actually slightly below league average in Net Yards per Attempt and the Packers went 6-9-1 and ranked 14th in scoring — but he threw 25 touchdowns and just two interceptions.  That 12.5 ratio of passing touchdowns to interceptions remains the 4th best of all time among qualifying passers (14 attempts per team game), and is the best mark in NFL history among quarterbacks who started more than 12 games in a season.

Rodgers was about to repeat as TD/INT leader in 2019, but an interception in the final two minutes of the final game allowed Drew Brees to win the crown.  But Rodgers then had two more MVP seasons in 2020 and 2021, and easily led the NFL in TD/INT ratio both seasons.  Rodgers threw more than 9 touchdowns per interception both years; Patrick Mahomes finished 2nd in 2020 at 6.33-to-1, while Kirk Cousins (4.71) was the runner-up in 2021.

That means Rodgers has led the NFL in TD/INT ratio an incredible six times in his career: 2011, 2013, 2014, 2018, 2020, and 2021.  Since then, Jared Goff with the Lions and C.J. Stroud (as a rookie!) with the Texans have won the crown. And in 2024, Lamar Jackson ran away with things to win his first TD/INT crown. He led the NFL in touchdown rate and had the second-best interception rate, finishing with 41 passing TDs and just 4 INTs, a 10.25 ratio that is one of the best marks in history. [continue reading…]

{ 1 comment }

In week 9, the Dolphins lost 21-14 to Kansas City. That game was notable because Tua Tagovailoa passed for 193 yards, slightly outgaining Patrick Mahomes, who threw for 185 yards in a winning effort. That doesn’t sound so unusual, especially given how close the totals were: Miami’s quarterback passed for more yards than Kansas City’s quarterback, and Miami lost the game.

But that was unusual: in fact, that is the only game this season where that happened for the Dolphins. In 12 games this year, Miami has had more gross passing yards (excluding sacks) than they have allowed; in those games, the Dolphins are 11-1. In four other games, opposing passers have more passing yards than Dolphins passers; the Dolphins are 0-4 in those games. So in 15 of 16 Miami Dolphins games, the team with more gross passing yards has also won the game.

And that is both rare and a perfect example of the 2023 season.  Because while Miami with Mike McDaniel  and Tua are outliers, the 2023 season is pretty big outlier, too.  In general, throughout the course of NFL history, there is not much of a correlation between which team has more passing yards and which team wins the game. As we know, teams that are trailing late in games throw more frequently — and can rack up the passing yards — than teams with a lead. The same reason you hear starts like “Team X is 15-2 when RB Y has 20 carries or more” is why passing yards isn’t all that correlated with winning. [continue reading…]

{ 11 comments }

There are still three games left to play in the 2023 NFL regular season. And for San Francisco, that includes a game Monday night against the AFC’s best team, the Baltimore Ravens. But let’s just pause for a moment and appreciate how dominant San Francisco has been this year.

On offense, the 49ers are averaging 9.45 Adjusted Net Yards per Attempt. [1]ANY/A is simply yards per attempt, with a 20-yard bonus for sacks, a 45-yard penalty for interceptions, and includes sack data. That is significantly better than the rest of the league; Miami ranks second at 7.89, and Houston ranks third at 7.07. The league average this season is 5.79 ANY/A, meaning San Franciso is averaging 3.66 ANY/A more than the average team. How remarkable is that? Well, if it holds up, it would finish as the third best of the Super Bowl era:

Yes, that means this San Francisco offense — with Brock Purdy, Christian McCaffrey, Deebo Samuel, George Kittle, Brandon Aiyuk, and Trent Williams — is already one of the best of the Super Bowl era even after you adjust for era. [2]Without adjusting for era, the 49ers rank as the 2nd-best passing offense ever. Think about that: every other offense in the Super Bowl era, besides Peyton Manning in his best year and Dan Marino in his best year, has been less efficient than this year’s 49ers team. [continue reading…]

References

References
1 ANY/A is simply yards per attempt, with a 20-yard bonus for sacks, a 45-yard penalty for interceptions, and includes sack data.
2 Without adjusting for era, the 49ers rank as the 2nd-best passing offense ever.
{ 8 comments }

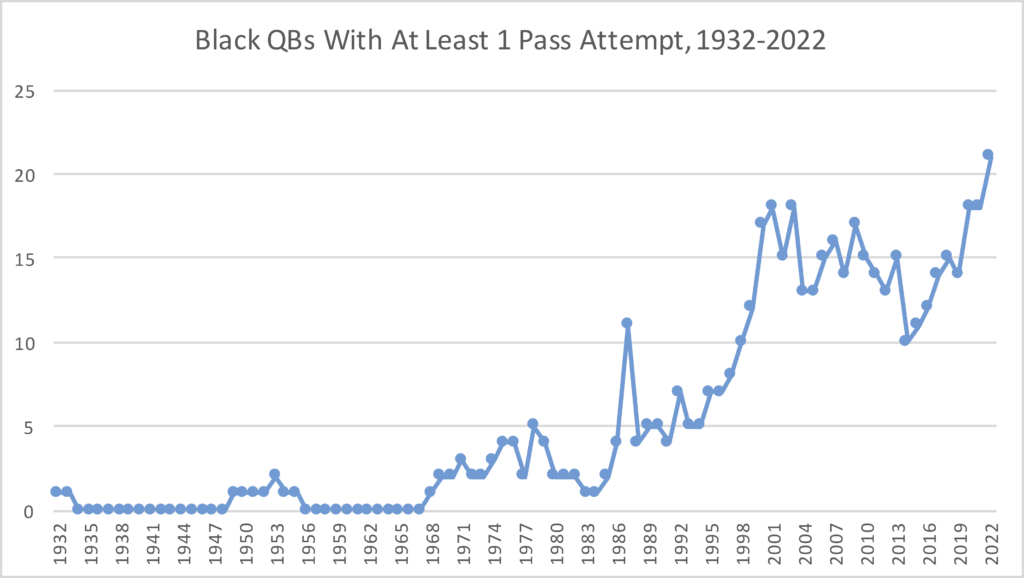
The 2022 season was another groundbreaking season for black quarterbacks in the NFL. There were 21 black quarterbacks who threw at least one pass this year, the highest number in a single season in NFL history. The graph below shows how many black quarterbacks in the NFL [1]Or AFL or AAFC. threw at least one pass in each season since the league began recording passing statistics in 1932:

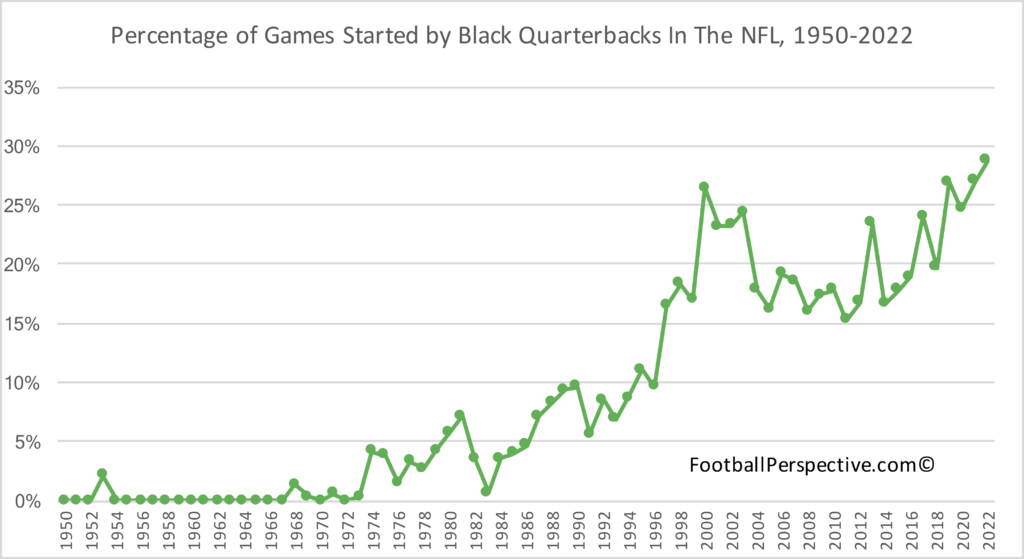
Black quarterbacks also started 29% of all games, another high-water mark for the league. In 2022, 15 of the league’s 32 teams started a black quarterback in at least one game, including the PFWA Comeback Player of the Year (Seattle’s Geno Smith), the Most Valuable Player in the league (Kansas City’s Patrick Mahomes) and the quarterback of the league’s best team during the regular season (Philadelphia’s Jalen Hurts).

The charts above tell a remarkable story. Consider that the year of the first Super Bowl (1966), there were no black quarterbacks in the AFL or NFL. When Tom Brady was born (1977), there had never been an NFL game where both teams started black quarterbacks. And when Brady was drafted, there had never been two black quarterbacks to face off in an NFL playoff game. Now, on the day that Brady is retiring, it’s a noteworthy sign of progress that we are just days away from the first Super Bowl featuring two black quarterbacks (Mahomes and Hurts). It has been a remarkable journey for black quarterbacks in the NFL, one that started over one hundred years ago. [continue reading…]

References

References
1 Or AFL or AAFC.
{ 8 comments }

San Francisco 49ers rookie quarterback Brock Purdy is on the verge of making NFL history. If the 49ers can upset the Eagles in the NFC Championship Game, Purdy would become the first rookie quarterback to ever start in a Super Bowl.

Only a few rookie “quarterbacks” have ever led a team to an NFL title, with quarterbacks in quotation marks the farther back in time we go. In 1946, a 25-year-old Otto Graham led the Cleveland Browns to an AAFC title in his first season. The prior year, a 25-year-old Bob Waterfield led the NFL in touchdown passes as a rookie and then threw two touchdown passes in the NFL title game to help lead the Rams to their first ring. Perhaps the best rookie season of them all came from Sammy Baugh in 1937, as he led Washington to the championship. And three years earlier, rookie Ed Danowski helped the Giants stage a fourth quarter comeback to beat the Bears in a famous title game.

Purdy has only started five regular season and two playoff games in his NFL career so far, and he sports a perfect 7-0 record. An appearance in Super Bowl LVII would be his 9th NFL start; believe it or not, that would only rank as the third fewest by a starting quarterback in the Super Bowl. On the other hand, at just over 23 years old, Purdy would in fact be the youngest quarterback to start a Super Bowl. [continue reading…]

{ 1 comment }

Zach Wilson and The Worst Passer Rating In The NFL

When the Jets drafted Zach Wilson, the hope was that the kid from BYU would end a long line of Jets draft busts. Because after having their hopes dashed by Mark Sanchez, Geno Smith, and then Sam Darnold, the Jets were due for some good luck. Right?

[continue reading…]

{ 7 comments }

Throughout NFL history, having a strong running offense and a dominant pass defense has been a recipe for success. But the 2022 Eagles are currently doing something that hasn’t been done in 40 or 45 years, depending on your view of the 1982 strike season. Through 13 games, the Eagles have one of the top running games in the NFL. Powered by quarterback Jalen Hurts and running back Miles Sanders, Philadelphia is tied for 2nd in the NFL in rushing yards and leads the NFL in rushing first downs. The Eagles are also averaging 4.87 yards per carry, good enough for 5th best. Meanwhile, Philadelphia’s pass defense has been phenomenal. Even ignoring the NFL-best 15 interceptions (and NFL-best 3.4% interception rate), Eagles opponents are averaging just 4.80 net yards per pass attempt, the top rate in the league.

Yes, that means the Eagles gain more yards per rush than their opponents average per pass. Which is pretty ridiculous!

It’s not unusual for teams to come pretty close here: the Buffalo Bills nearly pulled this one off last season with very similar numbers. Buffalo averaged 4.79 yards per carry and allowed 4.84 net yards per attempt in 2021. [continue reading…]

{ 8 comments }

Let’s Ride Away From The End Zone

In 1946, the Pittsburgh Steelers went 5-5-1. While the sum of the team’s parts may have been perfectly average, their components were far from it. The head coach was newly-hired Jock Sutherland, who had been a local hero after taking the Pitt Panthers to four Rose Bowls. After a stint in the Navy during World War II, he returned to the city and coached the Steelers for two seasons, beginning in 1946. In the 10-team NFL, Pittsburgh allowed the fewest points in the NFL at 10.6 per game, a mark that would not be matched again until the Lombardi Packers in 1962. The NFL average in 1946 was 18.9 points per game, and every other team allowed at least 14.4 points per game. Unfortunately, the Steelers offense was as bad as the defense was good: the black and gold finished last in the league in scoring at 12.4 points per game.

That 1946 team was led by Bill Dudley, an all-world star who won the league’s MVP award. In addition to leading the league in rushing yards… and punt return yards and average… Dudley intercepted 10 passes that season! That remarkable fact came despite the Steelers only facing 162 pass attempts that season, meaning Dudley intercepted one out of every 16.2 passes the Steelers defense saw that season. It remains arguably the greatest season of thievery in NFL history.

Those ’46 Steelers were otherwise an unremarkable team, notable for this one fact: Pittsburgh is the last team to finish as the league’s lowest scoring team and to also allow the fewest points in the league. But this year, the 2022 Denver Broncos are challenging that mark. Through 9 games and 10 weeks of the season, Denver ranks last in scoring and first in points allowed. The Broncos have 131 points scored through 9 games — a very bad number although not a particularly low mark for the league’s worst-scoring team. [1]Last year, Houston scored 128 points through 9 games, and this year, the Colts have just one more point than Denver And they have allowed 149 points despite facing 11.8 drives per game (thanks, offense), tied for the most in the NFL.

A few teams have come close to pulling off this rare achievement, but it’s remarkable to consider that no team has done this since Sutherland’s Steelers. [2]Only one team has gone in the other direction: the 2000 Rams led the league in scoring but also ranked last in points allowed. There have been just 31.1 points per game scored in Broncos games this season.  In the last 25 seasons, only two other times has that happened: the famed 2000 Ravens teams, and the 2005 Bears team that tried to replicate that approach, using Brian Urlacher as Ray Lewis and Kyle Orton as Trent Dilfer. [continue reading…]

References

References
1 Last year, Houston scored 128 points through 9 games, and this year, the Colts have just one more point than Denver
2 Only one team has gone in the other direction: the 2000 Rams led the league in scoring but also ranked last in points allowed.
{ 2 comments }

The Final Score Is: 20-17

October 5th, 1924 was not the most exciting day in pro football history. The Cardinals defeated the Packers 3-0 in a game that was representative of things to come. Elsewhere, the Duluth Kelleys beat the Minneapolis Marines 3-0, the Akron Pros won in Rochester against the Jeffersons by a 3-0 score, and the Milwaukee Badgers hosted and defeated the Kansas City Blues by the score of — you guessed it — three to zero. It was the only time in NFL history that four games all finished with the same score on the same day. [continue reading…]

{ 2 comments }

Football in the Northeast is Back

The New England Patriots, New York Giants, New York Giants and Philadelphia Eagles are undeniably in the northeast. I think most would include the Buffalo Bills are as well, although they do play in western New York. The state of Pennsylvania is commonly included in the northeast, but I don’t think it’s reasonable to include Pittsburgh, on the western border, in as a team in the northeast. The Baltimore Ravens are only 100 miles away from Philadelphia, but they are also only 40 miles from Washington, D.C., and no sensible definition of “Northeast” should include the nation’s capital.

So I’m going to stick with the NE-NYG-NYJ-PHI-BUF pairing as the definition of Northeast football. And only two years ago, it looked really bad: [continue reading…]

{ 2 comments }

Third Down Performance: How Much Is A 3rd Down Worth?

From 2002 to 2021, NFL teams converted 38.9% of all third down attempts. Third down performance is really meaningful when it comes to winning games, but it can also be pretty random from sample to sample. So as a result, third down performance has an outsized performance on who wins and loses that game, but is probably not all that predictable as to who will win the next game.

I thought it would be interesting to look at this in the context of the pre-game point spread. Let’s start with a few basic numbers, looking at this 20-year period.

  • Teams that were favored by 1 to 5.5 points won 58.7% of their games.
  • Teams that were favored by 6 to 8 points won 73.6% of their games.
  • Teams that were favored by more than 8 points won 83.4% of their games.

But let’s say you know that the favorite would lose the third down battle. How does that change things?

  • Teams that were favored by 1 to 5.5 points but were worse on third downs won only 43.4% of their games.
  • Teams that were favored by 6 to 8 points but were worse on third downs won only 54.2% of their games.
  • Teams that were favored by more than 8 points but were worse on third downs won 68.2% of their games.

Now, saying an underdog just needs to win the third down battle is not very helpful, and only a little more precise (and about as useless) as saying they just need to score more points. But it does help to provide some guardrails about the magnitude of third down performance. It can flip a big favorite into a coin flip, and a huge favorite suddenly has a real chance of losing.

Can we quantify exactly how important third down success is? I’m glad you asked. As we know, each team has a 38.9% chance of converting an average third down. Suppose each team has 15 third down attempts in the game. Let’s say one team coverts 10 of 15, while the other only converts five opportunities. The expected number of third down conversions for both teams is 5.8 (0.389 multiplied by 15), so one team converted 4.2 more first downs than expected, while the other converted 0.8 fewer than expected. The net difference, of course, is five conversions — let’s call that the net third downs added. [continue reading…]

{ 4 comments }

Adjusted Interceptions: Career Totals

Yesterday, I did a fairly simple analysis to compare interception numbers across eras. Because I covered the methodology in the previous post, I am not going to regurgitate that information here. Instead, I want to just get right into it. When I did the career adjusted sacks post, I went step-by-step in the same manner I did in the single season article. This time, however, I think we can skip past all that and look at the end results.

Career Adjusted Interception Totals

The first table is sorted by the last column, but you can re-sort by any header you like. Using Rod Woodson as an example, here’s how you read the table: Woodson intercepted 71 passes against 8401 attempts at a 0.85% rate. His passing environment modifier (Mod) is worth 142%, and the softened version of that (Soft) is worth 121%. Taking the average of his actual interceptions and interceptions per 500 attempts in order to account for volume gives us the Mid adjustment, which is 98% in Woodson’s case. Applying my homebrewed league strength multiplier (LSM) gives him a 99% adjustment.

If we multiply Woodson’s 71 interceptions by Mod, Mid, and LSM, we get a whopping 97.7 adjusted interceptions for his career. If we dampen it by multiplying those 71 picks by Soft, Mid, and LSM, Woodson’s career adjusted interceptions come to 83.2, good for the highest mark ever. [1]For the ModTot, that’s 71 * 142% * 98% * 99%. For the SoftTot, that’s 71 * 121% * 98% * 99%.

Using the actual historical average as a baseline appears to be a bit much, going by the numbers it produces. I think having Charles Woodson, Ed Reed, Rod Woodson, a serial rapist, and Aeneas Williams as the top five (by ModTot) is fine; giving Chuck credit for 101 interceptions is a bit much for me. Moving the all time leader in picks, Paul Krause, down to ninth also feels a tad harsh as well. Sure, I think he tends to be overrated by people who look at one number and base their entire evaluation on that single data point, but I also think having such a commanding lead over any modern player should count for something. For this reason, I think the SoftTot column produces results with greater face validity.

The last column gives us a top ten of seven Hall of Famers, one senior candidate who will likely get the necessary votes soon, possibly the best safety of the 1990s who would be in Canton already if he played for Dallas or San Francisco, and a a vile monster who was good at picking off passes and not really much else.

Let’s Be Reasonable

The wacky looking career totals form the table above convinced me to try using a new baseline. I decided to use the last 40 years of football, which incorporates nearly the entire period of open offense football. [2]I refer to football in the wake of the Mel Blount Rule and rules enabling offensive linemen to extend their hands to block in 1978, as well as the subsequent offensive revolution heralded by the … Continue reading When I looked at that timeframe, the historical baseline moved from 4.80% to 3.16%. because of that, I have dubbed the new baseline the Austin Percentage. Having a lower baseline means that fewer players will see their totals go up, and only the most recent players will their totals go up significantly.

The table below is sorted by the last column, but you can sort by any of the headings. Using Krause as our example, read the table thus: Krause picked off 81 passes against 5623 attempts at a 1.44% rate. His volume adjustment is worth 117%, and his league strength multiplier is worth 88%. His Austin figure is 60%, which comes to 80% when the effect is halved. [3]Recall from the first table that his Mod and Soft were 91% and 96% because of the highest baseline. If we apply the Mid, LSM, and Austin modifiers to Krause’s 81 actual interceptions, his total plummets to 49.9, which ranks tenth on the career list. If we replace the Austin modifier with the softened version, Krause’s number falls to just 66.4, which allows him to maintain his place atop the interception mountain. [4]To arrive at the numbers in the Austin column, we use: 81 * 117% * 88% * 60%. To find the results for the HalfTot column, we use: 81 * 117% * 88% * 80%. These figures are rounded and will produce … Continue reading

If you earnestly believe older players relied too much on archaic passing to glean their big interception totals, the Austin column might be for you. Before we find Krause at number ten, only Rod Woodson and Eugene Robinson had any action prior to 1990. Recent ball hawk Richard Sherman is in a fourteen-way tie for 104th place in career interceptions, with 37. However, when Austin 3.16 comes around, Sherman jumps to 18th, which does feel more appropriate for one of the premier turnover artists of recent vintage. In fact, his 8.4 interception boost is the highest number of any player, just beating out the bonuses of 8.3 and 8.1 for fellow playmakers Xavien Howard and Marcus Peters. Wandering mercenary Aqib Talib finds himself pretty high on the career list when looking at the Austin total.

While some recent players saw modest gains, older players saw their totals fall off a cliff with the lower baseline. Emlen Tunnell, a real life hero who picked off 79 passes—but did most of his damage in the 1950s—suffers a reduction of 43.6 from his total. He goes from ranking second on the official list to 54th on the Austin list. That seems a little steep, even to a noted old school player hater like I am. Night Train Lane and Johnny Robinson join Krause and Tunnell as the only other players to lose at least 30 from their totals. Turn-of-the-century players like Sam Madison and Patrick Surtain see almost no change in their career numbers.

I think the last column makes the most sense at first glace. Tunnell, Robinson, and Jim Norton all lose more than 20 from their real numbers, and no one gains more than 3.6. Krause loses 14.6, but because Tunnell lost 22 and his lead over anyone else was huge, he remains in first place. Rod Woodson loses 4.7 from his total, while Charles Woodson and Ed Reed each lose about half a pick, resulting in the three ending pretty clustered, and all close to Krause at the top. While Tunnell has a large reduction, his actual number of interceptions was so high to begin with that he still ranks sixth here.

I am often interested to see where Ken Riley and Dave Brown will fall, relative to one another. Riley has 65 interceptions to Brown’s 62. The Austin adjustment puts Brown ahead, while my preferred adjustment leaves the Bengals legend with a 54.6 to 53.4 lead. Riley never made a Pro Bowl, but he earned first team all pro honors once and second team honors twice. Brown made one Pro Bowl and one all pro second team. Given how close together these two are in terms of actual production, the gap in their public perception is pretty interesting to me. When you consider the fact that Brown was his team’s top corner, while Lemar Parrish was the top corner in Cincinnati until 1977, the issue is further muddled.

I will leave further commentary to the FP faithful, if any remain.


References

References
1 For the ModTot, that’s 71 * 142% * 98% * 99%. For the SoftTot, that’s 71 * 121% * 98% * 99%.
2 I refer to football in the wake of the Mel Blount Rule and rules enabling offensive linemen to extend their hands to block in 1978, as well as the subsequent offensive revolution heralded by the likes of Bill Walsh, Don Coryell, and Joe Gibbs.
3 Recall from the first table that his Mod and Soft were 91% and 96% because of the highest baseline.
4 To arrive at the numbers in the Austin column, we use: 81 * 117% * 88% * 60%. To find the results for the HalfTot column, we use: 81 * 117% * 88% * 80%. These figures are rounded and will produce slightly different results if you copy and paste to work with them yourself.
{ 2 comments }

Adjusted Interceptions: Single Seasons

I recently reopened a discussion about sacks Chase started years ago. Today, I’m going to rehash another topic our prolific host has covered time and again (and again): adjusting interceptions for era. Unlike sacks, which have official number dating back to 1982 and unofficial ones published as far back as 1960, interceptions have official records as far back as 1940. This gives us much more data to work with, but it also provides similar challenges that Sid Luckman presents when adjusting passing stats: the game is so different now from what it was in the 1940s that trying to compare the numbers side by side ends up killing newer players when adjusting for dropbacks or hurting older players when adjusting for passing environment. But getting it 85% right is better than not doing anything at all, so I’m going to do it anyway. As I did with the sack posts, I will go through my progressions of adjustments one step at a time, so that you can see how we arrived at the final numbers.

Normalizing for Volume

It stands to reason that intercepting ten passes against 300 attempts is more impressive than intercepting the same number of passes against 600 attempts—at least, as far as getting interceptions is at all impressive when divorced from other aspects of play. Because of this, it is necessary to put players on a more even playing field. Using Bill Dudley‘s frankly ridiculous 1946 season as an example, follow the table like so: Dudley, playing in 1946 for the Steelers, appeared in 11 games and snagged 10 interceptions against 162 opponent pass attempts. That comes to an outlandish 6.17% interception rate. If we adjust for volume by giving all players credit for their interception rate multiplied by 500 attempts, Dudley’s 1946 comes to 30.9 picks per 500 passes. If you look at that number and mutter “well, that’s just too high,” then we are in agreement. Thus, I took the average of their actual picks and their attempts per 500 passes to find the number in the last column, which I have labeled Mid. Using that adjustment instead, Dudley’s season was only good for 20.4 volume-adjusted interceptions.

If we stop here, it’s easy to see the glaring issue: the much higher interception rate in the days of yore leaves us with a list that doesn’t feature it’s first player after the year 2000 until the 210th spot. Even using the mid number, Ty Law‘s 2005 doesn’t show up until 115. Clearly, we need to keep going.

Incorporating League Environment

The next step is to incorporate the league average interception rate for each season. To do this, I used all seasons from 1940-2021 and found the three-year rolling average, with each given year in the middle (So 2017 would include the average of seasons 2016-2018). Then, I found three numbers: the cumulative interception rate from 1940-2021 (4.02%), the average of averages for each year in the sample (5.18%), and the median rate from the sample (5.21%). Then I took the average of those three numbers (4.80%) and used it as the historical baseline.

The next two tables use this step. The first of the two displays adjusted interception rates, while the latter of the two displays adjusted totals. Using Xavien Howard‘s 2020 as an example, read the table thus: Howard played 16 games and had 10 interceptions against 545 attempts, good for a 1.83% pick rate. The rolling average for 2020 is 2.28%, so Howard gets a boost of 210.5% (4.80/2.28) in the column labeled Mod. If you think that’s too higher, I included a softened version, which is the average of Mod and 100% (in this case, the Soft number is 155.2%). When using the Mod figure to adjust his interception rate, Howard gets credit for a rate of 3.86% (that’s 1.83% * 210.5%), the highest number on record. Using the softened version gives him 2.85% (1.83% * 155.2%), which ranks 18th.

This one is interesting to me, because the modified version seems too skewed in favor of modern players, while the softened version doesn’t feel harsh enough toward the old guys. We’ll go to the table below to see what that looks like in terms of interceptions rather just the more abstract percentages.

Incorporating League Environment (Again)

Let’s use J.C. Jackson as our example this time. In 2020, he played 16 games and hauled in 9 interceptions. We know his adjusted rates from the table above. Using the full modifier on his actual interceptions gives him 18.9 adjusted interceptions, while using the soft modifier gives him 14.0. Jackson is the rare current player who actually gets a boost from using per 500 attempt numbers, albeit a small one. Using the full modifier multiplied by his interceptions per 500 attempts (9.1 from the first table) leaves him with 19.2, while using the softened version gives him credit for 14.1. Note, I did not use the Mid figure from the first table, because too many columns makes these things unwieldy, in my opinion. Instead, I saved that for the last table.

Looking at the Mod and Soft multipliers applied to interceptions, without accounting for volume, just leaves us with a huge list of recent players. While I believe modern defenders to be both superior and in a more difficult position because of rules and schemes, I don’t think it makes sense to give them this much of a boost. Especially when the point of this whole exercise is not to measure the quality of a player, but rather use a variety of factors to more appropriately compare his interception totals to those of other defenders. One need only look at the career of Darrelle Revis to know that having a relatively low turnover total doesn’t preclude a player from greatness. And Ken Riley‘s career makes it evident that a player can find himself quite high on the career pick list without having been the best cornerback on his own team during his prime.

Putting it All Together

Below is the final table for today. Here, I have tried to strike a balance between adjusting for volume and adjusting for environment, but I kept battling with myself over whether I preferred full rate modifiers or soft ones. So I decided to just present both and let the reader decide. Using the controversial 2021 Trevon Diggs season, read the table thus: in 16 games, Diggs had 11 interceptions against 612 passes, good for a 1.80% rate. His Mid volume adjustment (from the first table) is worth 91%. That, combined with his 211.2%environmental modifier (Mod from the second table) gives him 21.1 adjusted interceptions in the Mod-Mid column. Using the Soft modifier instead gives him 15.5.

Instead of using the 4.80% historical baseline that I found, Chase most recently used 3.5%. Doing so doesn’t do much to the orders of the lists any, but it does have a significant impact on the totals by degree. So Diggs would still rank first in the Mod-Mid column and second in the Soft-Mid column, but he would have something closer to 15.4 and 12.7 as his adjusted interception total. While these numbers are more or less abstract and don’t really matter, I do think having the lower baseline Chase used produces results that look more realistic, even if the 3.5% figure was chosen at random (and I don’t know if it was or was not chosen at random). In fact, when I looked at career totals, I actually preferred to use an even lower baseline of 3.16%, which represents the last 40 years of football and covers basically the entire period of post-1978 rules changes that help permanently drop leaguewide interception rates below five percent.

When looking at the results above, the last column seems to produce the most even mix of old and new players. Oddly, however, I may prefer the Mod-Mid column when looking at career totals, which we will see later.  [1]How much later, I simply cannot say. Regardless, I think accounting for both volume and passing environment, in some form or fashion, helps put the numbers into more proper context. Even if it does take a little shine off my man Dick Lane.


References

References
1 How much later, I simply cannot say.
{ 2 comments }

Adjusted Sacks: Career Totals

Recently, I reintroduced the concept of adjusted sack numbers for individual player seasons. [1]I say recently because Chase published an article about the idea as early as 2015, and I recall reading articles that touched on the issue at the old PFR blog. The logical next step, to me, is to take a look at those stats in the context of full careers. I liked the idea of presenting career data in terms of per-500 dropback metrics and cumulative totals. On top of the methodologies we discussed in the last post, I also wanted to introduce two new ways to look at the information. I hope it proves interesting, and I apologize in advance for my spectacular inability to come up with better acronyms, initialisms, and abbreviations.

Normalized for Volume

The table below contains every player in history with at least 30 sacks (or 30 in the last column) since 1960. Read it thus: Deacon Jones played in 191 games and recorded 173.5 sacks against 5891 dropbacks. His 2.95% career sack rate means he was good for 14.7 sacks per 500 dropbacks over the course of his entire career. If we take his sacks per 500 dropbacks totals from each season and add them together, we get 203.3, which is easily the highest mark ever.

As you probably expected, older players and T.J. Watt dominate the S/500 column. Guys like Robustelli and Marchetti played against offensive linemen hamstrung by rules, while Watt is a quarterback killer still in his prime. When we look in the last column, we can see how much the small differences in each season add up to a big gap between Bruce Smith and Reggie White. Three members of the Purple People Eaters appear in the top eight, though one guy took an additional sixty-ish games to get there.

Also, is it possible that the Hall of Fame actually doesn’t like pass rushers as much as people think?

League Environment Incorporated

In order to account for the easier environment for getting into the backfield long ago, we will use the modified and soft-modified conversions we used in the last article. The table contains any pass rusher who recorded at least 30 actual sacks or reached 30 in either of the last two columns. Read it thus: Alan Page played 218 games and recorded 148.5 sacks against 6348 dropbacks, which is good for a rate of 2.34%. His modifier is worth 91.5%, which becomes 95.7% when softened. For his career, he had 10.7 modified sacks per 500 dropbacks and 11.2 soft-modified sacks per 500 dropbacks. If we take the cumulative totals of those two stats, Page had 160.7 and 169.9, respectively.

When we look at the Soft500 column, we get a fun mix of characters. The Deacon is on top, followed by the younger Watt. Then we get another legend followed by another guy with scant games under his belt. Marchetti and Robustelli have a significant chunk of their careers omitted from this study because Turney and Webster haven’t finished their work on pre-1960 sacks, but the fact that they rank so highly on a per season basis despite not having years prior to their mid-thirties demonstrates how apt they were at pass rushing.

Alex Karras probably would have been in the Hall of Fame earlier were it not for his gambling controversy, while Claude Humphrey likely belongs on more lists of greatest pass rushers. Watch his tape, and you’ll see a guy whose athleticism stands out in the same way that Len Ford‘s did earlier or Julius Peppers‘s did later. Coy Bacon ranks tenth in the SoftTot column. He is a mere 4.3 below Jim Marshall, despite appearing in over one hundred fewer games.

Concentration Accounted For

Now it’s time to take pass rushing depth into consideration by applying a league concentration adjustment to each player. Here’s how to read the table, using Reggie White as an example: White’s career concentration adjustment is worth 1.036, meaning he gets a 3.6% boost to his stats from previous steps. For comparison’s sake, he had 198 actual sacks. When applying the concentration adjustment to his sacks per 500 dropbacks, his number comes to 11.7. If we include the modifier for league sack environment, that number jumps to 12.1. Softening that modifier brings his number down a bit, this time to 11.9. When we add all of White’s single-season figures in concentration-adjusted sacks per 500 dropbacks, his career total is 177.7. The cumulative number for the modified version of that comes to 181.1, and the softened iteration totals 179.4.

The thing that stands out to me is the placement of John Abraham. He is tied for eighteenth on the official sack list but jumps to thirteenth when sorting by the penultimate column. Abraham made five Pro Bowls and three all pro first teams, which doesn’t scream “Hall of Fame,” but he had eight seasons with double digit sacks and two more seasons in which he missed games but still notched 9.5 sacks. In 2003, he played in just seven games but managed 6 sacks. Had he stayed healthy in 2003-04, he likely would have had five consecutive seasons with 10+ sacks after becoming a starter. Abraham was a few injuries away from retiring with eleven seasons in the double digits. I remember watching footage of the highly celebrated Robustelli and thinking his postseasons honors indicate a Reggie White level of play but the tape suggested he was more akin to John Abraham. The per-season numbers in this table support that notion. If the second best Bengals cornerback of the 1970s can make it to Canton, maybe Abraham has a chance at a senior nod one day. [2]Note, I wouldn’t put him in, but with the bar being set at the Sprinkle and Riley level, I don’t think I know what a HOFer is anymore.

Dominance Exalted

The table below displays what I think is a more accurate representation of what we think about when we think about great pass rushers. Instead of career compilation, we’re looking at career value over a given baseline. [3]Refer to the previous article for the methodology. Read the table thus: Jack Youngblood played in 202 games and recorded 151.5 sacks. For his career, his sack rate was 1.04% better than the league baseline, giving him 5.2 extra sacks per 500 dropbacks. When summing his individual seasons in that metric, he was worth 74.3 sacks above baseline. If we apply the concentration adjustment to his career numbers, he was worth 69.8 added sacks. When we get rid of all seasons that are below average and look only at what might be considered peak production, Youngblood’s value jumps to 72.4.

This table is a numeric representation of why Jim Marshall can rank 23rd in career sacks and not make it to the Hall of Fame. For his career, he was barely above the baseline, meaning he was ultimately worth about 19 extra sacks. Compare that with Bacon, who shares a ranking on the unofficial career list. Because his sack performances were more dominant, his career sack value is 54.7, which puts him in elite company. Cedrick Hardman, Simeon Rice, Harvey Martin, and Jack Gregory are a few other players who stand out as dominant sack artists who may be underrated now.

Something New

I figured I would throw in a few new concepts just to round out the discussion. I have long been a fan of Pro Football Reference’s passing index scores, and I have created my own versions of them for several different stats. This time, I applied the methodology to defensive sack rates. Also, because the results of the single season and career numbers still seem to favor older players, despite the entire purpose of this exercise being to translate across eras, I wanted to incorporate the league strength modifiers I have been working on for the past several years. [4]These take into account things like integration vs segregation, positional specialization, league attractiveness vs other sports, pay, the existence of rival leagues, U.S. population of NFL-aged men, … Continue reading People who lament that football today isn’t like the football idealized by marvelous NFL Films creations may not like this.

The below chart shows every player with at least 3000 dropbacks faced. Using Jared Allen as an example, read the table thus: Allen had 134 sacks against 6426 dropbacks for a 2.09% sack rate. His sack rate was nearly a full standard deviation above the median, giving him a sack rate+ of 113.5. [5]Highest on record, min 3000 dropbacks faced. T.J. Watt will take over the top spot soon. He currently has a rate+ of 117.2. Nick Bosa and Micah Parsons are also higher than Allen, though they are … Continue reading His concentration-adjusted career sack value, after accounting for league strength, is 61.1. When we look at only his positive value seasons, it raises slightly to 61.7.

I believe the top ten, as ranked by the last column, is a great list of stellar sacksmiths. A decent era range shows up, and there doesn’t seem to be too much skew toward older or newer players. However, this may be because it more closely lines up with my subjective view of these players, and we love to have our priors confirmed.

The lowest ranked players on the list are linebackers who had a decent number of sacks but played in coverage too often to reasonably compete with edge rushers, as well as interior linemen who played a ton of snaps but weren’t primarily pass rushers.

What stands out to you?


References

References
1 I say recently because Chase published an article about the idea as early as 2015, and I recall reading articles that touched on the issue at the old PFR blog.
2 Note, I wouldn’t put him in, but with the bar being set at the Sprinkle and Riley level, I don’t think I know what a HOFer is anymore.
3 Refer to the previous article for the methodology.
4 These take into account things like integration vs segregation, positional specialization, league attractiveness vs other sports, pay, the existence of rival leagues, U.S. population of NFL-aged men, number of players playing high school and college football in preceding years, etc.
5 Highest on record, min 3000 dropbacks faced. T.J. Watt will take over the top spot soon. He currently has a rate+ of 117.2. Nick Bosa and Micah Parsons are also higher than Allen, though they are much further from reaching the 3000 dropback threshold.
{ 1 comment }

Adjusted Sacks: Single Seasons

In 2015 (and, again, in 2018), Chase published his methodology for comparing individual sack seasons across eras. At the time, we had only the official numbers available, so the comparisons didn’t capture any performances prior to 1982. Now, thanks to the work of dedicated researchers John Turney and Nick Webster, we have reliable sack data dating back to 1960 (with more likely to come in the future). [1]Thanks to Webster, specifically, we also have the numbers for Len Ford‘s outlandish 1951 campaign. Although I don’t have the same context for that season, I will be including it with … Continue reading With all the new information available, I was excited to pick up where Chase left off and include the additional 22 years of preceding data. Because of the new seasons included, the results of this post will differ from Chase’s, even among players included in the original article, so this should offer some new insight beyond adding names to the list.

Normalizing for Volume

The first step is to account for the fact that teams throw the ball more frequently today than they did in the sixties, eighties, or even the aughts. To do this, I am going to do what Chase did, because it seemed like a reasonable first step to me. That first step is to find the number of dropbacks a player’s team faced that season and calculate the percentage of those plays on which he sacked the quarterback. [2]There is a case to be made that one should only include dropbacks in games which players participated. So Jared Allen would only count as having played 14 games in 2007, rather than 16 games. … Continue reading Next, we multiply that number by 500 in order to put pass rushers on a more even playing field.

Take Cleveland Elam‘s 1977, for example. He dropped opposing quarterbacks 17.5 times while the 49ers faced just 312 dropbacks. That gives him an incredible 5.61% sack rate, which translates to 28.0 sacks against 500 dropbacks. [continue reading…]

References

References
1 Thanks to Webster, specifically, we also have the numbers for Len Ford‘s outlandish 1951 campaign. Although I don’t have the same context for that season, I will be including it with those from 1960 onward.
2 There is a case to be made that one should only include dropbacks in games which players participated. So Jared Allen would only count as having played 14 games in 2007, rather than 16 games. However, I think availability is important and don’t wish to further bolster a player for missing time during the season.
{ 4 comments }

Boxscore vs. PFF: Era in Review

Adam Steele is back with more analysis of traditional box score stats versus Pro Football Focus’s big time throw and turnover-worthy play metrics. And we thank him for it.


A couple of weeks ago, I compared TD/INT and BTT/TWP numbers for the 2021 season. Today we’ll be looking at the entire Pro Football Focus era going back to 2006.

Before compiling the data, I hypothesized that TD/INT and BTT/TWP would track in relative lockstep, though perhaps the upward slope of the PFF metrics would be less severe. That turns out to be true for 2006-07 and 2014-21, but oh boy was there some wackiness taking place in between. In the graph below, you’ll see league TD-INT difference in blue and league BTT-TWP difference in red: [continue reading…]

{ 1 comment }

From the Archives: 2019 GridFe Hall of Fame Defense

The following article originally appeared on the now-defunct GridFe website but never found its way to Football Perspective after Adam Steele and I decided to shut things down in our little corner of the internet. For the sake of having a reference, I have decided to republish in Chase’s space. Below is the article as originally published following the 2018 season.


Last year, I unveiled the GridFe Hall of Fame, a group effort of football diehards dissatisfied with (and unencumbered by the logistical limitations of) the Pro Football Hall of Fame. [1]The GrideFe Hall of Fame Committee comprises research guru Topher Doll, standard human Bryan Frye, actual genius Adam Harstad, enigmatic fount of knowledge Raider Joe, potentate of … Continue reading This Hall of Fame has very few rules outside of a minimum five “yea” votes out of a possible six for enshrinement. We have no waiting period for induction. If it’s obvious that Tom Brady belongs, he’s in; if we need to take some time to put Julio Jones‘s stats into perspective, we will. We don’t have contribution silos. I didn’t vote for John Madden solely as a coach but as a coach, influential broadcaster, and video game pioneer. [continue reading…]

References

References
1 The GrideFe Hall of Fame Committee comprises research guru Topher Doll, standard human Bryan Frye, actual genius Adam Harstad, enigmatic fount of knowledge Raider Joe, potentate of prognostication Thomas McDermott, and quarterback aficionado Adam Steele.
{ 4 comments }

From the Archives: 2019 GridFe Hall of Fame Offense

The following article originally appeared on the now-defunct GridFe website but never found its way to Football Perspective after Adam Steele and I decided to shut things down in our little corner of the internet. For the sake of having a reference, I have decided to republish in Chase’s space. Below is the article as originally published following the 2018 season.


The GridFe Hall of Fame 2019 class features no quarterbacks and is heavy on running backs, tight ends, and linemen. [1]The only quarterback who received votes got just two of them. Meanwhile, several linemen just missed the cut. Unlike the defensive hall of fame class, the offense features no active players. In fact, the most recent player last played in 1988. Perhaps that’s indicative of more clearly worthy defensive players in today’s league, or maybe it simply means more voters have taken a wait-and-see approach with regards to positions that have seen significant stat inflation in recent years. [2]An alternative theory is that we voted for all the worthy offensive players in the inaugural class. Tom Brady, Drew Brees, Aaron Rodgers, Adrian Peterson, Larry Fitzgerald, Jason Witten, and Antonio … Continue reading It’s outlandish to believe that with greater talent than ever before, only one hall of fame caliber wide receiver has entered the league in the last twenty years. Is it possible we have exercised too much caution with modern players? I don’t know, but it’s certainly possible. Below are eight inductees for this year’s class. Read and determine for yourself. [3]Others receiving votes: Len Dawson, Curtis Martin, Ollie Matson*, Bobby Mitchell*, Elroy Hirsch, Pete Pihos*, Rayfield Wright*, Jim Tyrer*, Gary Zimmerman*, Joe DeLamielleure*

GridFe Hall of Fame Offense

Marion Motley (1946-1955)
Cleveland Browns, Pittsburgh Steelers
5 First Team All Pros (4 AAFC/1 NFL), 1 Pro Bowl, 6 Title Wins, 3 Title Losses, 1 GridFe World Award (AAFC), 1 GridFe Sweetness Award, 1 GridFe Supersonic Award, 7 GridFe Motley Awards (4 AAFC/3 NFL) [4]The Pro Bowl didn’t exist when Motley played in the AAFC, but he was worthy of the honor all four years. [continue reading…]

References

References
1 The only quarterback who received votes got just two of them. Meanwhile, several linemen just missed the cut.
2 An alternative theory is that we voted for all the worthy offensive players in the inaugural class. Tom Brady, Drew Brees, Aaron Rodgers, Adrian Peterson, Larry Fitzgerald, Jason Witten, and Antonio Gates are still playing. Rob Gronkowski and Joe Thomas were active when we began voting. I suspect with another season to evaluate their careers from a historical perspective, Julio Jones and Antonio Brown will garner more attention. If people are voting for Len Dawson, Philip Rivers and Ben Roethlisberger may also join the discussion. Perhaps Marshal Yanda will receive the recognition from us he deserved from national media.
3 Others receiving votes: Len Dawson, Curtis Martin, Ollie Matson*, Bobby Mitchell*, Elroy Hirsch, Pete Pihos*, Rayfield Wright*, Jim Tyrer*, Gary Zimmerman*, Joe DeLamielleure*
4 The Pro Bowl didn’t exist when Motley played in the AAFC, but he was worthy of the honor all four years.
{ 1 comment }

Guest Post: Improving on TD:INT Ratio

Adam Steele is back with the crazy notion that we should stop using stochastic, binary events in ratio form as the basis for judging quarterbacks. Fancy that. We thank Adam for his ideas and analysis.


The most commonly cited quarterback stats in mainstream analysis are touchdown passes and interceptions, usually presented as TD/INT ratio. This essentially functions as shorthand to compare the quantity of a player’s great plays against his terrible plays. But this is quite unfortunate since both stats are very noisy and situation dependent. TD/INT ratio not only lacks important information but it can be downright misleading at times.

Luckily for us the good folks at Pro Football Focus have come up with a much better alternative: Big Time Throws (BTT) and Turnover Worthy Plays (TWP). These stats are tabulated by watching film so they capture far more signal than the process-blind box score numbers. Passers get credited with a BTT when they make a throw that goes well beyond what’s expected on a given play, and this includes passes which are dropped or wiped out by penalty. Meanwhile a TWP is charged when a throw is made that has a good chance of being intercepted (whether it’s actually picked or not), or when the QB gets careless with the ball during his dropback and fumbles when such an error could’ve been avoided. [continue reading…]

{ 3 comments }

Ten years ago, I looked at the passing distribution of NFL teams since 1970. Let’s revisit that post today, with an expanded look at what’s happened over the last decade.

I examined every season in the NFL since 1970, when the AFL and NFL merged. [1]It is not lost on me that NFL history is not linear, and in many ways, the 1960s is more similar to the 1980s than the 1970s. That said, out of laziness, I only went back to 1970. I then calculated the percentage of receiving yards for each team that went to its running backs, tight ends and wide receivers. The graph below shows the breakdown from each season from 1970 through 2021. [2]Some caveats: Obviously many players straddle the line across multiple positions. There are some judgment calls involved with H-Backs, tight ends turned wide receivers, running backs turned tight … Continue reading. There are two large trends: wide receivers have become slightly more important over time, jumping from 53% of the receiving pie during the ’70s to 63% over the last ten years. The entire jump, though, came in the aftermath of the 1978 rules changes, as the percentage of receiving yards that went to wide receivers steadily rose form 53% in 1977 to 62% in 1987 and 1988.

The other notable change is the switch in primacy of the tight end relative to the running back. From 1970 to 1983, running backs gained 27% of all receiving yards while tight ends picked up just 19% of the pie. That breakdown was pretty consistent each season: tight ends were at 18%, 19%, or 20% almost every season, and running backs consistently gained between 25% and 29& of the receiving game. The 1984 season was a weird outlier: running back production was way down while tight end production was up, but that was mostly a one year blip. From 1985 to 1994, running backs averaged 22% of the pie, a noticeable decrease from the pre-1984 era, but tight ends dropped, too, down to 15% during that decade. And from 1986 through 2007, tight ends were under 20% of the receiving pie each year. But tight ends have held steady at 20 or 21 percent, while running back production in the receiving game has dropped to about 16%. In 2004, tight ends gained more receiving yards as a group than running backs, and it has remained that way in every season since. This is strongly tied, of course, to the near-elimination of the fullback position from the modern game. [continue reading…]

References

References
1 It is not lost on me that NFL history is not linear, and in many ways, the 1960s is more similar to the 1980s than the 1970s. That said, out of laziness, I only went back to 1970.
2 Some caveats: Obviously many players straddle the line across multiple positions. There are some judgment calls involved with H-Backs, tight ends turned wide receivers, running backs turned tight ends, etc. I did my best to make the appropriate call in each case. Note also that for this article, I’ve eliminated all players who ended the season with negative receiving yards, and am only looking at receiving yards by running backs (which includes fullbacks), receivers and tight ends.
{ 2 comments }

In 1999 and 2000, no team in NFL history relied on one running back quite like the Indianapolis Colts.  During those two seasons, Edgerrin James was responsible for 98% of all carries given to Colts running backs, 99% of all rushing yards from Indianapolis running backs, and 98% of all yards from scrimmage and 97% of all touchdowns scored by Colts running backs.  The table below shows the stats from the nine running backs to play for the Colts during these two seasons: [continue reading…]

{ 4 comments }

Twenty years ago, in the summer of 2002, Doug Drinen wrote this about Running Back By Committee:

Any way you want to look at it, the use of RBBC has been decreasing for about three decades. In 2000, RBBC was at an all-time (since 1970) low. In 2001, it was back up slightly, but was still lower than it has ever been.

Drinen labeled a running back by committee (RBBC) if the team’s top running back scored less than half of the team’s total fantasy points by running backs. How do things look over the last 20 years? [1]In my effort re-create Drinen’s study, I am defining fantasy points as (receptions / 2) + (rushing yards + receiving yards) / 10 + (rushing TDs + receiving TDs ) * 6. [continue reading…]

References

References
1 In my effort re-create Drinen’s study, I am defining fantasy points as (receptions / 2) + (rushing yards + receiving yards) / 10 + (rushing TDs + receiving TDs ) * 6.
{ 16 comments }

The 2022 NFL Schedule

Every year, I publish a color-coded version of the NFL schedule the night it is released. This year, things were delayed a bit, but it’s ready now. [continue reading…]

{ 0 comments }

Overtime in the Playoffs From 2011 Through 2021

The 2009 NFC Championship Game was a classic game featuring two future Hall of Fame quarterbacks in Brett Favre and Drew Brees. The Vikings battled the Saints in the Superdome to a 28-28 tie after four quarters. New Orleans won the coin toss, giving Brees and the offense the ball first. The Saints appeared to go three-and-out, but an incomplete pass on third down was negated by a defensive holding penalty. The Saints got to the Vikings 41-yard line, and a pass interference penalty gave them another 12 yards. A couple of minutes later, and Garrett Hartley hit a 40-yard field goal to send New Orleans to the Super Bowl.

It was an anticlimactic ending to a great game. After battling for four quarters, the Saints — aided by a pair of penalties — drove 39 yards in 10 plays to set up a chip shot field goal and won the game. The coin toss was too significant a factor in the game, critics felt, especially as kickers were becoming automatic at longer and longer distances.

So beginning in 2011, the NFL changed the rules: the team that wins the coin toss can’t win the game on a field goal. It must score a touchdown, or else the other team would get the ball, too. That would make the flip of the coin a bit less valuable, or so we were told.

Since then, there have been 11 overtime games played during the NFL playoffs. The team that won the coin toss has won 10 of those games. Let’s walk down memory lane: [continue reading…]

{ 2 comments }

Do Championships Matter?

Adam Steele comes to us today with a philosophical question regarding the nature of fandom. We thank him for it.


After a weekend in which all four games were coin flips decided on the final play, I started thinking about how much the results actually matter to fans in the long run. We’ve had the primacy of titles drilled into our heads throughout our lives – hoisting the Lombardi trophy is why you play the game, there’s only one winner and 31 losers, etc. And sure, in the most literal sense, attempting to win a championship is the reason we hold a season every year.

But how much do championships really matter to fans? My sense is that they matter far less than you’d initially think. If you ask a group of fans to name their most cherished football memories, a majority of their answers will probably not be related to winning it all.

Think about all the amazing player seasons throughout football history. The vast majority of them did not result in a ring. Did fans of Randy Moss, Barry Sanders, Dan Marino, or J.J. Watt enjoy their heroes less because they don’t have the jewelry? Doubtful. It’s more likely that fans will wax poetic about how they got to watch these legends play.

In many cases, even average players and coaches on perennially losing franchises become local heroes in their communities. Fans fall in love with players they feel a connection with irrespective of the number of titles those athletes bring home. This is why long suffering fanbases of ringless teams often have the most loyal and devoted followers; it’s more about the journey than the destination.

Quantifying Fan Priorities

There’s actually pretty strong empirical evidence that championships are not the most important thing to fans. From 2003-2016, ESPN ran a series called Ultimate Standings (insert hyperlink ESPN The Magazine’s 2016 Ultimate Standings). They surveyed fans across all four major North American sports to come up with a formula for determining which teams reward their fans the most. The responses were whittled down into seven broad categories, weighted by importance:

Fan relations – 27%
Money spent per win – 27%
Players – 15%
Ownership – 13%
Stadium experience – 12%
Championships – 4%
Coaching – 3%

Well look at that! Championships are way down the list of things that fans consider important. Teams that make a genuine effort to connect to their communities engender loyal fans regardless of on-field results. Regular season wins matter but only if fans aren’t being gouged in the process; less frequent winning is acceptable if being a diehard fan is affordable for the average Joe. Players are judged by their effort and likability more than their performance. Having a solid ownership situation and a fun stadium to attend are also several times more important than past or potential championships.

Does this post resonate with you? What are your favorite memories as a sports fan? Would you trade those memories for a championship? Let me know in the comments.

{ 1 comment }

Resting Starters

Adam Steele is back again, this time with a look at teams resting their starters over the years. Bless him.


Over the past few years I’ve been documenting the historical instances of teams resting their starters in late season games. I like to remove such games when comparing teams since even a single upside down result can warp a club’s statistical profile (especially since these meaningless games disproportionately affect the best teams in a given season). Now that the 2021 regular season is complete, I figured I might as well share this database with FP readers in hopes that some of you might find it useful or interesting. [continue reading…]

{ 0 comments }

Jonathan Taylor had a season for the ages. Here are the top 10 yards per carry seasons by a running back with at least 300 carries:

 
Games Rushing
Rk Player Age Draft Tm Lg Year
G GS Att Yds Y/A TD Y/G
1 Jonathan Taylor 22 2-41 IND NFL 2021 17 17 332 1811 5.45 18 106.5
2 Adrian Peterson 27 1-7 MIN NFL 2012 16 16 348 2097 6.03 12 131.1
3 Chris Johnson 24 1-24 TEN NFL 2009 16 16 358 2006 5.60 14 125.4
4 Frank Gore 23 3-65 SFO NFL 2006 16 16 312 1695 5.43 8 105.9
5 Barry Sanders* 29 1-3 DET NFL 1997 16 16 335 2053 6.13 11 128.3
6 Barry Sanders* 26 1-3 DET NFL 1994 16 16 331 1883 5.69 7 117.7
7 Eric Dickerson* 24 1-2 RAM NFL 1984 16 16 379 2105 5.55 14 131.6
8 Walter Payton* 23 1-4 CHI NFL 1977 14 14 339 1852 5.46 14 132.3
9 O.J. Simpson* 28 1-1 BUF NFL 1975 14 14 329 1817 5.52 16 129.8
10 O.J. Simpson* 26 1-1 BUF NFL 1973 14 14 332 2003 6.03 12 143.1


He joined Jim Brown, Jim Taylor, O.J. Simpson, Walter Payton, and Clinton Portis as the only players to average 100 rushing yards and 1 rushing TD per game while having a YPC average of at least 5.4. But perhaps most remarkably, he won the rushing crown by over 500 yards. If that sounds like a lot to you, it’s because it is. The last time a player run the rushing crown by such a large margin was Simpson back in his record-breaking 2,000 yard 1973 season. [continue reading…]

{ 0 comments }

The penultimate week of the season was an odd one from a statistical standpoint. QBR and PFF mostly agreed (for once), but some of the boxscores straight up lied to us about how well quarterbacks played. We saw 45 touchdown passes and 32 QB turnovers, and that’s standard fare for a late season week in today’s NFL. However, according to PFF graders, quarterbacks registered 36 big time throws and a whopping 55 turnover worthy plays!

Let’s look at the week 17 rankings then take a closer look at some of these misleading statlines: [continue reading…]

{ 0 comments }

Pick a QB, any QB: there are no right answers.

The 2018 NFL Draft was supposed to change the landscape of the NFL at the quarterback position. Maybe not right away, of course, but in a few years — say, 2021? — the five quarterbacks selected in the first round of the 2018 NFL Draft would be the stars of the day. Instead, Josh Rosen flamed out immediately, Sam Darnold proved to be underwhelming under three different coaches, and Baker Mayfield’s stock fell dramatically in his fourth year. Even Lamar Jackson, the 2019 AP MVP, has fallen off; after a notable dropoff in play from 2019 to 2020, he fell further in an injury-plagued 2021. At this point, only Josh Allen is an unimpeachable franchise quarterback, but even he has seen a significant decline in passing efficiency this season.

All told, the 2018 first round quarterbacks as a group have been decidedly below average as passers this season, with three of the four starters (excluding Rosen) being in the bottom five of the NFL in interception rate.

This made me curious: which draft classes have been the most productive in 2021? With 17 weeks in the books — a traditional NFL regular season — here’s what I did. [continue reading…]

{ 0 comments }

I’m short on time right now so this week’s QB rankings will be presented without commentary. [continue reading…]

{ 0 comments }