≡ Menu

The most dominant win of week 9 came from…. Tulsa? Entering the week, Memphis was 5-2, with only road losses against ranked teams in Memphis and Navy. Memphis ranked 38th in the SRS last week, and was a 6-point favorite at home against Tulsa. But the Golden Hurricane broke open the game in the second half, scoring the final 24 points en route to a 59-30 victory. Running back James Flanders had 33 carries for 249 yards and 5 touchdowns, including scores of 52 and 48 yards.

In slightly more relevant week 9 news, there was some B12 on B12 crime this weekend, as the last two remaining teams in the conference went down.  Oklahoma State had the 2nd best SRS performance of the week, winning by 17 against previously unbeaten West Virginia. Texas was a bit less impressive, but still had the third best B12 performance of the week in a 35-34 home victory against Baylor.

But perhaps the most notable performance of the week came from Auburn, as the Tigers went on the road and scored 13 fourth quarter points to beat Ole Miss in Oxford, 40-29.  Auburn now seems like a legitimate candidate to beat Alabama, or at least give the Tide a competitive game in the Iron Bowl.

Below are the single-game SRS results from this weekend. As always, thanks to Peter R. Wolfe for providing the game scores. [continue reading…]

{ 1 comment }

Week 8, 2016: Gameday Thread

It’s time to fire up the gameday thread for another week.

{ 32 comments }

Most Plays Without Scoring a Touchdown

One of my favorite boxscores comes from a Steelers-Texans game in 2002. The Jets played at 4:15 that day, and I was living in Pennsylvania at the time, so I got to watch that game in its entirety. And the game was baffling on every level.

The expansion Texans had just three first downs the entire game. Three! David Carr completed 3 of 10 passes for 33 yards, with all three going to tight end Billy Miller. He was sacked four times, so Houston had 10 net passing yards on 14 dropbacks.

The Texans weren’t much better on the ground, running 26 times for 37 yards. That’s 47 total yards of offense with no touchdowns! In an entire game! And when you hear that the final score was 24-6, one would have to assume that Houston lost. But the didn’t. They won! They won 24-6!! In a game where they had 47 yards of offense and no touchdowns! That remains the fewest yards ever gained by a team in a winning effort. Steelers linebacker Joey Porter said it best:

Hold a team to under 50 yards offense, you’d think you’d have a chance to win at least….To get blown out when that happens, it’s tough.

Houston, of course, scored three defensive touchdowns, including two by former Jet Aaron Glenn. But what made watching the game even more confusing was that the Pittsburgh was pretty productive on offense, with 422 yards. Then again, the Steelers also had 15 drives and a whopping 95 plays, thanks due Houston recording eight 3-and-outs.

So why am I bringing that game up now? After watching the crazy Seahawks/Cardinals game last week, I was stunned by how Arizona was somehow kept out of the end zone all night. The Cardinals ran a whopping 90 plays, but the game ended in a 6-6 tie.

So I ran the numbers, and guess what? The only time in NFL history that a team ran more plays and failed to score a touchdown was Pittsburgh in that game against Houston.

The table below shows every game in NFL history where a team had 80 plays and zero offensive touchdowns: [continue reading…]

{ 4 comments }

Joe Flacco’s Career, My Graphic Novel

My favorite measure of quarterback play is Adjusted Net Yards per Attempt. For new readers, ANY/A is simply yards per attempt, but it includes sacks (both in the denominator and with those yards lost deducted from the numerator) and adjustments for touchdowns (20-yard bonus) and interceptions (45-yard penalty).

I am going to use a modified version of that formula today, by basing my formula around yards per dropback rather than yards per attempt. The only difference? Spikes are discarded, scrambles (and yards gained on scrambles) are included, but those are both improvements to the formula.

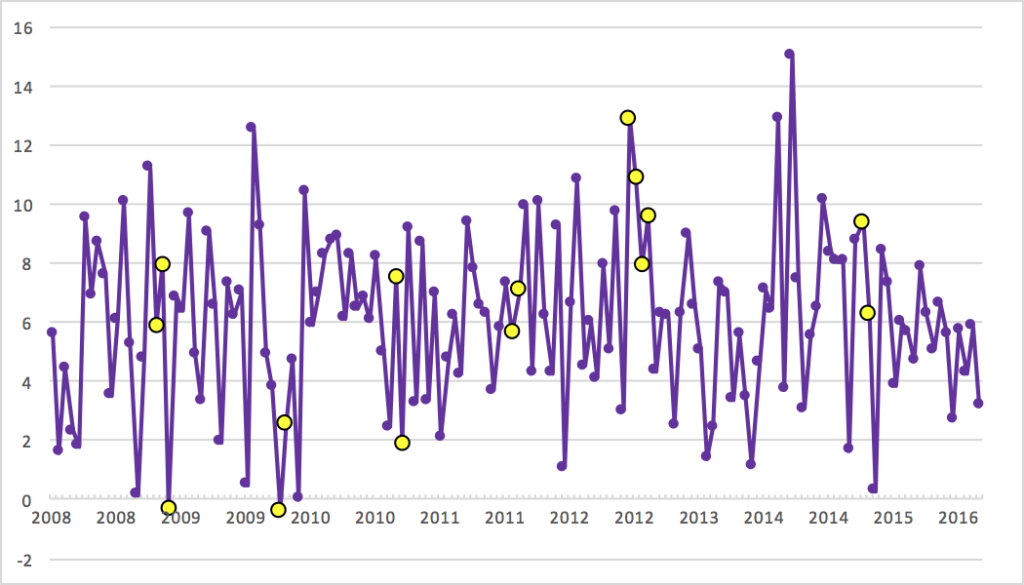
With that said, here is Joe Flacco‘s modified ANY/A average in every game of his career, plotted from his first game in week 1 of 2008 through week 7 of 2016.  I have made the data points that represent playoff games larger and in yellow.  The four dots next to each and relatively high on the graph represent, of course, his Super Bowl run in 2012.

flacco [continue reading…]

{ 9 comments }

538: Hue Jackson’s Browns Are 0-7

Today at 538: What Does An 0-7 Start Mean For An NFL Coach?

The Browns hired Hue Jackson to lead the team’s latest rebuilding effort in a move that was regarded as one of the best coaching hires of the offseason. In an offseason in which the Browns also brought in Paul DePodesta as chief strategy officer to turn the franchise around, it seemed like Cleveland had its coach of the future. But Jackson is now just the 20th coach since the AFL-NFL merger in 1970 to fail to win a game in his team’s first seven contests.

You can read the full article here.

{ 2 comments }

In week 1, the Chargers lost to the Chiefs despite a Game Script of +10.3. San Diego led 21-3 at halftime and 24-3 in the third quarter, but the Chiefs ultimately won in overtime.

It’s pretty unusal to lose with a +10 Game Script, or stated another way, it’s pretty unusual to win with a -10 Game Script. But that’s exactly what San Diego did in week seven, beating Atlanta with a Game Script of -10.2. The Chargers trailed 27-10 in the first half, but won in overtime, 33-30. The Chargers still had an element of balance in the game — Melvin Gordon had 22 carries for 68 yards and two touchdowns — while the Falcons were done in by the team’s last three drives ending on an interception, a missed field goal, and a turnover on downs.

Below are the week seven Game Scripts data. As is customary around these parts, I’ve lowlighted the Seahawks/Cardinals game in blue as a result of their tie (you can move your cursor over that row to see it more clearly, not that I know why you would want to). [continue reading…]

{ 7 comments }

Adam Steele is back for another guest post. You can view all of Adam’s posts here. As always, we thank him for contributing.


Previously, I introduced my new metric — Adjusted Points Per Drive — for measuring team offense. I thought it would be fun to apply the same methodology to quarterbacks, which I what I’m doing today. I highly encourage you to go back and read the previous post if you haven’t already, because I don’t want to clutter today’s post by repeating all of the calculation details.

Unfortunately, I don’t have drive stats for individual games, so there’s going to be some approximation here. To calculate a quarterback’s career Adjusted Points Per Drive (AjPPD), I simply take his team’s AjPPD from each of his playing seasons and weight those seasons by games started. This will give us a measure of a quarterback’s scoring efficiency, but it doesn’t account for volume or longevity. That’s where Adjusted Offensive Points (AjPts) comes in handy.

I assign each QB a portion of his teams’ Adjusted Points, then compare that to league average to calculate Points Over Average (POA). The formula for calculating a given season’s POA = (Tm AjPts – 315) * (GS / 16). The 315 figure is derived from multiplying my normalized baselines of 1.75 AjPPD by 180 drives per year, meaning the average team scores 315 Adjusted Points per season.

I’ll use Ben Roethlisberger’s 2015 season as an example: Pittsburgh scored 400 Adjusted Points and Ben started 11 games, so his 2015 campaign is worth (400 – 315) * (11 / 16) = 30 POA. Do this for every season and we have Career POA, which is the primary metric I’ll be using here. However, some people prefer to rank quarterbacks based on their peak years rather than their entire career, so I added the “Peak” column which is the sum of each quarterback’s three best POA seasons.

This study includes all QB’s who started their first game in 1997 or later, and made at least 40 starts between 1997 and 2015 (partial numbers from 2016 are not included). These criteria leaves us with 56 quarterbacks. Before we dig into the results, it’s worth noting that the correlation between Career POA and ANY/A+ is a healthy 0.92. We all know that the NFL is a passing league, but drive efficiency is even more dominated by the passing game than I thought. According to r2, 85% of the variance in Adjusted Points Per Drive is explained by a basic measure of passing efficiency. That doesn’t leave much room for the running game to have an impact. In fact, I’ll go as far to say that rushing efficiency has no appreciable impact on scoring for the majority of teams. That’s not to say running the ball is useless; offenses must run occasionally to keep the defense honest, and running comes in handy for converting short yardage and bleeding the clock. But, to quote Ron Jaworski, “Points come out of the passing game!”

Time for the rankings… [continue reading…]

{ 8 comments }

538: There Are No Great Teams This Year

Today, at 538: a look at how there are no great teams in the NFL this year.

The opening week of this NFL season featured a record number of close games that provided more than a hint of things to come. Because after Minnesota’s loss on Sunday to Philadelphia, there are no remaining undefeated teams. For reference, this time last year, there were five undefeated teams.

Sharon Katz at ESPN Analytics wrote Monday that every NFL team is flawed. Using Expected Points Added as her preferred measure of offensive and defensive efficiency, she showed that no team is excelling on both sides of the ball this season.

You can read the full article here.

{ 3 comments }

Week Eight (2016) College Football SRS Ratings

Last week, Michigan, Alabama, and Ohio State were far ahead of the pack according to the SRS. The top 6 remains unchanged this week other than Clemson and Louisville switching spots. That might be surprising given that Ohio State lost in Happy Valley, but Penn State now ranks 22nd in the SRS (they ranked 34th last week) and the Buckeyes had a large lead on #4 Clemson last week. Ohio State gets a 51.0 for losing at Penn State, but Clemson had a 56.1 last week for a home win over N.C. State.

The three big wins of the week came from Auburn, Louisville, and Alabama. At this rate, the Crimson Tide look ridiculous: Alabama’s worst game of the year was a 59.7, scored in a 5-point road win against Ole Miss. Two other games (34-6 over Kentucky, 48-0 over Kent State) had similar scores. But against the three teams Alabama has faced with an SRS of at least 50, the Ride have won by a combined 134-30 (USC, Tennessee, A&M).

But after Auburn’s destruction of Arkansas this weekend, there’s at least reason to think the Iron Bowl should be interesting. On Saturday, the Tigers rushed for 544 yards and 7 touchdowns on 56 carries — that is insane. In fact, it’s the most by any SEC team in a regular season game since at least 2000: it’s also one less yard than the famed 2013 Tigers had in the SEC Championship Game against Missouri.

As for Louisville? Well, they obliterated that NC State team that nearly (and should have) beaten Clemson last week. Below are the single-game week 8 SRS ratings:
[continue reading…]

{ 1 comment }

Week 7, 2016: Gameday Thread

Let’s fire it up again this week!

{ 32 comments }

2016 ANY/A Update

Matt Ryan is having a career year, in a not disimilar way from what Carson Palmer did last season. Thanks to a superstar receiver and an offensive coaching staff that is drawing rave reviews, Ryan is having the sort of once-in-a-career year expected from a top-3 pick.  In fact, Ryan is even ahead of Palmer’s pace from last year:

Passing
Rk Age Year Lg Tm G W L Cmp Att Cmp% Yds TD Int Rate Sk Yds ANY/A
1 Matt Ryan 31 2016 NFL ATL 6 4 2 143 210 68.10 2075 15 3 117.9 15 98 9.52
2 Carson Palmer 35 2015 NFL CRD 6 4 2 125 193 64.77 1737 14 5 106.9 8 42 8.71

The Falcons ranked 17th in ANY/A last year, and 1st this year; Atlanta’s offensive ANY/A has jumped by 3.34 ANY/A, the biggest leap in the league. You might think the Jets — 14th in ANY/A last year, 32nd this year — would have the biggest decline, but New York’s dip is only the second worst. That’s because Palmer, who had a very lofty perch from which to fall, has been far below-average this season: [continue reading…]

{ 4 comments }

Today at 538: A look at draft value by team, based on the number of snaps taken by each player:

Based on the draft value calculator I created to measure the approximate average production level provided by each draft pick, we can convert each draft slot into a draft value (undrafted players receive a draft value of zero). Then, with the help of Pro-Football-Reference.com, I was able to calculate the snap-weighted draft value of each team’s offense and defense. For example, Palmer, as the first overall pick in the draft, has a draft value of 34.6. And since Palmer has taken 77 percent of all snaps for the Cardinals this season and he is one of 11 players on the offense, that means that 7 percent (i.e., 77 percent divided by 11) of Arizona’s snap-weighted offensive draft value is driven by Palmer’s 34.6 rating. This isn’t a perfect proxy for the production we can expect from a top pick — Palmer is on the back end of his career, when we expect even the best quarterbacks to be in decline — but it’s a fun way to look at the rosters.

Perform this calculation for each player on each team through the first six weeks of the 2016 NFL season and we can calculate the average draft value of each offense and defense, with all snap data coming from Pro-Football-Reference.com. Arizona has the best-pedigreed offense in the NFL; the Seahawks’ offense, on the other hand, has the lowest average draft value.

You can read the full article here.

{ 0 comments }

Let’s start with a piece of good news: I’ve created a 2016 Game Scripts page! On the top right of every page, there is a link to the 2016 Game Scripts, along with a dropdown option to view prior seasons.  Here’s a screenshot:

capture

So that’s the good news. The bad news is the Jets. In other news, Houston had the second-biggest comeback of the season as measured by Game Script: the Texans beat the Colts with a Game Script of -6.9. In many ways, this was more shocking than what the Chiefs did to the Chargers in week one (-10.3). That game was a 7-point contest with three minutes left; on Sunday Night Football, the Colts led by 14 with three minutes left, yet still managed to lose the game.

Let’s get to the Week 6 Game Scripts: [continue reading…]

{ 1 comment }

Adam Steele is back for another guest post. You can view all of Adam’s posts here. As always, we thank him for contributing.


Adjusted Points Per Drive

I love drive stats. There’s no better method, in my opinion, of measuring the performance of offensive and defensive units. However, raw points per drive has a couple of glaring flaws – it doesn’t account for field position or adjust for league offensive efficiency. In this post, I am going to correct those issues and rank every offense in the drive stat era (1997-2015). [1]Drive Stats provided by Jim Armstrong of Football Outsiders, and expected points data courtesy of Tom McDermott. To accomplish this, I created a simple metric called Adjusted Points Per Drive. Here’s how it’s calculated:

Step 1: Calculate total offensive points for each team. OffPts = PassTD * 7 + RushTD * 7 + FGAtt * (LgFGM / LgFGA). I chose to use the average value of a field goal attempt rather than made field goals, as I want to minimize the effect of special teams. In 2015, for example, the average FGA was worth 2.535 points, so I plug that number into each team’s number of attempts.

Step 2: Calculate points per drive (PPD). All drives ending with a kneel down are discarded. PPD = OffPts / Drives.

Step 3: Adjust for starting field position. The expected points value of each yard line is a bit noisy, so I smoothed it out into a simple linear formula. Every yard is worth 0.05 expected points, and PPD is normalized based on an average starting field position at the 30 yard line. I call this field position adjusted points per drive, or fPPD for short. fPPD = PPD – ((AvgFP – 30) *0.05). With this step, we can accurately compare the scoring production of all teams within a given season.

Step 4: Adjust for league scoring efficiency. I normalize each season’s fPPD to a baseline of 1.75 to calculate adjusted points per drive. At the team level, AjPPD = fPPD / LgfPPD * 1.75. Now, at last, we can compare the scoring production of every team since 1997. To make AjPPD more intuitive, I also translate it into adjusted offensive points (AjPts) using a baseline of 180 drives per team season. AjPts = AjPPD * 180. [continue reading…]

References

References
1 Drive Stats provided by Jim Armstrong of Football Outsiders, and expected points data courtesy of Tom McDermott.
{ 22 comments }

Strength of Schedule Data, Through Week 6 and Rest of Year

The Jets have had a brutal strength of schedule so far. Based on Pro-Football-Reference.com’s SRS ratings, and adjusted for home field, the Jets have had the toughest schedule this year, with home game against the Bengals, and Seahawks, and road games against the Bills, Chiefs, Steelers, and Cardinals.

The good news? For the rest of the season, the Jets have the 21st toughest schedule in the league, and no team has an easier dropoff in schedule than New York. This was predictable — in fact, I wrote just that for 538 in the offseason.

On the flip side, we have the Seahawks. Here’s how to read the table below, using Seattle. They are ranked 32nd, because no team’s schedule gets more difficult. Seattle’s through week 6 SOS — the TW6 SOS column — is -3.06, meaning its average opponent was about three points worse than average. That’s been the 31st toughest (or 2nd easiest) slate in the league. Meanwhile, Seattle’s rest of year SOS — marked as ROY SOS — is +2.13, the 3rd toughest left in football. That’s a difference of -5.19 (i.e., negative is bad, because the schedule is now harder). [continue reading…]

{ 3 comments }

538: Buffalo, Washington, Are Making Running Great Again

The Bills are on one of the craziest running streaks in recent history.  Washington? Well, here is what I wrote in my Game Scripts recaps after weeks 1 and 2:

Washington finished with a Game Script of -5.8, but even that doesn’t typically justify a 78% pass ratio. That was the most pass-heavy attack in the week (both without adjusting for Game Script and after adjusting), and is a sign of the lack of faith in the team’s ground game. Matt Jones rushed 7 times for 24 yards, Chris Thompson had 4 for 23, and the team’s only other run was a scramble by Cousins for 8 yards on 4th-and-10.

On the pass-heavy side, Washington was at it again. In a game where Washington led for much of the second half before ultimately losing to Dallas, Kirk Cousins had 48 dropbacks (50, if you include the two scrambles), while the team rushed just 17 times (15, if you exclude the two scrambles). Matt Jones wasn’t bad against Dallas, and Cousins wasn’t very good, so it will be interesting to see if anything changes in week 3 against the Giants.

Since then? Well, both teams have seen significant improvements in both quantity and quality on the ground. And now they are are on four game winning streaks after 0-2 starts.  They were the subject of my 538 recap this week:

But it wasn’t just the 0-2 record on the field; the teams looked ugly off the field, too. After the team’s second loss, Buffalo fired offensive coordinator Greg Roman, a move widely viewed as an attempt by head coach Rex Ryan to make Roman into a scapegoat for the team’s problems. In Washington, rumors swirled that the locker room was holding quarterback Kirk Cousins responsible — and that caused head coach Jay Gruden to issue the dreaded vote of confidence for his starter.

Now? Both teams are riding four-game winning streaks and look like playoff contenders. Before this year, only 18 teams in NFL history1 had started a season 0-2 and then won four straight games. Over the past 20 years, this season’s Buffalo and Washington squads are only the fourth and fifth teams to do so. So how did they do it? Although the NFL continues to shift toward the passing game, both teams have zagged and rebounded thanks to their ground game.

You can read the full article here.

{ 3 comments }

Week Seven (2016) College Football SRS Ratings

Last week, Michigan jumped to number one in the SRS after demolishing Rutgers. The Wolverines, on bye, stayed at number one this week, but the Crimson Tide are coming after them. The top team of week 7 was Alabama, who destroyed a good conference opponent in Tennessee.  Here’s what you need to know: the Crimson Tide….

  • outgained the Vols, 613-201;
  • outrushed the Vols, 438-32, the most rushing yards by Alabama in 30 years; and
  • scored on both a punt return and an interception return, winning 49-7.

Given that the Volunteers have an SRS rating of 50.4, and that the game was in Tennessee, a 39-point road victory translates to an SRS rating of 83.4; no other team in week 7 cracked 70.

The second best win came from West Virginia; at 5-0 and now #16 in the SRS, it may be time to start watching the Mountaineers more closely.  WVU’s toughest opponents to date have been BYU and Kansas State, and both were close wins.  But the Big 12’s best hope for national relevance is for both West Virginia and Baylor to enter their December 3rd matchup undefeated. Unlikely, of course, but that’s at least a path.

Oh, and the Western Michigan hype machine should keep rolling.  The Broncos destroyed Akron, which may not sound that impressive, but for reference: WMU won 41-0 in Akron, while Wisconsin won 54-10 at home against the Zips. Running back Jarvion Franklin had 33 carries for 281 yards in the win. [continue reading…]

{ 1 comment }

Week 6, 2016: Gameday Thread

Last Sunday, I posted a gameday reaction thread, and we had over 50 comments. Let’s try it again this week: Write about whatever you want — emotional reactions, interesting observations, statistical questions, whatever — in the comments below. I’ll do my best to respond to each of them.

{ 34 comments }

The Green Bay Packers run defense has been insanely dominant this season, allowing just 1.99 yards per carry and 157 rushing yards through four games. Since 1940, only one team — the 1995 49ers — have allowed fewer rushing yards through four games. And Green Bay is the first team since 1953 to allow less than two yards per carry through four games!

Making this all the more remarkable is that the Packers run defense was bad last season, ranking in the bottom half of the league in both rushing yards and rushing touchdowns, and 29th in yards per carry. From a snap count perspective, LB Nick Perry (76%), LB Jake Ryan (73%), DT Mike Daniels (64%), and LB Blake Martinez (52%) are the only front seven defenders to have appeared in at least 50% of the team’s plays! In other words, it’s not like guys like Clay Matthews (47%) and Julius Peppers (44%) are having monster seasons.

Frankly, I haven’t watched enough of the Packers defense to weigh in on what’s going on — I don’t know if Perry or Ryan is having a breakout season.  So instead, here’s what I’ll do.  The graph below shows the percentage of running plays against the Packers that have gone for X yards, and also against the rest of the NFL.  Here’s the key: the Packers have been incredible at dropping opposing carries for a loss (28%) compared to the rest of the NFL (13%).  Meanwhile, 11% of all runs against the other 31 teams have gone for at least 10+ yards, compared to just two percent of all runs for the Packers (with a long of just 14 yards).

packers-run-d

So what’s the takeaway? Does this graph make you think the Packers’ run defense success is more or less fluky (given that there’s always a large amount of flukiness present in such an outlier result)?

{ 4 comments }

I appeared on Chris Harris’s podcast today, talking yards per carry and game scripts. You can listen to it here.

{ 0 comments }

Today at 538: A look at season long Game Scripts and Pass Identity data, through week 5:

As we enter mid-October, the identity of each NFL team’s offense has begun to emerge. Some teams, like the San Francisco 49ers, want to run the ball no matter the situation. Others, like the Indianapolis Colts, are pass-happy even when most other teams wouldn’t be. How do we know what teams’ preferred style is? It’s not as easy as looking at their basic stats: Those are shaped by factors outside of their control, like being forced to pass more when trailing. So I’ve created a way to adjust for external forces and classify teams based on how they choose to play offense regardless of the numbers on the scoreboard.

You can read the full article, and see the cool chart and table, here.

{ 5 comments }

Week 5, 2016 Game Scripts: The 49ers Keep On Running

Previously:

There were no big comebacks this week, but a few games where the Game Script exceeded the final margin. The Cowboys blew out the Bengals, and led 28-0 entering the fourth quarter; the game ended, 28-14.

With three minutes to go in the Broncos/Falcons game, Atlanta led 23-6. The Falcons were in control for most of the game, leading 20-3 mid-way through the third quarter. Denver scored ten points in the final three minutes, to give a not-as-close-as-it-looked final score of 23-16.

The Packers led 23-9 with a few minutes left in the game, before the Giants scored a touchdown. New York trailed by 8 points at times later in the game, but last trailed by 7 points with the ball with eight minutes left in the second quarter.

Below are the Week 5 Game Scripts data: [continue reading…]

{ 0 comments }

538: Cowboys, Powered by Rookies, Are Back On Top

Today at 538: a look at how Ezekiel Elliott and Dak Prescott are powering the Cowboys offense.

The Cowboys’ strong running game has made life easy on the rest of the team: Dallas ranks second in the NFL in time of possession, and the defense is facing just 9.6 drives per game, the fewest in the NFL. That makes life simple for the rookie quarterback, too. Dak Prescott has attempted just 34 passes while trailing in the second half of games this year, and none when trailing by more than four points.

You can read the full article here.

{ 1 comment }

Last week, I introduced the first set of the SRS ratings. This week, the Wolverines jumped from #2 to #1, on the basis of one of the most lopsided games between conference foes in recent college football history.

  • Michigan had 23 first downs; Rutgers had 2.
  • Michigan gained 600 yards; Rutgers had 39.
  • Michigan scored 11 touchdowns, en route to a 78-0 victory.

Rutgers is terrible: that 2-4 record is thanks to wins over Howard and New Mexico: that’s an FCS school and team that’s ranked 107th in the SRS.  But still, 78-0 is 78-0.  Even acknowledging that Rutgers is terrible, and adjusting the margin of victory (a 78-point road win is akin to an 81-point win; the average of 24 and 81 is 52.5), Michigan still scored the most impressive win of week six.

In other news:

  • We’ve known for a couple of weeks that Washington was for real, and Oregon was in the middle of a disaster season. That came to a head on Saturday, with the Ducks losing, at home, 70-21.
  • Under Justin Fuente, is Virginia Tech back? The Hokies lost ugly to Tennessee, but otherwise have been great this year:  winning 49-0 over Boston College (#73 in the SRS), 54-17 over East Carolina (#70), and now 34-3 on the road against North Carolina (#36).
  • The other 75+ point SRS game came from Washington State, in a 42-16 blowout over Stanford. The Cardinal looked fine through three weeks, beginning the year 3-0 with wins over Kansas State, USC, and UCLA, en route to a #7 ranking. Since then? Stanford has lost back-to-back games to the P12 teams from Washington, by a combined 86-22.

Below are the week 6 single-game SRS ratings: [continue reading…]

{ 3 comments }

I appeared on The Bill Barnwell Show today to talk about the Jets defense, Joe Flacco, and Sam Bradford. Believe it or not, I wasn’t saying a lot of positive things on today’s show.

You can listen to it here.

{ 1 comment }

The Minnesota Vikings are the last undefeated and untied [1]Note: Throughout this post, I am using “undefeated” or “unbeaten” to mean no losses and no ties. team in the NFL. Entering week 5, there were three undefeated teams, but the Broncos (Atlanta) and Eagles (Detroit) both lost on Sunday.

From 1970 to 2015, there were 43 times when there was one team standing as the lone unbeaten team remaining. [2]Obviously that means there were four seasons where that wasn’t the case. In 2014, the Bengals and Cardinals were the last two unbeaten teams, and lost in week 5. In 1990, the Giants and 49ers … Continue reading How long did those teams remain undefeated? And how did their seasons ultimately end? Take a look: [continue reading…]

References

References
1 Note: Throughout this post, I am using “undefeated” or “unbeaten” to mean no losses and no ties.
2 Obviously that means there were four seasons where that wasn’t the case. In 2014, the Bengals and Cardinals were the last two unbeaten teams, and lost in week 5. In 1990, the Giants and 49ers both went 10-0, but lost in their 11th game before their head-to-head matchup. And in 1970, the Broncos, Lions, and Rams entered week 4 undefeated, but all left week 4 with a loss.
{ 6 comments }

Week 5, 2016: Gameday Thread

Wanted to try something different today, so let’s see how it goes. I will be posting gameday reactions today in the comments here, and I invite you guys to do the same. Write about whatever you want — emotional reactions, interesting observations, statistical questions, whatever — in the comments below. I’ll do my best to respond to each of them.

{ 56 comments }

The 2010 Draft Class was not very good when it came to quarterbacks.  Take a look:

 
Rnd Pick Tm Player Pos Age To AP1 PB St CarAV DrAV G Cmp Att
Yds TD Int
1 1 STL Sam Bradford QB 22 2016 0 0 4 33 25 66 1444 2387 15509 82 52
3 85 CLE Colt McCoy QB 24 2015 0 0 2 12 10 34 508 842 5586 26 23
5 155 ARI John Skelton QB 22 2012 0 0 0 4 4 20 320 602 3707 15 25
2 48 CAR Jimmy Clausen QB 23 2015 0 0 1 3 0 22 255 472 2520 7 14
1 25 DEN Tim Tebow QB 23 2012 0 0 1 12 11 35 173 361 2422 17 9
6 176 TEN Rusty Smith QB 23 2012 0 0 0 1 1 3 23 45 234 0 4
4 122 PHI Mike Kafka QB 23 2011 0 0 0 0 0 4 11 16 107 0 2
6 204 CAR Tony Pike QB 24 2010 0 0 0 0 0 1 6 12 47 0 0
7 209 BUF Levi Brown QB 23 2010 0 0 0 0 0 1 2 3 24 0 1
5 168 SDG Jonathan Crompton QB 23 0 0 0
6 181 CHI Dan LeFevour QB 23 0 0 0
7 239 NOR Sean Canfield QB 24 0 0 0
7 250 NWE Zac Robinson QB 24 2012 0 0 0 0

So far this year, Bradford is the only quarterback from the 2010 Draft Class to throw a pass, tho McCoy is currently Washington’s backup.  The graph below shows the amount of passes so far this year in 2016 thrown by quarterbacks from each draft class: [continue reading…]

{ 13 comments }

538: Derek Carr, the NFL’s Newest Gunslinger

Today at 538: A look at Derek Carr, and why he’s the NFL’s newest gunslinger.

This season, Carr has been great in the fourth quarter, completing 27 of 45 passes for 368 yards (no sacks), with five touchdowns and just one interception. Carr’s Total Quarterback Rating (QBR) of 87.7 in the fourth quarter is second only to Ben Roethlisberger’s, 96.2. Carr is a legitimate offensive player of the year candidate on a resurgent Raiders team, and his strong fourth-quarter performance is one of the reasons.

But despite the game-winning drives and the success this year, Carr has taken his lumps late in games, too. Last season, he had a QBR of just 24.0 in the fourth quarter, the second-worst grade among the 33 qualifying quarterbacks (ahead of only Nick Foles). And this isn’t just a QBR issue — Carr also ranked second to last in fourth-quarter passer rating, at 67.5, again ahead of only Foles.

You can read the full article here.

{ 3 comments }

Guest Post: Centers and the Hall of Fame

Today’s guest post comes from one of the longest followers of this blog (and its predecessor), Richie Wohlers. Richie is 44-year-old accountant from Southern California who is a Dolphins fan despite never being to Florida. As always, we thank our guest posters for contributing.


Last time, I took a look at linebackers in the NFL Hall of Fame. Today, I am going to investigate centers and the Hall of Fame.

As before, I am just taking a look at post-merger players by using some objective factors to try to get a picture of what a typical HOFer looks like. Those factors are All-Pros, Pro Bowls, Weighted AV, Total AV, Super Bowl Appearances and Super Bowl wins). I am going to classify all players into a single position for simplicity. [continue reading…]

{ 23 comments }
Previous Posts