≡ Menu

If you know nothing else about a game other than the quarterback threw for over 300 yards, would you bet that the team won the game?

On one hand, passing yards is correlated with production: all else being equal, more yards are better than fewer yards. On the other hand, we know that Game Scripts call for teams with a lead to throw less frequently than teams that trail; for the same reason that “teams that run 30+ times usually win”, you might be suspect about the fortunes of a team that threw for 300 yards.

And what about historically? Has the league-wide winning percentage changed over time for when a quarterback throws for 300 yards? Great questions! Let’s get some answers. [continue reading…]

{ 0 comments }

Saints WR Michael Thomas had another dominant season in 2019.  He easily led the NFL in receiving yards with 1,725, and he also was responsible for 38.9% of all Saints receiving yards.  That was the largest percentage of a team’s receiving pie for any one player in 2019, followed by Bronco Courtland Sutton in a distant second place (32.7%), and Bears WR Allen Robinson (32.1%); only three other players (Buffalo’s John Brown, Cleveland’s Jarvis Landry, and Minnesota’s Stefon Diggs) topped 30%.

Regular readers know that I like to calculate something called the Concentration Index for passing offenses: it’s relatively simple to calculate, and it measures how concentrated a team’s passing offense is among a small or large number of players.  To calculate, you simple take each player’s receiving yards, divide that by his team’s total receiving yards, square that result, and then add that number for each player on the offense.  For the Saints, Thomas is at 38.9%; the square of that is 15.2%, so that’s the number we use.  Jared Cook was second on the team with 705 yards, or 15.9% of the team’s receiving yards; the square of that number is 2.5%.  Do this for every player, and the Saints have a total Concentration Index of 21.1%… which is highly concentrated. [continue reading…]

{ 0 comments }

True Receiving Yards with Postseason

In a recent post, I revisited True Receiving Yards. That articles covers the nuts and bolts of the metric, so I’m not going to discuss that again today. Instead, I’m taking my favorite version of the metric, TRYSoft, and adding postseason performance for single seasons. You will recall that TRY includes adjustments for both a team’s pass frequency relative to its peers and a year’s pass frequency relative to other years. For the playoffs, I dropped the team adjustment but kept the yearly adjustment. I can see arguments for using both (or neither), but this is what I landed on, so strap in.

The table below contains receiving seasons with a combined regular and postseason TRY greater than 750. Read in thus: In 1945, Jim Benton caught 45 passes for 1067 yards and 8 touchdowns in the regular season. That’s good for 1227 adjusted catch yards and a TRYSoft of 2384. [1]Yea, that’s a pretty huge adjustment. In the postseason, he caught an additional 9 passes for 125 yards and a score, giving him a postseason ACY of 145, adjusted up to 171 after the year modifier. His combined production, which I have simply dubbed X, comes to 2555.

I don’t feel like getting into a ton of observations today. Besides, the remarks from the regular FP readers tend to be more interesting anyway. I’ll just say this: Jerry Rice was good at football.

References

References
1 Yea, that’s a pretty huge adjustment.
{ 0 comments }

NFL Playoff Seedings Under The Proposed New System

The NFL is looking at adding a 7th team to the playoff field in each conference, which would represent a significant change in the current structure. Moving forward, only the #1 seed would have a bye. How would this chance things?

Wild Card Round

There would now be three games played here in each conference: as before, the 6 seed would travel to face the 3 seed, and the 5 seed would go on the road against the 4 seed. And the 1 seed would have a bye. But the 2 seed and 7 seed would now play each other, as opposed to both teams being off that week (with the 7 seed missing the playoffs).

My assumptions throughout this post are (1) home field advantage matters, and (2) the stronger seed is the better team, with the exception of 4 vs. 5. With 4-team divisions, the best team to not win its division — that is, often, the 2nd best team in the division with a very good division winner — is more often than not a better team than the worst division winner.

Let’s assume the 2 seed has a 65% chance of beating the 7 seed, the 3 seed has a 60% chance of winning, and the 4 seed has a 55% chance of winning.  In the Division Round, the 1 seed will face the weakest remaining seed, while  the strongest-seeded winner that won on Wild Card weekend would be home against the other remaining winner from Wild Card weekend.  I simulated 32,000 playoff seasons to see which matchups are most likely in the Division Round.

As it turns out, the 1 seed has at least a 15% chance of facing any of the 4-7 seeds, with the 7 seed being its most likely opponent (because the 7 seed always plays the 1 seed when it wins). The 2 seed is the overwhelming favorite to be the other host team in the Division Round, although now the 3 seed has a 1-in-5 chance to do so (currently, it has a 0-in-5 chance of hosting a Division Round game). And heck, even the 5 seed has an opportunity to host a Division Round game, if all three road teams win on Wild Card weekend. [continue reading…]

{ 0 comments }

NFL Playoff Seedings – A Monte Carlo Simulation

Let’s look at each round of the NFL playoffs,

Wild Card Round

There are two games played here in each conference: the 6 seed travels to on the road to face the 3 seed, and the 5 seed visits the 4 seed. The 1 and 2 seeds have byes.

My assumptions throughout this post are (1) home field advantage matters, and (2) the stronger seed is the better team, with the exception of 4 vs. 5. With 4-team divisions, the best team to not win its division — that is, often, the 2nd best team in the division with a very good division winner — is more often than not a better team than the worst division winner.

Still, home field advantage matters. So I am assuming that the 3 seed has a 60% chance of winning its game, while the 4 seed has a 55% chance of winning its game (this is lower than the general rule that the home team wins about 57% of games).

This means, after the wild card round, there’s a 100% chance that the 1 seed remains, a 100% chance that the 2 seed remains, a 60% chance that the 3 seed remains, a 55% chance that the 4 seed remains, a 45% chance that the 5 seed remains, and a 40% chance that the 6 seed remains. If you want to change these percentages, that’s very easy; more on that at the end of this post.

Division Round

Who will the 1 and 2 seeds face in the Division Round? The 1 seed has a 33% chance of facing the 4 seed, a 27% chance of facing the 5 seed, and a 40% chance of facing the 6 seed. This is because the 1 seed always plays the 6 seed when the 6 seed wins in the Wild Card round (40% chance), and faces the 4/5 winner 60% of the time. The 2 seed has a 60% chance of facing the 3 seed (when the 3 seed beats the 6 seed), a 22% chance of facing the 4 seed, and an 18% chance of facing the 5 seed.

So what will happen in the Division round?  Again, we need to come up with some probability; I took a stab at that below.  If you don’t like them, you can change them letter!
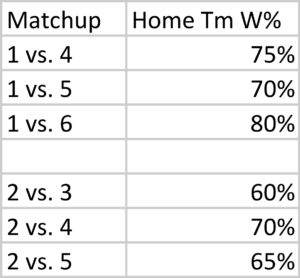
These seem reasonable to me; maybe you want to give the home team a bigger edge, but they’re close enough (and simple!) for our purposes.  So how likely is each seed to make the conference championship game using these numbers?

The 1 seed can make it by beating the 6 seed (40% chance that game happens, 80% chance of winning, therefore a 32% chance the 1 seed makes the Conference Championship Game by beating the 6 seed), the 5 seed (27%, 70%, 19%) or the 4 seed (33%, 75%, 25%): therefore, the 1 seed has a 76% chance of getting to host the title game.

The 2 seed can make it by beating the 5 seed (18% chance, 65% conditional win probability, 12% chance the 2 seed makes it by beating the 5 seed), the 4 seed (22%, 70%, 15%), or the 3 seed (60%, 60%, 36%), for a 63% chance.

You can do this calculation for all the seeds.  The 6 seed, for example, only has an 8% chance (40% chance in the Wild Card round, 20% chance in the Divisional Round) of getting to the CCG.  The 3 seed has a 24% chance, while the 4 and 5 seeds each have around a 14-15% chance.

In fact, the 5 seed has a slightly better chance of making it to the CCG than the 4 seed, because of the assumption that it is the better team.  This is offset, of course, by being on the road in the Wild Card round.

Conference Championship Game

With 6 teams in the playoff field, there are 30 possible combinations (6 x 5) for the conference champinoship game.  Of course, only half of those truly exist because home field automatically goes to the better seed.  And 4 of those 15 combinations are impossible — 1 can’t play 6 and 2 can’t play 3, since it would automatically play in the Division Round, while 3/6 and 4/5 can’t meat in the CCG since they meet in the Wild Card round.  The table below shows the chance of each combination happening, along with my projection of the likelihood that the home team wins.
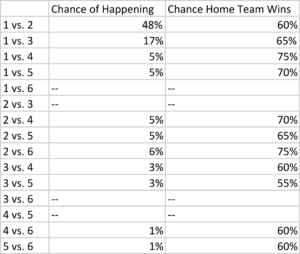
Again, if you disagree with any of these results, you will be able to change them! Just keep reading.

Conference Champion

If you perform all of the calculations using the assumptions in this post, you’ll see that there’s a roughly 48% chance the 1 seed wins the conference, a ~30% chance the 2 seed makes it to the Super Bowl, and the percentages drop to ~10%, 4-5%, 5-6%, and 2-3% for the 3, 4, 5, and 6 seeds.

Monte Carlo Simulation

One way to re-create the above is by performing a Monte Carlo simulationYou can download the Excel file that I created here. This file simulates 32,000 NFL postseasons with random results, weighted based on the percentage chance the home team has of winning each game.

Here’s how to read/use this sheet. On the Wild Card sheet, the pre-game win probabilities are in cells V11 and V12, which are highlighted in yellow. Let’s say you think the 5 seed in a given season is really good and/or the 4 seed is really weak; in that case, let’s change the home team win probability from 55% to 40%. Well, this still only shifts the Conference Championship odds (in Column S on the “ccg” sheet) a little bit; the 5 seed jumps from just over 5% to just over 7%, while the 4 seed drops to about 3.5%.

Let’s go to the “div” sheet. Let’s say you think the 1 seed is really strong, and should have a 90% chance of winning no matter its opponent in the Division Round. Even still, this only jumps its odds of winning the conference to about 57%.

What do you think?

{ 0 comments }

Air Yards and YAC By Position

Arizona running back David Johnson is one of the better receiving backs in the NFL, but he’s also the most unique. Most teams use their running back as a last resort on passing plays; on average, passes to running backs are right at the line of scrimmage.  But with Johnson, he’s actually thrown passes down the field, rather than just as a checkdown option.

The graph below shows each running back with 40+ targets.  The X-Axis shows the average number air yards on each reception by that running back; the Y-Axis shows the average number of yards gained after the catch.  Most running backs will be up (high YAC) and to the far left (low Air Yards) on this chart.  Johnson, however, is a bit of an outlier.  Arizona frequently lines him up in the slot, and even throws him the occasional deep pass.

The other notable outliers at running back are Austin Ekeler (10.2 YAC per reception) and Dalvin Cook (11.2 YAC per reception): [continue reading…]

{ 0 comments }

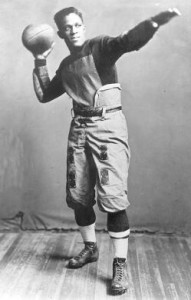
Fritz Pollard, the first African American coach and quarterback in the NFL.

Twelve years ago, I wrote a four part series detailing the history of the black quarterback.

Six years ago, I updated that article; today, a further update as the NFL just concluded its 100th season. And while for the last 52 of those seasons, at least one black quarterback was in the NFL, the roles and treatment of black quarterbacks have varied greatly over the last five decades.

The history of black quarterbacks in professional football is complicated. The New York Giants did not have a black quarterback throw a pass until 2007, when Anthony Wright became the first to do so; 10 years later, Geno Smith became the first and only black quarterback to start a game for the Giants. But as far back as 1920, Frederick Douglass “Fritz” Pollard was the tailback of the Akron Pros; a year later, he was promoted to player/coach, and became the first black head coach in NFL history. Pollard helped the Pros win the championship in the NFL’s inaugural season. [1]At the time, the NFL went by the name the American Professional Football Association. It was not known as the NFL until 1922. The Pros ran the single-wing, and Pollard was the player lined up behind the center who received the snaps. At the time the forward pass was practically outlawed, so Pollard barely resembles the modern quarterback outside of the fact that he threw a few touchdown passes during his career. [2]In addition to his NFL exploits, Pollard also achieved a great deal of fame for leading Brown to back-to-back road wins over the powerhouse schools of the time, Yale and Harvard, in 1916. He would … Continue reading And, of course, it was a time of significant discrimination: Pollard and end Bobby Marshall were the first two black players in professional football history.

As told by Sean Lahman, at least one African American played in the NFL in every year from 1920 to 1933, although Pollard was the only one resembling a quarterback. [3]It wasn’t just African Americans that had full access during this era: Jim Thorpe coached and starred in a team composed entirely of Native Americans called the Oorang Indians in 1922 and 1923. Beginning in 1934, that there was an informal ban on black athletes largely championed by Washington Redskins owner George Marshall. It wasn’t until 1946 that black players were re-admitted to the world of professional football, when UCLA’s Kenny Washington [4]Who occupied the same backfield with the Bruins as Jackie Robinson. and Woody Strode were signed by the Los Angeles Rams; in the AAFC, Bill Willis and Marion Motley were signed by Paul Brown’s Cleveland Browns that same season.
[continue reading…]

References

References
1 At the time, the NFL went by the name the American Professional Football Association. It was not known as the NFL until 1922.
2 In addition to his NFL exploits, Pollard also achieved a great deal of fame for leading Brown to back-to-back road wins over the powerhouse schools of the time, Yale and Harvard, in 1916. He would become the first African American to be named an All-American and the prior season, he lead Brown to the Rose Bowl.
3 It wasn’t just African Americans that had full access during this era: Jim Thorpe coached and starred in a team composed entirely of Native Americans called the Oorang Indians in 1922 and 1923.
4 Who occupied the same backfield with the Bruins as Jackie Robinson.
{ 2 comments }

Why Have Passer Ratings Become More Compressed?

Yesterday, I wrote that the range of passer ratings is getting smaller.  Today, let’s investigate why.  As you know, passer rating is made up of four variables: completion percentage, yards per attempt, touchdown rate, and interception rate.

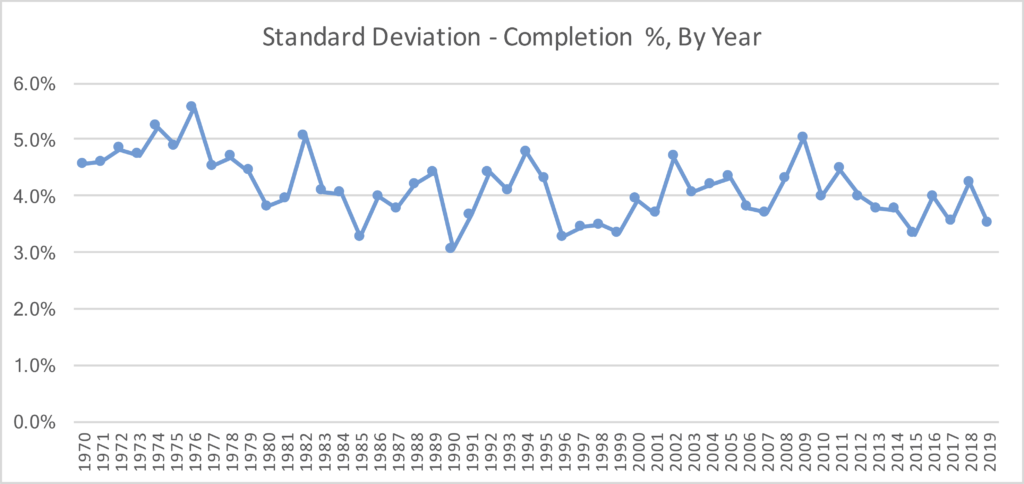
For each of the four variables, I calculated the standard deviation in that metric for all of the teams in the league in that season.  Last year, for example, the standard deviation in completion percentage was about 3.5%.  That’s on the low end historically, although not the absolute lowest mark.  But in general, it’s fair to say that the league-wide completion percentages are getting more compressed.  Last season, the Saints completed 72% of the team’s passes, and the Bengals were last at 58%. But in 1976, the Raiders were at 64%, while the Bills were at 41%.  That In 1994, the 49ers were a big outlier as they completed 70% of their passes at a time when two teams (Washington, Houston) completed just under 50% of their passes.

With a much higher floor now — the league average completion percentage was 58% in 1994, the same as what the 32nd-ranked Bengals did in 2019 — completion percentages as a whole are simply more compressed.

When it comes to yards per attempt, there isn’t much of a trend.  The variation was a bit higher in the ’70s, but over the last 40 years, the standard deviation is around 0.7 yards per attempt each season.

[continue reading…]

{ 0 comments }

The Range Of Passer Ratings Is Getting Smaller

In 1988, the passer rating for the entire NFL was 72.9. In 2019, every single team had a passer rating higher than that mark! Last season, the Carolina Panthers finished with a 74.7 passer rating, which was both the lowest in the 2019 NFL season and also the highest mark in history by a team that ranked last in that statistic.

This is part of two general trends: passer ratings are going up, but also, the variance in passer ratings is declining. [continue reading…]

{ 0 comments }

2019 Era-Adjusted Passer Ratings

In what is becoming a yearly tradition, today I am going to post the era-adjusted passer ratings from the 2019 season.

Passer rating is made up of four variables: completion percentage, yards per attempt, touchdown percentage, and interception percentage. The reason passer rating needs to be adjusted for era? Well, that’s pretty simple to explain.

When the formula was derived in the early ’70s, an average rating in each variable was achieved with a 50% completion rate, averaging 7.0 yards per pass attempt, a 5% touchdown rate, and a 5.5% interception rate. Since those numbers are wildly out of date, I came up with a formula that perfectly matches the intent of passer rating but ties the variables to the league average in any given season. You can get the formulas and read more background in the linked posts.

In 2019, the four averages were 63.5%, 7.22, 4.46%, and 2.30%, respectively. The big changes, of course, are in completion percentage and interception rate; yards per attempt is much more stable throughout history, while touchdown rate is actually slightly lower than it was in the ’70s.

One thing to keep in mind: these adjustments will not change the order of passer ratings in a given season. So Ryan Tannehill, Drew Brees, Lamar Jackson, Kirk Cousins, and Russell Wilson will remain your top 5 leaders; the way the formula works, it simply subtracts a fixed amount from each passer’s actual passer rating. In 2019, that amount was a whopping 23.7 points from each passer.

Below are the 2019 passer ratings: [continue reading…]

{ 0 comments }

There aren’t many shared birthdays among NFL starting quarterbacks. Teddy Bridgewater and Drew Lock were born four years apart on November 10th, making them the only shared birthday among players with 1,000 passing yards last season. The March 2nd birthday has been held by Ben Roethlisberger alone for a long time, but Tua Tagovailoa — both on the same date 16 years later — arrives just in time to carry that date’s mantle. And watch out: the next decade of the NFL could be defined by Kyler Murray (born August 7th, 1997) and Jalen Hurts (born August 7th, 1998). As for the presumptive number one pick in the 2020 Draft?  Well, Joe Burrow may wind up being the career leader in passing yards by a player born on December 10th by the end of his rookie season.

But when it comes to NFL birthdays, there’s no date that can compare to today.  Drew Bledsoe — born on Valentine’s Day, 1972 — ranks 16th on the all-time passing yards list, and he’s only the third best quarterback born on this date.  Hall of Famer Jim Kelly was born a dozen years before Bledsoe, and Steve McNair was born February 14th, 1973.  There are only 47 quarterbacks with 30,000 passing yards, and three of them were born today.  David Garrard ranks 142nd on the all-time passing yardage list with over 16,000, which is pretty darn good for the 4th best quarterback born on a calendar date.  In fact, no other calendar date has four passers of note (May 17th is the only other day to give us four quarterbacks who hit even 7,500 yards).

And Patrick Ramsey, who ranks as the 5th best February 14th passer, has more yards than any other player who ranks fifth on his birthday’s passing list. The same is true of Anthony Wright at #6, although that’s where the fun stops. With Christian Hackenberg — yes, he celebrating his 25th birthday today — failing to gain any traction in the NFL, May 11th remains the only birthday with seven 1,000-yard passers.

The graph below shows the career passing yards for each birthday for all of NFL history. With over 137,000 passing yards, February 14th is easily the leader: [continue reading…]

{ 0 comments }

True Receiving Yards Revisited

Way back in the simpler days of 2013, Chase introduced a Neil Paine creation called True Receiving Yards (TRY). It was a great look at receiving production [1]As measured by adjusted catch yards (ACY), which you’ll read about in less than a minute. in the context of both the team’s passing environment relative to the rest of the league and that year’s league’s passing environment relative to the average passing environment since 1970.

I wanted to revisit TRY, this time using my version of the metric (sorry Stuart-Paine loyalists). I will do so in a short series of brief posts. [2]Unless I fall prey to ennui and decide to stop without further explanation, which is a very real possibility. In today’s article, I plan to explain my methodology and present an abridged version of the results for single seasons.

Methodology

  1. The first step in finding TRY is finding each receiver’s adjusted catch yards. In the original post, Neil used receiving yards and 5 and 20 yard bonuses for catches and touchdowns, respectively. I decided to forego the reception bonus and simply use receptions and a 20 yard touchdown bonus. The 5 yard coefficient for catches isn’t bad, but it’s just not the way I prefer to calculate it. If you would like to see this study done with the original methodology, Pro Football Reference has all the information you need to run the numbers through the gamut. [3]You will notice I did not do the subsequent conversion for ACY that Neil did. The reason is simple: I didn’t find it necessary. We can then prorate these numbers to a 16-game league schedule. Using Lance Alworth‘s glorious 1965 campaign as an example: he had 1602 yards and 14 touchdowns, which translates to 1882 ACY. Using 16/14 to prorate to a modern league schedule, that comes to 2151.
  2. Next, we find the number of pass attempts for each team in the league, as well as for the league as a whole. The original version used dropbacks, whereas my version uses passes attempts. This is because it allows me to go back to 1932 rather than stopping at 1949. [4]Or 1947 if you want to use estimated sacks based on sack yardage numbers. By doing this, we can see how often a team passed the ball relative to the rest of the league. For example, the 1965 Chargers threw the ball 28.6 times per game. The AFL average was 32.6. That means the San Diegans passed 88% as often as the average team that league season. Thus, Bambi’s 1965 season gets an adjustment: 2151/0.88 = 2449. Because such steep adjustments can seem a bit too much, we can soften the adjustment by dividing 2151 by the average of 0.88 and 1: 2151/0.94 = 2290.
  3. Now, we find the number of pass attempts per game in each season, as well as the historical average for passes per game. Like the second step allowed us to compare a receiver’s team pass-happiness to contemporary teams, this step allows us to compare his league’s pass propensity to all teams “in NFL (and AAFC and AFL) history.” Since 1932, the first season for which official and mostly-reliable statistics are widely recorded, the average team has thrown the ball 30.35 times per game. Continuing with our Alworth ’65 magnum opus, the 1965 AFL passes 32.61 times per bout. A little back of the envelope math tells us that’s 107% of the historical average. If we soften that the same way we did the adjustment in step two, it drops to 104%.
  4. There are a few paths we can take from here. We can combine the two hardest adjustments like so: 2449/1.07 = 2279. Alternatively, we can combine the soft adjustment from step two with the hard adjustment from step three: 2290/1.07 = 2132. Last, and my preferred method, we can combine the two soft adjustments: 2290/1.04 = 2208.

I hope to all that is pure and true that I have adequately explained this to the FP Faithful. If I have failed to do so, I’m happy to have offseason banter in the comments. For now, let’s look at some tables.

The Boring Table

The first table contains the sausage making data that informs the more interesting tables to follow and is sorted by greatest total adjustment. [5]The combined statistical adjustments of the soft team passing ratio and the soft year adjustment. Read it thus: Bill Smith, playing in the 1935 NFL, caught 24 passes for 318 yards and 2 touchdowns, worth 358 adjusted catch yards. his team played 12 games and passed 10.6 times per contest. The league averaged 15.4 passes per game, so Smith’s squad sported a ratio of 0.69 and a soft ratio of 0.84. The 1935 NFL league year usage rate factor is 0.51, and the soft factor is 0.75. With a league adjustment of 1.18 (1/0.84) and a year adjustment of 1.33 (1/0.75), Smith’s final adjustment is 1.57.

If you are the type who is interested in the nuts and bolts rather than just the results, you may like this one. It shows all the little background modifications outlined in the methodology section, as well as the combination of the two soft adjustments, which will be the basis for what I write about this going forward.

You can see Bill Smith gets the most help from adjustments, with a whopping 57% boost to his ACY. I like this, in part, because it highlights the problems we encounter when we go back too far when trying to compare passing and receiving across eras. The same thing happens when you apply Chase’s RANY and VAL to Sid Luckman‘s 1943. Is it fair that some of these antediluvian fellows get such a large bump? I can’t answer that, but I think it’s important to think about. [6]Important in the NFL stats history sense of the word. Not actual important. We’re all wasting our time with this nonsense anyway.

On the flip side, Calvin Johnson sees the biggest decrease, losing about 20% of his ACY. he doesn’t get any help from prorating, since he already played in a 16-game league. His team was so pass happy that it made people think Matthew Stafford was a future Hall of Famer. And his league was so pass happy that several Hall of Average passers had rapidly ascended career leaderboards. One could argue that it is specifically because Megatron was so talented that his team passed so frequently, and that is a reasonable position to hold. Again, I don’t know that there are definite answers to debates like this, and I’m not here to provide them even if there are. I just want to facilitate (hopefully) friendly discussion.

The Table You Really Want

The table below contains several different versions of True Receiving Yards, based on regular season production, and is sorted by my favorite version – TRYSoft. Here’s how to decipher the information: The famous Crazy Legs 1951 season saw him haul in 66 passes for 1495 yards and 17 touchdowns. That’s good for 1835 adjusted catch yards. That prorates to 2447 ACY in a 16 game schedule. Hirsch played for a pass-happy team, so his team adjustment brings that down to 2121. When we soften that a bit, the number increases to 2272. TRYMax is based on the full team adjustment and the full league adjustment. In Hirsch’s case, that means we divide 2121 by the 1951 NFL factor of 0.888, giving us 2389. TRYMid is based on the soft team adjustment with the full league adjustment, so we divide 2272 by the 0.888 factor, arriving at 2559. My preferred method, TRYSoft, uses softened factors for both the team and the league. For Crazy Legs, that means dividing 2272 by 1951’s soft factor of 0.944, finally landing on 2407.

I think if most regular readers here were to guess prior to seeing the table, they would have correctly picked out the top season (and easily five of the top ten) without giving it much thought. Hopefully this suggests face validity and not mass stupidity on our parts.

The list contains 3090 seasons from 937 players. Only seasons that saw a player gain at least 750 TRYSoft are included. [7]That is combined regular season and postseason TRYSoft. Ranks are with respect to combined numbers, though those numbers aren’t in the tables presented today. The playoff princess is in another … Continue reading Obviously, Jerry Rice leads all receivers in appearances with 18. Larry Fitzgerald backs him up with 16, while Terrell Owens and Tony Gonzalez boast 14 apiece. The GOAT’s top season (playoffs included) is 1989, which ranks sixth. He also sports top-100 seasons ranking 13th, 16th, 17th, 41st, 73rd, and 76th. His seven top-100 seasons leads all receivers.

Underrated-by-modern-box-score-scouts-receiver Michael Irvin has five seasons in the top 100, as does the receiver with arguably the best highlight reel of them all, Randy Moss. Don Hutson, perhaps surprisingly, only has four. Lance Alworth, Steve Smith Sr., and Antonio Brown have three.

I’m sure there are plenty more interesting observations to be made, but I’ll leave that to the good people in the comments.

References

References
1 As measured by adjusted catch yards (ACY), which you’ll read about in less than a minute.
2 Unless I fall prey to ennui and decide to stop without further explanation, which is a very real possibility.
3 You will notice I did not do the subsequent conversion for ACY that Neil did. The reason is simple: I didn’t find it necessary.
4 Or 1947 if you want to use estimated sacks based on sack yardage numbers.
5 The combined statistical adjustments of the soft team passing ratio and the soft year adjustment.
6 Important in the NFL stats history sense of the word. Not actual important. We’re all wasting our time with this nonsense anyway.
7 That is combined regular season and postseason TRYSoft. Ranks are with respect to combined numbers, though those numbers aren’t in the tables presented today. The playoff princess is in another castle.
{ 1 comment }

Welcome to the 2020 Offseason

I’m going to take a little vacation: both in the physical sense and from writing every day. Given how tight this community is, I wanted to let everyone know that I probably won’t be updating this blog for the next week or two, but don’t worry about me.

In the meantime, please leave any ideas, thoughts, or anything on your mind in the comments. As we begin the 2020 offseason, what are you interesting in reading about? Writing about? Studying? Debating?

Thanks,

Chase

{ 0 comments }

The Comeback Chiefs Win Super Bowl LIV

The Kansas City Chiefs are Super Bowl champions. And the Chiefs did it in one of the most remarkable ways possible: by coming back from double digit deficits in all three games.

Kansas City trailed 24-0 early in the 2nd quarter of the Division Round playoff game with the Texans. The Chiefs responded with four touchdown drives to somehow grab a 28-24 lead heading into the locker room.

In the AFC Championship Game, the Titans jumped out to a 10-0 lead 10 minutes into the game, and held a 17-7 lead with 5 minutes left in the half. Once again, Kansas City score two quick touchdowns to take a lead into the locker room, 21-17.

Then, last night in the Super Bowl, the 49ers took a 20-10 lead into the 4th quarter. The low point was probably with 7:13 left in the game, as the Chiefs trailed 20-10 and faced a 3rd-and-15 from the Kansas City 35-yard line. [continue reading…]

{ 1 comment }

Andy Reid And The Hall of Fame

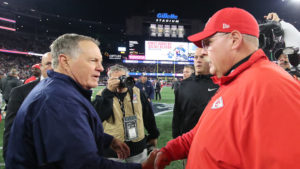
Two of the best coaches of the last 20 years. Belichick is 3-0 against Reid in the postseason.

As Andy Reid gets his Kansas City Chiefs ready for Super Bowl LIV, he should also be getting ready to get a gold jacket. With a win, there’s no question that Reid is a lock for the Hall of Fame. But even without it, Reid has now done enough that he will one day wind up in Canton.

How do you get to the Pro Football Hall of Fame as a head coach? Here’s a helpful flow chart.

Did you win 3 rings? If so, proceed to Canton (9)

If you win three championships as a head coach in the NFL, you are going to make the Hall of Fame. There are only 10 men who can make that claim, and nine of them are already enshrined in Canton: George Halas, Curly Lambeau, Paul Brown, Chuck Noll, Joe Gibbs, Weeb Ewbank, Vince Lombardi, Bill Walsh, and Guy Chamberlin. The 10th, of course, is Bill Belichick, who will at some point retire and then be a first ballot inductee.

Did you win 2 rings plus have a third appearance? If so, proceed to Canton (3)

Two of the best head coaches ever — Don Shula and Tom Landry — fall into this category. Both are also in the top four in all-time wins. The third is Bill Parcells, who also took two different teams, and three different quarterbacks, to the Super Bowl. [continue reading…]

{ 0 comments }

Leading Rushers In Each Super Bowl

The last running back to win the Super Bowl MVP was Terrell Davis, which happened over 20 Super Bowls ago. One reason for that is a decline in big rushing games in the Super Bowl, particularly with respect to the winning team. Just once in the last 16 Super Bowls — Dominic Rhodes back in SuperBowl XLI — has the winning team had a 100-yard rusher. Perhaps more interesting is that in the last 9 Super Bowls, the losing team had the game’s leading rusher more than half the time.

The graph below shows the leading rusher for both the winning and losing teams in the Super Bowl. The winning team’s leading rusher is in a full black circle, while the losing team’s leading rusher is in a white circle with a black outline. In addition, in the 13 of 53 Super Bowls where the game’s leading rusher was on the losing team, I’ve put that in a white circle with a red outline. [continue reading…]

{ 0 comments }