
On Saturday, I looked at the era-adjusted leaders in completion percentage. On Sunday, I did the same for yards/attempt, on Monday, I analyzed the era-adjusted leaders in touchdown rate, and yesterday continued the analysis but for interception percentage.
I thought it would be helpful to have all the information in one place, so that’s what today’s post is. Here’s how to read the table below.
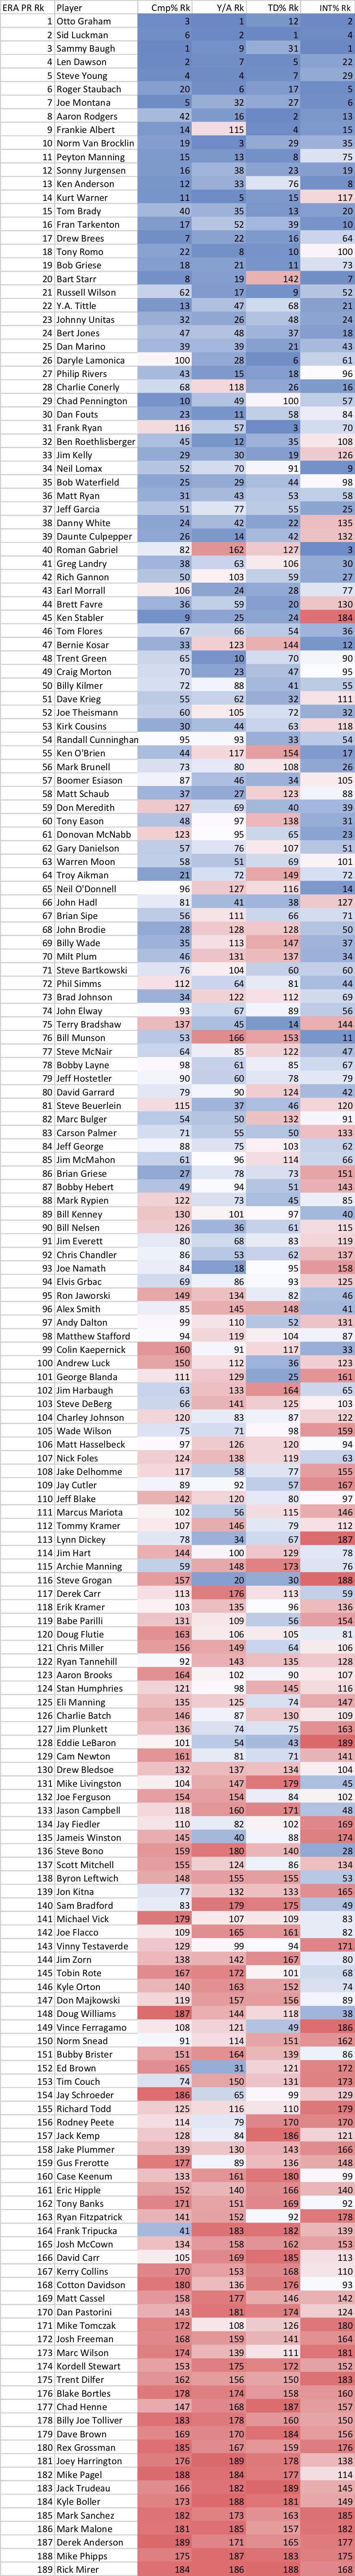
Otto Graham threw 2,626 pass attempts, and played from 1946 to 1955. He is in the Hall of Fame. Based on the passer rating formula — where 1.00 represents league average (a 66.67 era-adjusted passer rating), and a 1.50 in each category translates to a 100.00 passer rating — Graham scored a 1.40 in completion percentage, 1.53 in yards/attempt, 1.25 in touchdown rate, and 1.53 in interception rate. If you add those four numbers and divide by 6 — yes, this is exactly how passer rating is calculated! — you get 95.2, which is Graham’s era-adjusted passer rating. The full results are below.
In addition, I’m presenting the data in rank form, and color-coded to make it easier to view and spot outliers. Graham ranks 3rd in era-adjusted completion percentage, 1st in yards/attempt, 12th in touchdown rate, and 2nd in interception rate. Enjoy!
Please leave your thoughts in the comments.