≡ Menu

The 2017 Eagles won the Super Bowl, but the 2016 Eagles were just 7-9. That is pretty misleading: the 2016 Eagles had the best DVOA of any team in the last 30 years with a losing record, so in some ways, the ’17 season wasn’t a big surprise.

On the other hand, well, the Eagles became just the 4th team to go from a losing record to Super Bowl champion in one season. The other three teams were much worse in the prior year than the 2017 Eagles, but you can probably guess them: the 2001 Patriots, 1999 Rams, and 1981 49ers.

On average, Super Bowl champions win 12.7 games the year they win the Super Bowl (with non-16 game seasons pro-rated to 16 games), 10.9 games the year before, 9.7 the year before that, 9.5 three years before, and 9.2 four years before. The table below shows the number of wins in Year N (the Super Bowl year) for each Super Bowl champion, along with their number of wins in the prior four years. The final column shows the average of wins in Years N-1, N-2, N-3, and N-4. Note that all non-16 game seasons have been pro-rated. [continue reading…]

{ 2 comments }

Simeon Rice was one of the best pass rushers of his generation. He led all players in sacks from 1996 to 2005, and also from 1999 to 2002. During those four seasons, Rice played on defenses that faced just 2,098 pass plays: every team other than the Bills (2,078 pass plays) faced more pass plays during those years.

In fact, in his average season — weighted for the number of sacks Rice recorded — his defenses faced just 32.78 pass attempts (including sacks) per game. The reason I weight for number of sacks is that if Rice played on defenses that faced 600 pass attempts during his big sack years, and 400 pass attempts during his low sack years, that’s not the same as facing 500 pass attempts every year. A player’s reputation is built off of his big sack years, which generally coincide with his prime; as a result, those years should received more weight. If a 37-year-old Rice played on a team that faced 700 pass attempts and Rice barely played, it wouldn’t make sense to count that equally with a year in his prime.

The table below shows every season of Rice’s career. By way of example, as a rookie, he played for Arizona and recorded 12.5 sacks, which is 10.25% of his career total. His Cardinals faced 548 pass plays (including sacks), or 34.25 per game that season, so when calculating his career grade, 10.25% of it will come from the 34.25 number. The “Prod” column is the product of the “Perc” column and the “TPA/G” column. The far right column shows the average NFL sack rate that season, which is shown only for reference. [continue reading…]

{ 1 comment }

2017 Game Scripts: Results from all 534 games

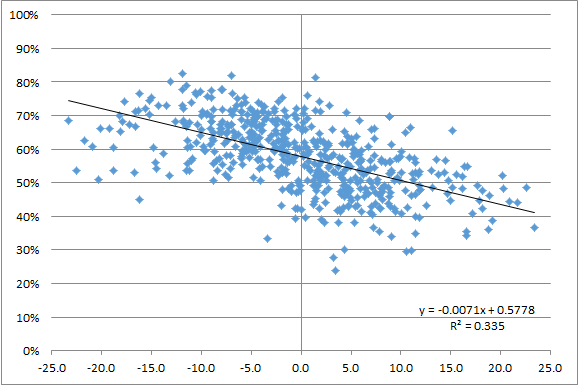
There are 256 regular season games each year, plus 11 postseason games, for a total of 267 NFL games per season. This means there are 534 team games each year, which means 534 different Game Scripts and 534 different pass ratios. Here’s a graph of all pass ratios (on the Y-Axis) from 2017, marked against Game Scripts (on the X-Axis).  As you can see, as a team’s Game Script improves, its pass ratio tends to decrease.

[continue reading…]

{ 3 comments }

Clearly a rushing quarterback

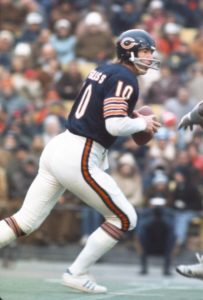
How do you identify who is a rushing quarterback? On the surface, rushing yards per game seems like a pretty simple and easy way to do it.  Michael Vick is the career leader in rushing yards per game by a quarterback, at 42.7. [1]Although Spec Sanders would be number one if you were inclined to label him a quarterback. Robert Griffin (39.8), Cam Newton (39.6), Russell Wilson (34.1), and Colin Kaepernick (33.3) are the next five quarterbacks on the career rushing yards/game list after Vick. [2]Bob Hoernschemeyer, Tuffy Leemans, and Charley Trippi also all averaged more than 25 passing yards per game and at least 35 rushing yards per game.

That seems to work pretty well, I suppose. But what about Bobby Douglass? He averaged 40.5 rushing yards per game with the Bears in 61 games but only 45 starts; he played in 30 more games the rest of his career that torpedoed his career average to 29.2. Or Greg Landry, who averaged 24.5 rushing yards per game with the Lions, but whose career averaged is only 18.5 because of time spent as a backup.

And here’s the really tricky part. Today’s quarterbacks pass more than ever. If a quarterback runs 6 times and passes 34 times in 2018, does that make him less run-happy than a quarterback who ran 6 times and passed 24 times in 1981? I think it might: the 1981 QB ran on 20% of plays, while the 2018 QB will run on 15% of his plays. But it is not necessarily intuitive (or correct) to identify rushing quarterbacks by how much they rush for relative to their passing.

So that’s what I did today: I calculated both the rushing yards per game and the rushing yards per pass attempt career averages for all quarterbacks with at least 1,000 pass attempts.  Here’s how to read the table below (which shows the top 100 rushing quarterbacks by this metric), using Bobby Douglass as an example. Douglass rushed 410 times in his career for 2,654 yards, a 6.47 YPC average. He played in 91 games, meaning he averaged 29.2 yards per game. He threw only 1,178 passes, however; as a result, Douglass averaged an incredible 2.25 rushing yards for every pass attempt in his career. That’s the best in NFL history, and Vick is the only one who is even close. [continue reading…]

References

References
1 Although Spec Sanders would be number one if you were inclined to label him a quarterback.
2 Bob Hoernschemeyer, Tuffy Leemans, and Charley Trippi also all averaged more than 25 passing yards per game and at least 35 rushing yards per game.
{ 0 comments }

2017 Playoff Game Scripts

Today we are going to look at the Game Scripts from the 11 games in the 2017 playoffs. There were two big blowouts in the postseason: the Eagles over the Vikings in the NFCCG and the Patriots over the Titans in the division round. Both teams won by over 20 points and had Game Scripts of over +10. But there were two other games that were very close but with blowout Game Scripts: in other words, two games that almost saw miraculous comebacks.

The Jaguars beat the Steelers with a Game Script of +10.6. Jacksonville led 21-0 early in the 2nd quarter and 28-7 late in the first half. But Pittsburgh scored 5 touchdowns on the team’s final 7 drives of the game, ultimately falling 45-42.

The Vikings led the Saints 17-0 just 20 minutes into the division round game, and that score held with just 17 minutes left in the game. From there, New Orleans staged a furious comeback, scoring 24 points in 16-minute stretch to take a 24-23 lead. This was one of the most miraculous comebacks in playoff history, but it was upstaged by an even more miraculous comeback by the Vikings just seconds later.

The full Game Scripts data from the playoffs, below: [continue reading…]

{ 0 comments }

Weeks 16 and 17 Game Scripts (2017): Finally!

The end of 2017 was a pretty busy time for me, so I stopped the game scripts data after week 15. Under the philosophy of late than never… [continue reading…]

{ 0 comments }

Passing from 1950 to 2017 (in graphic form)

Five years ago, I posted one of my favorite graphs, which shows how passing has changed in the NFL since 1950. A picture is worth at least 1,000 words in this case. I have updated the graph for the last few years of data and also to include first downs.

With one chart, you can see what has happened, on average, on each pass play (sacks plus pass attempts) for each season in pro football history. The graph below shows the number of interceptions per dropback (red), sacks per dropback (purple), non-INT incomplete passes per dropback (in yellow), non-first down completions per dropback (green), and then first downs on completed passes per dropback (blue). Of course, a dropback is simply a pass attempt or a sack. The information is stacked on top of each other for ease of viewing.

Pretty fun!

{ 0 comments }

Three years ago, I wrote this post titled “Take Away His X Best Carries and He’s Average.”  I did the same thing last year, too. The idea was simple: Suppose you sort each running back’s carries in descending order by yards gained. How many carries would we need to take away from him to drop his production to at or below average?

There were 47 running backs last season who had at least 100 carries in 2017, those players averaged 4.08 yards per carry last season.  The best running back by yards per carry last season, by far, was Alvin Kamara, with a remarkable 6.07 average gain.  Kamara had just 120 carries last year, but he was remarkable at producing big runs. He had 13 carries of 15+ yards last season, an unfathomable (and unsustainable) rate of one 15+ yard run every 9.2 carries.  Kamara’s lofty YPC number wasn’t the result of one big run, which is often the case for a player with a high YPC average on a low number of runs: sure, Kamara had a 74-yard run, but no other run went for more than 25 yards.

In fact, if you removed Kamara’s 12 best runs, he would have still averaged 4.083 YPC, a hair above the 4.078 average among all running backs with 100+ carries.  So in order to bring Kamara’s YPC below-league average, you need to remove his 13 best runs of the season.

The next best player by this metric was Patriots RB Dion Lewis.  You might be surprised that Lewis — who had a 4.98 YPC on 180 carries — would be higher than Chiefs RB Kareem Hunt, who averaged 4.88 YPC on 272 carries.  All else being equal, this metric rewards players with higher averages on a larger number of carries. But that’s what made Lewis’s season so impressive: he averaged 4.98 YPC despite his longest run being just 44 yards, and his second-longest topping out at 31 yards.  Hunt had runs of 69, 58, and 53 yards.  Take away Lewis’s best 5 runs, and his YPC drops to 4.26; take away Hunt’s best five, and he drops below average to 4.04.

The table below shows for each RB how many of their best carries you need to take away to bring their 2017 YPC average below 4.08. [continue reading…]

{ 0 comments }

Single-Season Era-Adjusted Passer Ratings

On Monday, I published updated (through 2017) career passer ratings that are adjusted for era. Last year, I published the single-season ratings, so I wanted to update that post today.

Passer rating is a bad stat, and era-adjusted passer ratings have all of those same flaws, too. But EA-PR is without question better than passer rating, and since passer rating is such a ubiquitous stat, I wanted to post all of the EA-PRs so you could have them at your disposal (the table below has over 7,700 rows!).

Below are the era-adjusted passer ratings for every player in every season since 1932.  Here’s how to read the table below, which is fully sortable and searchable.  Sid Luckman has the best single season, playing in the NFL for Chicago in 1943.  That season counted for 11.58% of his career pass attempts (useful if you want to calculate a player’s career passer rating), as he threw 202 passes, completed 110 of them for 2,194 yards with 28 TDs and 12 INTs.  That was enough attempts to qualify for the passer rating crown; his actual passer rating was 107.5, and his Era Adjusted Passer Rating was 135.0, the best ever. [continue reading…]

{ 0 comments }

Jameis Winston Had An Unusual 2017 Season

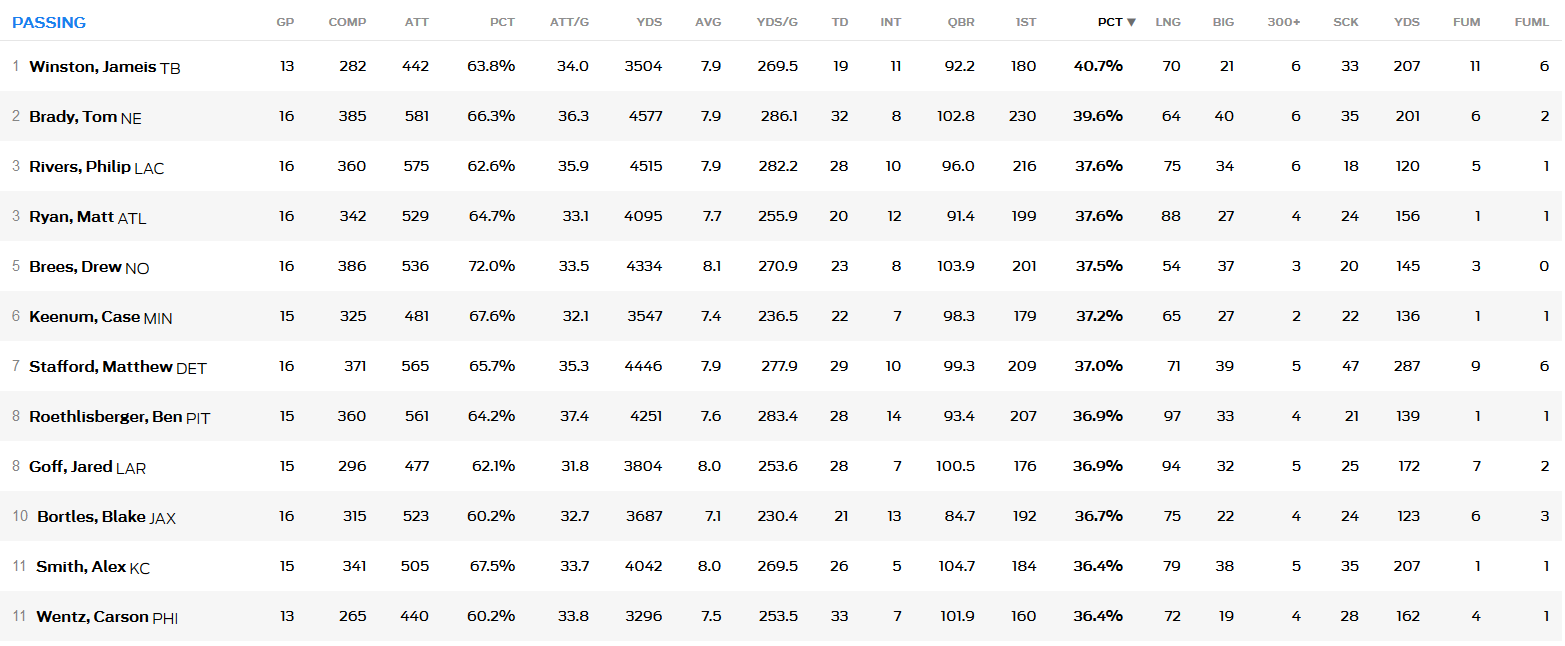
Statistically, Jameis Winston had a strong 2017 season. Winston was above-average in completion percentage, yards per attempt, net yards per attempt, passer rating, and Adjusted Net Yards per Attempt. Overall, Winston ranked 11th in ANY/A and 14th in passer rating, but that might undersell him. That’s because Winston was also the game’s preeminent downfield thrower in 2017. His average pass traveled 10.62 yards in the air, by far the longest in the NFL (Carson Wentz was second at 9.91, followed by Russell Wilson at 9.75, Carson Palmer at 9.36, and Tom Brady at 9.09). Winston also led the NFL in average air yards on completions, at 7.97 (Wentz was seond at 7.79, followed by Palmer at 7.53.)

Winston was throwing longer passes, which hurt his passer rating and completion percentage, but helped his team. Winston picked up a first down on over 40% of his pass attempts, the highest rate in the NFL last season:

And Winston was excellent on third downs, which is a pretty key component of producing an efficient offense. In fact, he ranked 2nd among starting quarterbacks:

So why were the Bucs so bad in 2017? Was it a case of Winston having very good stats but not playing well? I don’t think so. To start, Tampa Bay had the worst defense in the NFL according to DVOA. And the Bucs had very bad special teams, including a disastrous kicking game. Finally, while Tampa Bay ranked 9th in pass DVOA, the Bucs ranked 25th in rush DVOA. The Bucs ranked 30th in rushing yards by running backs (1168) and 29th in rushing yards per carry by running backs (3.53). [continue reading…]

{ 2 comments }

All football historians know about the 1978 rules changes. Here’s an except I wrote about how those changes changed the NFL forever:

There were two key rules changes enacted in 1978. The first prohibited bumping, chucking, or otherwise making anything other than incidental contact with a receiver beyond five yards from the line of scrimmage. The second allowed offensive lineman to be able to extend their arms, and push with open hands, allowing for better blocking and fewer holding penalties. With those rules in place, quarterbacks needed fewer blockers and receivers needed to be less skilled to get open. As a result, three and four wide receiver sets become more common, and the fullback was phased out…. From 1970 to 1977, non-starting wide receivers consistently produced just under 10% of the team’s total receiving yards; by 1990, that number had doubled, and has shown no signs of subsiding.

So what was the impetus for those changes? The 1977 season, which was a passing nightmare. In 1976, teams averaged 4.07 Adjusted Net Yards per Attempt, defined as (Gross Passing Yards + 20 * TDs – 45 * INTs) divided by (Pass Attempts – Sack Yards Lost). Now a 4.07 league average ANY/A wasn’t high – the ’60s NFL saw an average ANY/A of 4.59 — but it wasn’t notably low, either. In fact, 1976 was a slightly better passing environment than the trailing five year average of 4.01. Then, 1977 happened: teams averaged just 3.55 ANY/A, the lowest mark in the NFL since 1953. This was a dramatic decline in passing production of 0.52 Adjusted Net Yards per Attempt.

Fast forward 40 years. In 2016, the league-wide ANY/A average was 6.22, a shade off of the 6.26 ANY/A average in 2015. In fact, 2014 (6.14 ANY/A), 2015 (6.26), and 2016 (6.22) are the three best passing seasons in NFL history. There was little reason to expect 2017 to be any different, but it was: the NFL average ANY/A dropped to 5.91 last season, a decline of 0.31 ANY/A. That was the single largest year-over-year decline since 1976-1977. [continue reading…]

{ 1 comment }

Last year, I wrote about whether sacks are more highly concentrated among a few players now than they were in the ’80s or ’90s. Spoiler: the answer was no. But today I wanted to update that post for the 2017 season.  Let’s use the Patriots as an example.  New England defensive players recorded 41 sacks, but no player filled the shoes left by the departing Chandler Jones. In fact, no Patriots defensive player had even seven sacks. Trey Flowers led the team with 6.5 sacks, and Kyle Van Noy and Deatrich Wise Jr. were the only other players with more than four sacks.

How do you calculate a team’s concentration index?  Flowers had 6.5 of the Patriots defenders’ 41 sacks [1]Note that the Patriots had one sack as a defense that was not assigned to any player, so the New England defense was credited with 42 sacks. For purposes of this post, I excluded sacks for all teams … Continue reading, or 15.9%.  We square that number to calculate the concentration index; 15.9% squared is 2.5%.  Do that for every player on the Patriots defense with at least one sack, and you get the following results:

New England stood out as the team with the least concentrated pass rush. And for the second year in a row, the Raiders (thanks to Khalil Mack and Bruce Irvin) stood out in the opposite direction.  Only the Cardinals — who saw Chandler Jones (after being traded from the team with the least concentrated pass rush) lead the league with both 17.0 sacks and 46.0% of his team’s sacks — had a more concentrated pass rush in 2017.

CI RkTeamSacksSacks RkConc Index
1Cardinals371724.7%
2Raiders312422.5%
3Cowboys381520.6%
4Vikings361919.9%
5Giants272919.3%
6Dolphins302618.4%
7Chargers43518.1%
8Redskins41917.8%
9Lions352017.8%
10Jaguars55216.5%
11Buccaneers223216.4%
12Chiefs312416.2%
13Broncos332215.6%
14Bengals41915.1%
15Saints42614.5%
16Panthers50314.5%
17Ravens41914.4%
18Eagles381513.5%
19Seahawks391313.2%
20Falcons391313.1%
21Rams48413.1%
22Packers371712.7%
23Texans322312.3%
24Titans42612%
25Colts253111.4%
26Steelers56111.4%
27Browns342110.9%
28Bills263010.7%
29Jets282810.6%
3049ers30269.6%
31Bears4269.4%
32Patriots4199%
Average37.214.8%

Overall, the league was slightly less concentrated (14.7%) than it was in 2016 (15.3%), but well within the normal range. Since 2002, the average team has had a pass rush concentration index of 15.0%.

There also, at least in 2017, wasn’t much of a correlation between having a lot of sacks and having a highly (or lowly) concentrated pass rush: The graph below plots team sacks on the X-Axis and Concentration Index on the Y-Axis.

What stands out to you?

References

References
1 Note that the Patriots had one sack as a defense that was not assigned to any player, so the New England defense was credited with 42 sacks. For purposes of this post, I excluded sacks for all teams that were not assigned to a player.
{ 1 comment }

As a rookie, New Orleans running back Alvin Kamara averaged a whopping 6.07 yards per carry, leading the league in that metric by just about any measure. But given the large amount of regression to the mean involved in yards per carry, what would be a reasonable projection for Kamara in 2018?

I looked at the top 50 players in yards per carry from 1960 to 2016, among players who had (1) between 75 and 175 carries and (2) had fewer than 15 pass attempts. There were 13 players who averaged more than Kamara’s 6.07 YPC average (based on 120 carries for 728 yards), and the group as a whole averaged 110 carries for 641 yards, a 5.85 YPC average. So this group was slightly less effective than Kamara. The next year? They averaged 115.3 carries for just 503.8 yards, a 4.37 yards per carry average. That’s a drop of 25%; if Kamara had a similar drop, he would be at 4.53 YPC next season.

The table below shows those 50 players plus Kamara, and how they fared the next season: [continue reading…]

{ 0 comments }

A few months ago on Reddit, I saw this remarkable stat: including the postseason, Tom Brady is 19-9 in games where he throws at least 50 passes.

How remarkable is that? All quarterbacks have a 0.230 winning percentage in games where they have thrown 50+ passes, which means you’d expect a quarterback with 28 such games to win 6.4 of them, not 19 of them. Drew Brees, Peyton Manning, Dan Marino, Brett Favre, Joe Montana, and Aaron Rodgers have won 19 games when throwing 50+ passes…. but have lost 54 times, a 0.260 winning percentage.

Brady’s success in these games is so remarkable that it might be too remarkable. What I mean by that is that if the average quarterback wins 23% of the time, and the greatest quarterbacks in the game win 26% of the time, seeing Brady win 68% of the time probably isn’t evidence that he’s the greatest quarterback ever — unless he’s about ten times better than every other great quarterback. I’ll let you speculate in the comments as to why the Patriots record is so incredible in these games. The table below shows the records of all quarterbacks in 50+ attempt games (minimum 4 such games), sorted by wins over expectation of a 0.230 winning percentage: [continue reading…]

{ 0 comments }

The last 100-yard rusher for the Lions

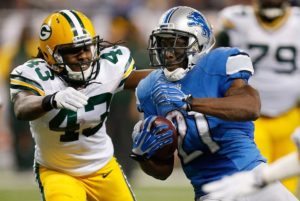
In the early game on Thanksgiving back in 2013, the Lions obliterated the Aaron Rodgers-less Green Bay Packers, 40-10. Matthew Stafford threw for over 300 yards, Calvin Johnson gained over 100 receiving yards, and Reggie Bush rushed 20 times for 117 yards. Heck, backup Joique Bell nearly joined him in the century club, with 17 carries for 94 yards.

Since then, the Lions have played in 68 games without having a 100-yard rusher: Detroit is one game away from tying the ’88-’93 Browns for the second longest streak in history without a 100-yard rusher, and five games away from setting a new record. The current mark is held by the 1960s Washington Redskins, who went 72 games without a 100-yard rusher until Bobby Mitchell on October 1, 1967 ended the streak. [continue reading…]

{ 3 comments }

In 2017, NFL teams completed 10,856 passes. They also threw 17,488 passes and took 1,195 sacks (totaling 18,683 dropbacks). That means NFL teams completed passes on 58% of all dropbacks — let’s call this adjusted completion percentage, since unlike regular completion percentage, it includes sacks in the denominator.

NFL teams also rushed 13,755 times relative to those 18,683 dropbacks. That means NFL teams passed (including sacks) on 58% of all plays. Let’s call this number the league pass ratio.

The fact that the adjusted completion percentage and pass ratio were the same in 2017 was not a coincidence. In 1981, the league-wide adjusted completion percentage was a lot lower at 51%.  That year, the league-wide pass ratio was also 51%.

In 1971, the adjusted completion percentage was 47 percent, while the pass ratio was 46 percent.

In 1962, the adjusted completion percentage was 49% and the pass ratio was 49%.

In other words, the adjusted completion percentage — which measures how often a pass play results in a completion — and the frequency with which teams pass are highly correlated and also nearly identical.  The graph below shows, in dark blue, the league average adjusted completion percentage, and in red, the league average pass ratio, for each year since 1950. [continue reading…]

{ 1 comment }

In 2013, Cordarrelle Patterson led the NFL in kickoff return average at 32.4, with 1,393 yards and 2 TDs on 43 kickoff returns.

In 2015, Patterson again led the league in return average at 31.8, this time with 1,019 yards and two scores on 32 returns.

In 2016, Patterson repeated as kickoff returner champion, averaging 31.7 yards per return on 25 returns.

In 2017, Patterson was on the verge of a three-peat. Through 14 games, Patterson was averaging 28.3 yards per kickoff return, giving him a slight lead on Rams returner Pharoh Cooper.

And over the last two weeks of the season, Cooper saw his kickoff return average drop, while Patterson had one more return for 29 yards. Therefore, Patterson must have threepeated in the category of average kickoff return, right?

Well, not exactly. Through 14 games, Patterson had 18 returns, or 1.29 per team game. He finished the year with 19 returns, or 1.19 per team game. The problem is that the minimum number of kickoff returns to qualify for the league crown is 1.25 per team game. So Patterson failed to qualify by one return; if he had returned one additional kickoff for even 11 yards, he would have three-peated.

Patterson had 19 of the Raiders 34 kickoff returns. The real problem is the era: we are no longer in an era where the minimum should be 1.25 kickoff returns per team game. Why? Last year, just 12 players qualified! In 2010, there were 39 players who qualified, but in 2017, the limit would have needed to be dropped to single digits to get 39 players qualifying for that crown.

So what happened? Well, before the 2011 season, the NFL moved the kickoff from the 30 to the 35-yard line, which resulted in more touchbacks and fewer kickoff returns. And before the 2016 season, the NFL moved the starting field position after a touchback from the 20 up to the 25-yard line. Combined, those two changes have had quite the impact on the number of kickoff returns. The graph below shows the number of kickoff returns had by the average team in each season since 1950, with non-16 game seasons prorated to 16 games. [continue reading…]

{ 0 comments }

ANY/A, Rushing Yards, and Winning Percentage

Recency bias and ever-escalating statistics has led many modern fans to claim that the passing game today is more important than ever. That’s not really true.

But I decided to run another experiment (and check the 2017 data) on the importance of the passing game. I measured the correlation coefficient between winning percentage and Adjusted Net Yards per Attempt in 2017; it was 0.71, which indicates a very strong positive relationship. This is what you would expect: as ANY/A increases, so does winning percentage. Last year, the Saints, Patriots, Chargers, Rams, and Chiefs were the top 5 teams in ANY/A, and they combined for 54 wins and a 0.675 winning percentage. The bottom 5 teams in ANY/A? Cleveland, Denver, Green Bay, Baltimore, and Miami, who combined for just 26 wins and a 0.325 winning percentage.

So ANY/A was correlated with winning percentage in 2017, but that’s not too unusual. From 1974 to 1977, the correlation between the two measures was 0.75 or higher each year. There’s some random variation each year, but on average, the correlation coefficient has been about 0.66. Take a look: [continue reading…]

{ 3 comments }

Last year, Auburn defensive end Carl Lawson was your bench press champion. He finished ever so slightly ahead of Myles Garrett, and while Garrett was the first overall pick in the 2017 Draft, Lawson was a fourth rounder. But in 2017, Lawson led all rookies with 8.0 sacks, while Garrett finished second with 7.0 sacks (he did lead all rookies with 0.63 sacks per game). So does the bench press mean much? Who knows, but that won’t stop me from crunching the data from the 2018 combine.

The best-fit formula to project bench press reps for the 2017 Combine was:

Expected BP reps = 17.401 -0.3354 * Height (Inches) + 0.1075 * Weight (Pounds)

I used that formula to run through the 2018 combine numbers. The result? Georgia RB Nick Chubb was your bench press champion. Penn State RB Saquon Barkley, who ranked 3rd in yesterday’s results on the 40-yard dash, had another third-place finish. The full results, below.

RkNameCollegePOSWeight (lbs)Height (in)Exp BPBench PressDiff BP
1Nick ChubbGeorgiaRB2277118.02911.0
2Kylie FittsUtahDE2637620.23110.8
3Saquon BarkleyPenn StateRB2337218.32910.7
4Natrell JamersonWisconsinFS1987214.52510.5
5Dane CruikshankArizonaSS2067315.1259.9
6Braden SmithAuburnOG3157825.1359.9
7B.J. HillNorth Carolina StateDT3117625.3359.7
8Malik JeffersonTexasILB2367517.6279.4
9Will HernandezTexas-El PasoOG3277427.7379.3
10Christian SamArizona StateILB2447418.8289.2
11Tegray ScalesIndianaILB2307218.0279.0
12Quenton NelsonNotre DameOG3257726.5358.5
13Leon JacobsWisconsinOLB2467518.7267.3
14Andrew BrownVirginiaDE2967623.7317.3
15Davontae HarrisIllinois StateCB2007214.8227.2
16Colby GossettAppalachian State (NC)OG3117725.0327.0
17Foley FatukasiConnecticutDT3187626.1336.9
18Ogbonnia OkoronkwoOklahomaDE2537320.1276.9
19Taven BryanFloridaDT2917623.2306.8
20Anthony MillerMemphisWR2017115.2226.8
21Ola AdeniyiToledoDE2487419.2266.8
22JMon MooreMissouriWR2077514.5216.5
23Jordan WhiteheadPittsburghFS1957114.6216.4
24Genard AveryMemphisILB2487319.6266.4
25Lavon ColemanWashingtonRB2157116.7236.3
26Mike HughesCentral FloridaCB1917114.1205.9
27Chris WarrenTexasRB2477419.1255.9
28Hercules MataAfaWashington StateOLB2547320.2265.8
29Derwin JamesFlorida StateSS2157515.4215.6
30Marquis HaynesMississippiOLB2357517.5235.5
31Sony MichelGeorgiaRB2147116.6225.4
32Trevor DanielTennesseeP2307317.6235.4
33Trevon YoungLouisvilleDE2587619.6255.4
34Kentavius StreetNorth Carolina StateDE2807422.7285.3
35Anthony WinbushBall State (IN)OLB2497319.7255.3
36Kyzir WhiteWest VirginiaSS2167415.8215.2
37James LooneyCaliforniaDE2877523.1284.9
38Kenny YoungUCLAILB2367318.3234.7
39Davon GraysonEast Carolina (NC)WR1997314.3194.7
40Harold LandryBoston CollegeOLB2527519.3244.7
41Michael JosephDubuque (IA)CB1817312.4174.6
42Christian KirkTexas A&MWR2017015.5204.5
43Jerome BakerOhio StateOLB2297317.5224.5
44Josh JacksonIowaCB1927313.6184.4
45Taron JohnsonWeber State (UT)CB1807212.6174.4
46Wyatt TellerVirginia TechOG3147625.7304.3
47Tre FlowersOklahoma StateSS2007513.7184.3
48Bilal NicholsDelawareDT3067624.8294.2
49DaShawn HandAlabamaDE2977623.8284.2
50Dorian ODanielClemsonOLB2237316.9214.1
51Chris CovingtonIndianaOLB2457418.9234.1
52James HearnsLouisvilleOLB2397517.9224.1
53Kendrick NortonMiami (FL)DT3147526.0304.0
54Dallas GoedertSouth Dakota StateTE2567719.1233.9
55Mike GesickiPenn StateTE2477718.1223.9
56Godwin IgwebuikeNorthwesternFS2057215.3193.7
57Kamryn PettwayAuburnRB2337218.3223.7
58Keishawn BierriaWashingtonILB2307417.3213.7
59John Franklin-MyersStephen F. Austin (TX)DE2837622.3263.7
60Sam JonesArizona StateOG3057724.4283.6
61JaVon Rolland-JonesArkansas StateOLB2537419.8233.2
62Bradley ChubbNorth Carolina StateDE2697620.8243.2
63Joshua KaluNebraskaFS1957313.9173.1
64Jalyn HolmesOhio StateDE2837722.0253.0
65Darius JacksonJacksonville State (AL)OLB2427518.3212.7
66Chase EdmondsFordham (NY)RB2056916.3192.7
67Matt DickersonUCLADE2927623.3262.7
68Shaquem GriffinCentral FloridaOLB2277317.3202.7
69Josh AdamsNotre DameRB2137415.5182.5
70Damon WebbOhio StateSS1957114.6172.4
71Parry NickersonTulane (LA)CB1807212.6152.4
72Marcus DavenportTexas-San AntonioDE2647819.6222.4
73Mark WaltonMiami (FL)RB2027015.6182.4
74D.J. CharkLouisiana StateWR1997513.6162.4
75Siran NealJacksonville State (AL)SS1997214.6172.4
76Sean ChandlerTempleFS1907213.7162.3
77Brandon FacysonVirginia TechCB1977413.8162.2
78Shaun Dion HamiltonAlabamaILB2287217.8202.2
79Troy ApkePenn StateSS1987413.9162.1
80Garret DooleyWisconsinOLB2487518.9212.1
81Brian AllenMichigan StateC2987325.0272.0
82Chris HerndonMiami (FL)TE2537619.1211.9
83Trey QuinnSouthern Methodist (TX)WR2037115.4171.6
84Lowell LotuleleiUtahDT3157426.4281.6
85Joel IyiegbuniweWestern KentuckyILB2297317.5191.5
86Dylan CantrellTexas TechWR2267516.5181.5
87KC McdermottMiami (FL)OT3117824.7261.3
88Cole MadisonWashington StateOG3087724.7261.3
89Carlton DavisAuburnCB2037314.7161.3
90David WellsSan Diego StateTE2567818.8201.2
91Danny JohnsonSouthern (LA)CB1857013.8151.2
92Justin ReidStanfordFS2047314.8161.2
93Nick NelsonWisconsinCB2087115.9171.1
94Allen LazardIowa StateWR2277716.0171.0
95Jojo WickerArizona StateDE2967524.1250.9
96Frank RagnowArkansasC3127725.1260.9
97Roc ThomasJacksonville State (AL)RB1987015.2160.8
98Uchenna NwosuSouthern CaliforniaOLB2517519.2200.8
99Oren BurksVanderbiltOLB2337517.3180.7
100Marcus AllenPenn StateFS2027414.3150.7
101Kahlil MckenzieTennesseeDT3147725.3260.7
102Keke CouteeTexas TechWR1817013.4140.6
103Leighton Vander EschBoise StateOLB2567619.4200.6
104Dorance ArmstrongKansasDE2577619.5200.5
105Jason CabindaPenn StateILB2397318.6190.4
106Marcell HarrisFloridaSS2087215.6160.4
107Deshon ElliottTexasSS2057414.6150.4
108Kurt BenkertVirginiaQB2187515.7160.3
109Grant HaleyPenn StateCB1906914.7150.3
110Azeem VictorWashingtonILB2407318.7190.3
111Andre SmithNorth CarolinaILB2377218.7190.3
112Byron PringleKansas StateWR2037314.7150.3
113Holton HillTexasCB2007513.7140.3
114Chris CampbellPenn StateCB1947313.8140.2
115Tremaine EdmundsVirginia TechOLB2537718.8190.2
116Jaylen SamuelsNorth Carolina StateTE2257117.8180.2
117Max RedfieldIndiana (PA)SS2057315.0150.0
118Dominick SandersGeorgiaFS1937214.0140.0
119Alex CappaHumboldt State (CA)OT3057824.0240.0
120Josey JewellIowaILB2347318.118-0.1
121Trey WalkerLouisiana-LafayetteSS2007414.114-0.1
122Jordan WilkinsMississippiRB2167316.116-0.1
123Anthony AverettAlabamaCB1857213.113-0.1
124Jack CichyWisconsinILB2387418.218-0.2
125Chris JonesNebraskaCB1957214.214-0.2
126Jaire AlexanderLouisvilleCB1927114.214-0.2
127Scott QuessenberryUCLAC3107625.225-0.2
128Olubunmi RotimiOld Dominion (VA)DE2737621.321-0.3
129J.C. JacksonMarylandCB1937114.314-0.3
130Peter KalambayiStanfordOLB2527519.319-0.3
131Will ClappLouisiana StateC3117625.325-0.3
132Tony BrownAlabamaCB1987214.514-0.5
133Avonte MaddoxPittsburghCB1806913.613-0.6
134Darius LeonardSouth Carolina StateOLB2347417.717-0.7
135Dee DelaneyMiami (FL)CB1947313.813-0.8
136Durham SmytheNotre DameTE2537718.818-0.8
137D.J. MooreMarylandWR2107215.815-0.8
138Martinas RankinMississippi StateOT3087625.024-1.0
139Tanner CarewOregonLS2437319.018-1.0
140Ryan IzzoFlorida StateTE2567719.118-1.1
141Royce FreemanOregonRB2297118.217-1.2
142Nick DelucaNorth Dakota StateILB2517519.218-1.2
143Steven MitchellSouthern CaliforniaWR1897014.213-1.2
144Jarvion FranklinWestern MichiganRB2397119.318-1.3
145Duke DawsonFloridaCB2087016.315-1.3
146Ade ArunaTulane (LA)DE2627819.418-1.4
147Tyler ConklinCentral MichiganTE2547519.618-1.6
148Justin JacksonNorthwesternRB1997214.613-1.6
149Ray-Ray MccloudClemsonWR1906914.713-1.7
150Andre ChachereSan Jose StateCB2007214.813-1.8
151Justin JonesNorth Carolina StateDT3097425.824-1.8
152Mason ColeMichiganC3077624.923-1.9
153Derrick NnadiFlorida StateDT3177327.025-2.0
154Mike MccrayMichiganOLB2437618.016-2.0
155Mark AndrewsOklahomaTE2567719.117-2.1
156Marcell AtemanOklahoma StateWR2167615.113-2.1
157John KellyTennesseeRB2167017.115-2.1
158Dimitri FlowersOklahomaFB2487419.217-2.2
159Kalen BallageArizona StateRB2287317.415-2.4
160Ryan NallOregon StateRB2327417.515-2.5
161Armani WattsTexas A&MFS2057115.613-2.6
162Akrum WadleyIowaRB1947014.812-2.8
163Dalton SchultzStanfordTE2447717.815-2.8
164Kyle HicksTexas ChristianRB2047015.913-2.9
165Derrius GuiceLouisiana StateRB2247018.015-3.0
166Braxton BerriosMiami (FL)WR1846914.011-3.0
167Donnie ErnsbergerWestern MichiganFB2417518.215-3.2
168Chris WorleyOhio StateILB2387418.215-3.2
169Quadree HendersonPittsburghWR1926815.212-3.2
170Chris LacyOklahoma StateWR2057514.311-3.3
171Deon CainClemsonWR2027414.311-3.3
172Bo ScarbroughAlabamaRB2287317.414-3.4
173Justin CrawfordWest VirginiaRB1997115.011-4.0
174Davin BellamyGeorgiaOLB2557719.015-4.0
175Jordan ThomasMississippi StateTE2657720.116-4.1
176Troy FumagalliWisconsinTE2477718.114-4.1
177James DanielsIowaC3067525.121-4.1
178Rashaad PennySan Diego StateRB2207117.213-4.2
179Geron ChristianLouisvilleOT2987723.619-4.6
180Simmie CobbsIndianaWR2207515.911-4.9
181Michael GallupColorado StateWR2057315.010-5.0
182Will DisslyWashingtonTE2627620.115-5.1
183Kameron KellySan Diego StateFS2007414.19-5.1
184Sean WelshIowaOG3067525.120-5.1
185Zaycoven HendersonTexas A&MDT2987225.320-5.3
186Donte JacksonLouisiana StateCB1757112.47-5.4
187Joshua FrazierAlabamaDT3217626.421-5.4
188Kerryon JohnsonAuburnRB2137116.511-5.5
189Rashaan GauldenTennesseeFS1937313.78-5.7
190Demario RichardArizona StateFB2186917.712-5.7
191Austin CorbettNevadaOG3067624.819-5.8
192Jordan LasleyUCLAWR2037314.78-6.7
193Richie JamesMiddle Tennessee StateWR1837013.66-7.6
194Tyrell CrosbyOregonOT3097724.817-7.8
195Taylor HearnClemsonOG3207626.318-8.3
196Jamil DembyMaineOG3197626.217-9.2
197K.J. MaloneLouisiana StateOG3037624.515-9.5
198Orlando BrownOklahomaOT3458027.714-13.7

What stands out to you? Other than Orlando Brown finishing at the bottom for the second day in a row.

{ 1 comment }

DeAndre Hopkins had a All-Pro year for the Houston Texans, who went 4-12 in a season defined by injuries. But week in, week out, the Texans could rely on Hopkins. In fact, he led the team in receiving yards in 13 of the first 15 games of the season, before sitting out the final week 17 game.

On the other side of the ledger, we have the Browns. Cleveland had 8 different players (Corey Coleman, Rashard Higgins, Duke Johnson, Ricardo Louis, Kasen Williams, David Njoku, Isaiah Crowell, and Seth Devalve) lead the team in receiving yards during its first 9 games!  Coleman led the team in receiving yards in games 10 and 11, and then Josh Gordon returned and led the Browns in receiving yards in 4 of the final 5 games of the season. Cleveland was one of just three teams that didn’t have a player lead the team in receiving yards in more than 4 games: [continue reading…]

{ 0 comments }

Twenty Years of Alabama Drafts

Over the last 20 drafts, there have been 101 players selected from the University of Alabama: [continue reading…]

{ 0 comments }

From 1973 to 1980, #88 on the Cowboys, Drew Pearson, was 22-29 years old. During that time, he:

  • Made 3 Pro Bowls and earned 3 AP first-team All-Pro honors
  • Ranked 3rd in receiving yards
  • Ranked 3rd in receptions
  • Ranked tied for 11th in receiving touchdowns
  • Played on a team that ranked 11th in pass attempts (mostly 26 teams)
  • Won a Super Bowl

From 1988 to 1995, #88 on the Cowboys, Michael Irvin, was 22-29 years old. During that time, he:

  • Made 5 Pro Bowls and earned 1 AP first-team All-Pro honor
  • Ranked 3rd in receiving yards
  • Ranked 6th in receptions
  • Ranked 7th in receiving touchdowns
  • Played on a team that ranked 18th in pass attempts (30 teams)
  • Won three Super Bowls

From 2010 to 2017, #88 on the Cowboys, Dez Bryant, was 22-29 years old. During that time, he:

  • Made 3 Pro Bowls and earned 1 AP first-team All-Pro honor
  • Ranked 8th in receiving yards
  • Ranked tied for 12th in receptions
  • Ranked 2nd in receiving touchdowns
  • Played on a team that ranked 21st in pass attempts (32 teams)

Bryant continued the rich tradition of Cowboy wide receivers wearing 88 to turn into stars.  He also may continue another Cowboys wide receiver tradition: being very, very good, but not quite Hall of Fame good.  In addition to Pearson, consider another Hall of Fame outsider: [continue reading…]

{ 0 comments }

There is no more polarizing quarterback prospect in this year’s draft than Wyoming’s Josh Allen. The buzz is getting louder that the Browns will select Allen with the first overall pick; the more analytically inclined observers think that would be a disaster. In some minds, Allen doesn’t even project as a first round pick.

Allen has a significant amount of bust potential but traditional quarterback size and one of the greatest arms you’ll ever see. That has naturally led to some comparisons to two of the biggest draft busts in recent memory: Ryan Leaf and JaMarcus Russell.

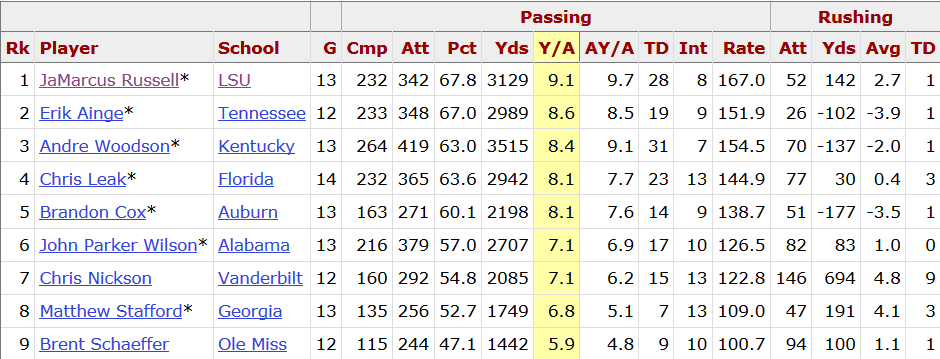
But a comparison to Leaf, Russell, and don’t make much sense. That’s because those guys were stars in college. Here is what Leaf did in his final season: he was extremely efficient despite easily leading the Pac-10 in passing attempts.  He averaged 9.7 yards per pass and lapped the Pac-10 in passing yards and touchdowns, ranking second in efficiency only to another future first round pick:

And Russell? Well, he led the SEC in Y/A and AY/A and also completion percentage in his final season.  He had fantastic rate stats and gross stats playing in the toughest conference in football, on top of being an incredible physical specimen.

[continue reading…]

{ 0 comments }

You know who the best player was in the 2000 Draft: Tom Brady, who has a career AV of 171. Brian Urlacher (118) is the only other player with a career AV of over 100.

I looked at the 46 drafts from 1967 (the first AFL-NFL common draft) through 2012 (there’s no clear cut-off of when to stop, but 2012 is about as late as you can push it). Of those 46 drafts, the top overall pick had the most AV in 6 drafts, and in another 7 drafts, the top AV came from the 2nd or 3rd overall pick. In half of these drafts, the top AV came from a top-15 pick, while in four of 46 drafts, it came from a player outside of the top 100.

The graph below shows, for each year, the draft pick that produced the most career AV.

And here’s the full list in table form: [continue reading…]

{ 1 comment }

Yesterday, I wrote that we are living in the golden age of NFL rookies.  I don’t think it’s controversial to state that — even after adjusting for era — five of the best six seasons by a rookie QB from 1970 to 2017 all came from active quarterbacks: Ben Roethlisberger in 2004, Matt Ryan in 2008, Russell Wilson and RG3 in 2012, and Dak Prescott in 2016.  Note that this doesn’t even include Andrew Luck in 2012 (who actually got more ORotY votes than Wilson) because he had mediocre efficiency numbers, or Deshaun Watson in 2017 because he was limited to just seven games, or Vince Young 06, Andy Dalton 2011, Cam Newton 2011, and Jameis Winston in 2015, who, along with Marino, Wilson, Griffin, Luck, and Prescott, are the only rookie quarterbacks to make the Pro Bowl since the merger. Or Sam Bradford, who won AP Offensive Rookie of the Year, something no quarterback other than Marino did from 1971 to 2003.

So, what gives? The graph below shows all rookie passers since 1970 to start at least 8 games and throw at least 150 passes. On the X-Axis, the year; on the Y-Axis, the passer’s ANY/A+, which is on a scale where 100 equals NFL league average, 115 represents one standard deviation above average, and 130 represents two standard deviations above average. [continue reading…]

{ 0 comments }

Which Team Lost The Most Between 2016 and 2017?

The 2016 Bills had a pretty serious amount of roster turnover, particularly among players who went to new teams (rather than due to injury or because they were out of the league). Some, like wide receivers Marquise Goodwin, Robert Woods, and Sammy Watkins, had more success with their new teams. Others, like defenders Stephon Gilmore, Corey Graham, and Zach Brown, were better off in Buffalo.

There were 19 players who were on the 2016 Bills and played for a different team in 2017. In total, those players produced 62 points of AV in 2016 in Buffalo, and then 55 points of AV in 2017 not in Buffalo. The full list, below:

PlayerPos2016 Team2016 AVV2017 Team2017 AVDiff
Marquise GoodwinWRbuf4sfo84
Robert WoodsWRbuf6ram82
Sammy WatkinsWRbuf4ram62
Nickell Robey-ColemanCBbuf2ram31
Kevon SeymourCBbuf1car21
Ronald DarbyCBbuf4phi40
Mike GillisleeRBbuf4nwe40
Garrison SanbornCbuf1tam10
EJ ManuelQBbuf1rai10
Lerentee McCrayLBbuf1jax10
Jim DrayTEbuf0crd00
Bryson AlbrightLBbuf0crd00
Leger DouzableDTbuf3sfo2-1
Michael OlaTbuf1sdg0-1
Justin HunterWRbuf2pit0-2
Stephon GilmoreCBbuf8nwe5-3
Corey GrahamDBbuf5phi2-3
Cyrus KouandjioOTbuf4den1-3
Zach BrownOLBbuf11was7-4

With 62 points of lost AV, no team lost more than the Bilsl last year. But that doesn’t always mean much: the Rams were third with 52 points of lost AV, and the Bills and Rams both made the postseason. Even looking at 2017 AV isn’t necessarily going to tell us much: the switching players produced 55 points outside of Buffalo, the most by former players of any team last year. Another way to look at it is to see how these players did outside of their old teams. And here, Bills players did worse outside of Buffalo, at -7 points of net AV. You might be surprised, tho, that I’m not sure if this tells us much, either: the Patriots and Jaguars were two of the four teams to see their former players produce 10+ points more AV in their new homes. For New England, Jacoby Brissett, Jabaal Sheard, LeGarrette Blount, Jimmy Garoppolo, Logan Ryan, and Barkevious Mingo all produced at least 4 points of AV in 2017 on new teams. The same is true of Kelvin Beachum, Hayes Pullard, Tyson Alualu, Luke Joeckel, Prince Amukamara, and Davon House with respect to the Jaguars. But it’s not like Jacksonville or New England was any worse for the wear.

The table below shows the lost AV for each team, along with the AV produced by those players in their new homes in 2017, and the net difference. [continue reading…]

{ 0 comments }

The 2017 49ers Turned Over Half Their Starts

The 2016 49ers were not very good, finishing 2-14 with both wins coming against a bad Rams team. So perhaps it isn’t too surprising that San Francisco — with a new GM (John Lynch) and new HC (Kyle Shanahan) — decided to turn over most of the roster.

Each team has 352 starts to give out each year (22 spots over 16 games). For San Francisco, 176 of them came from players who weren’t on the active roster in 2016, and 176 came from players who were. Take a look: [continue reading…]

{ 0 comments }

How Much Would You Pay For A Receiving Yard?

There were 66 wide receivers last year who had salary cap hits of at least $2,000,000. Let’s exclude Julian Edelman, who missed the entire season due to injury, and the 18 wide receivers from the 2014-2017 Draft classes, who were all on rookie deals. That leaves 47 veteran wide receivers with cap hits of at least two million dollars last season.

I am also going to eliminate Tavon Austin from the discussion. His contract was so out of whack with reality that it only serves to bias the results in the direction of “there is not much correlation between receiving production and receiving salary.” Since I think the results in this study will find that the correlation is already pretty low between salary and production, my hunch is most people would naturally want to know how much things change (a decent amount, actually) if you remove Austin. He had the 4th-highest cap charge of any wide receiver last year and essentially zero production.

That leaves 46 veteran wide receivers. The R^2 between salary and receiving yards was 0.35 (0.25 if you include Austin), which sounds moderately high but in practice doesn’t mean much. Here’s the best fit formula:

2017 Receiving Yards = 308 + 53.0 * 2017 Salary Cap Charge (in millions)

What this means is that for every million dollars a team spent on a wide receiver last year, you would expect to get an extra 53 receiving yards. In other words, one receiving yard was worth $18,884. A wide receiver at $5M would be expected to produce 573 receiving yards; a wide receiver with a $10M cap charge should produce 838 receiving yards.

Big names like Jordy Nelson, Dez Bryant, Randall Cobb, and DeSean Jackson underperformed their lofty salaries last season. Meanwhile, Adam Thielen, Doug Baldwin, Marquise Goodwin, Kenny Stills, and Jermaine Kearse overperformed their mediocre salaries.

Is getting an extra 53 receiving yards really worth $1M? (If you include Austin, the best-fit formula is 349 + 44.3 * 2017 Salary Cap Charge, meaning you need to spend $1M to get just 44 more receiving yards). Well, part of the answer to that depends on what $1M gets you at other positions. This effect may not be linear, either. This is data snooping, but the players south of $8M appear much less correlated with salary; in other words, the difference between a $4M and an $8M player may be small, but the difference between an $8M player and a $12M player might be large.

This also doesn’t mean that elite wide receivers are overpaid.  Consider that Antonio Brown had a cap hit of $13.62M last year, which based on the formula above, means we would expect him to gain 1,029 receiving yards.  Since Brown had 1,533 receiving yards, he exceeded expectation by 504 yards.  That was the third most of any receiver: [continue reading…]

{ 0 comments }

There were 66 wide receivers with salary cap hits of at least $2,000,000 in 2017, based on data from Over The Cap. There were 67 wide receivers in 2017 who had at least 700 Adjusted Catch Yards, which is receiving yards with a 20-yard bonus for touchdowns and a 5-yard bonus for catches (for reference, Jeremy Maclin with a 40-440-3 line is the cutoff here at exactly 700 ACY). In other words, I wanted to set a bar for both salary cap hits and production that was pretty low, but not so low that the data would be overpopulated with fringe players.

There were 89 wide receivers who had either cap hits of $2M or 700 ACY in 2017. The correlation coefficient between the two variables was 0.31, indicating a moderately positive correlation but nothing more. The graph below shows those wide receivers with salary cap dollars (in millions) on the Y-Axis, and Adjusted Catch Yards on the X-Axis. The most valuable receivers would be on the bottom right (low cap hit, high production) while the least valuable would be on the upper left (high cap hit, low production). [continue reading…]

{ 3 comments }

Donald, Suh, and Great DTs Playing Together

The Rams defensive line is kind of nuts

It’s officially: as hinted at over the weekend, former Dolphin and Lions Ndamukong Suh has joined the Los Angeles Rams and will be playing alongside Aaron Donald.  Along with Michael Brockers, who has alternated between nose tackle and defensive end in the Rams 3-4 defense (after playing as a DT in the team’s 4-3 defense), the Rams now have the league’s most terrifying three-person defensive line.

On paper this is a tremendous signing, but there is some question over where Suh will line up and whether playing in a 3-4 defense alongside Donald really maximizes his value.  Which made me wonder: how often has a team had two former (or future) All-Pro defensive tackles? (Note: (the Eagles now have Haloti Ngata and Fletcher Cox, but Cox has “only” been a second-team All-Pro by the AP, although he was a first-team All-Pro in 2017 by the Sporting News and the Pro Football Writers Association).

It turns out, more often than you might think, although often it’s in a reserve role.  In fact, eight teams had three such players!

The 1996 Raiders started Russell Maryland and Chester McGlockton (1995 All-Pro) at defensive tackle, and had a 32-year-old Jerry Ball (1991 AP) and 22-year-old La’Roi Glover (2000 AP) on the bench! The 1992 Seahawks had Cortez Kennedy (1992-1994 AP) and Joe Nash (1984 AP) as starters on the inside, and an end-of-career Keith Millard (1988-1989 AP) on the bench for two games.

The other six: the 1984 49ers (Gary Johnson, Michael Carter, Louie Kelcher), 1981 Bears (Steve McMichael, Alan Page, Dan Hampton), 1974 Chiefs (Curley Culp, Buck Buchanan, Tom Keating), 1968 Chiefs (Buck Buchanan, Ernie Ladd, Curley Culp), and the 1964 and 1965 Bills (Tom Sestak, Jim Dunaway, Tom Keating).

The last time that a team had two former All-Pros on the same roster? Well, it happened twice in 2011 with Albert Haynesworth.  He began the season in New England, where he lined up next to Vince Wilfork. He was cut in mid-season and joins the Bucs, where he lined up next to Gerald McCoy. At that point in time, McCoy was not yet an All-Pro, but he would be two years later.

If we limit this to teams that had two players who had been or would be first-team Associated Press All-Pros at DT who also started at least eight games in that season, then this hasn’t happened in a decade. In 2008, Haloti Ngata and Trevor Pryce were on the Ravens, while Vince Wilfork and Richard Seymour were on the Patriots.

Among the most terrifying combinations in terms of both players actually being productive at the same time? Dan Hampton and Steve McMichael on the 1985-1986 Bears, Jerome Brown and Reggie White on the 1990 and 1991 Eagles, Louie Kelcher and Gary Johnson on the 1980 Chargers.

The table below lists all combinations where two former or future first-team All-Pro DTs according to the Associated Press were teammates and each started at least eight games. This includes a very similar Rams duo 50 years ago:

YearTeamPlayeravStarts
2008ravHaloti Ngata1616
2008ravTrevor Pryce816
2008nweVince Wilfork916
2008nweRichard Seymour815
2007nweVince Wilfork1316
2007nweRichard Seymour48
2006ravTrevor Pryce1016
2006ravHaloti Ngata816
2006nweRichard Seymour1515
2006nweVince Wilfork813
2005raiTed Washington616
2005raiWarren Sapp510
2005nweRichard Seymour1212
2005nweVince Wilfork716
2004raiWarren Sapp616
2004raiTed Washington516
2003nweRichard Seymour1614
2003nweTed Washington610
2002sfoBryant Young816
2002sfoDana Stubblefield615
2002denTrevor Pryce1016
2002denChester McGlockton715
2001sfoBryant Young1316
2001sfoDana Stubblefield716
2001denTrevor Pryce1116
2001denChester McGlockton716
1999minJohn Randle916
1999minJerry Ball510
1998minJohn Randle1516
1998minJerry Ball716
1997sfoDana Stubblefield1716
1997sfoBryant Young612
1997raiChester McGlockton916
1997raiDarrell Russell410
1996sfoBryant Young1916
1996sfoDana Stubblefield815
1995sfoDana Stubblefield1216
1995sfoBryant Young612
1995seaCortez Kennedy1116
1995seaJoe Nash511
1995raiChester McGlockton1516
1995raiJerry Ball714
1994sfoDana Stubblefield1014
1994sfoBryant Young816
1994seaCortez Kennedy1616
1994seaJoe Nash715
1994raiChester McGlockton1316
1994raiJerry Ball714
1994gnbReggie White1415
1994gnbSteve McMichael714
1993sfoDana Stubblefield714
1993sfoTed Washington612
1993seaCortez Kennedy1616
1993seaJoe Nash716
1992seaCortez Kennedy1916
1992seaJoe Nash816
1991phiReggie White1816
1991phiJerome Brown1511
1990phiJerome Brown1615
1990phiReggie White1616
1989phiReggie White1816
1989phiJerome Brown916
1988phiReggie White1816
1988phiJerome Brown715
1988chiDan Hampton1616
1988chiSteve McMichael1016
1987phiReggie White1512
1987phiJerome Brown58
1987chiSteve McMichael1412
1987chiDan Hampton48
1986chiDan Hampton1816
1986chiSteve McMichael1816
1985chiSteve McMichael1716
1985chiDan Hampton1415
1984chiDan Hampton1915
1984chiSteve McMichael916
1983chiSteve McMichael710
1983chiDan Hampton611
1981sdgGary Johnson1116
1981sdgLouie Kelcher814
1981chiAlan Page916
1981chiDan Hampton816
1980sdgGary Johnson1416
1980sdgLouie Kelcher1114
1980chiDan Hampton1116
1980chiAlan Page1016
1979chiDan Hampton716
1979chiAlan Page716
1978sdgLouie Kelcher1215
1978sdgGary Johnson714
1977sdgLouie Kelcher1012
1977sdgGary Johnson714
1976sdgGary Johnson614
1976sdgLouie Kelcher614
1976ramLarry Brooks1014
1976ramMerlin Olsen814
1975sdgLouie Kelcher513
1975sdgGary Johnson38
1975ramMerlin Olsen1214
1975ramLarry Brooks68
1974ramMerlin Olsen1014
1974ramLarry Brooks713
1974kanBuck Buchanan59
1974kanTom Keating512
1973ramMerlin Olsen1214
1973ramLarry Brooks814
1973kanBuck Buchanan914
1973kanCurley Culp912
1972kanCurley Culp814
1972kanBuck Buchanan714
1971kanBuck Buchanan1014
1971kanCurley Culp914
1970kanBuck Buchanan814
1970kanCurley Culp714
1968ramMerlin Olsen1414
1968ramRoger Brown914
{ 0 comments }
Next Posts Previous Posts