≡ Menu

Something was missing from the 2017 season: a quarterback who threw a lot of interceptions but also threw for a lot of yards. At a basic level, you might assume that these two statistics would be inversely related. After all, a bad quarterback would throw a lot of interceptions and not throw for a lot of yards, while a good quarterback shouldn’t throw many interceptions but should throw for a lot of yards.

But in a competitive environment, such absolutes rarely hold up. Some quarterbacks will have to be aggressive to be effective (high average yards per pass but also a high interception rate), while some will choose to be conservative (low average yards per pass but also a low interception rate). But in 2017, we missed that. For example:

  • Marcus Mariota ranked had the 4th worst (i.e., highest) interception rate and ranked 14th in net yards per attempt. By 2017 standards, that stands out as aggressive.
  • The quarterbacks who 5th-through-8th in interception rate all ranked below-average in net yards per attempt.  Again, these quarterbacks were not necessarily very aggressive, just not very good.
  • Ben Roethlisberger (12th worst interception rate, 7th best net yards per attempt average), Derek Carr (10th, 15th), Blake Bortles (14th, 12th), and Jameis Winston (13th, 8th) join Mariota as the only passers to rank in the bottom 15 in interception rate and top 15 in net yards per attempt.

Conversely, Tom Brady, Jared Goff, Drew Brees, and Alex Smith all had very low interception rates and very high net yards per attempt averages, with all four ranking in the top 7 of both metrics. Philip Rivers ranked 2nd in NY/A and 9th in interception rate. Case Keenum ranked 4th in interception rate and 10th in NY/A.

Really, the only two outliers when it came to great interception rates were Tyrod Taylor (1st in interception rate, 25th in NY/A) and Jacoby Brissett (tied for 6th in interception rate, 28th in NY/A).

The chart below shows the 32 qualifying passers in 2017. The Y-Axis displays net yards per attempt; the X-Axis displays interception rate.  You’ll notice a lack of any dots in the upper right section of the graph, which is where the very aggressive passers would go:

[continue reading…]

{ 31 comments }

2017 AP All-Pro Teams Announced

A few days ago, the AP announced the 2017 All-Pro teams. For the second year in a row, there was no fullback position, replaced by a “Flex” spot that can basically go to any running back, wide receiver, or tight end. This year, 38 of the 50 votes went to a running back, 8 went to a wide receiver, and 4 to a tight end. On both offense and defense there are 12 first-team All-Pros: on offense, it’s five offensive lineman, a quarterback, two running backs, two wide receivers, one flex, and one tight end. On defense, there are 2 first team edge rushers, 2 interior defenders, 3 linebackers, 2 cornerbacks, 2 safeties, and one defensive back.

The full list, below.

Offense

Quarterback

Tom Brady, New England, 47; Carson Wentz, Philadelphia, 2; Russell Wilson, Seattle, 1.

Running Backs

Todd Gurley, Los Angeles Rams, 46; Le’Veon Bell, Pittsburgh, 3; Kareem Hunt, Kansas City, 1.

Wide Receivers

Antonio Brown, Pittsburgh, 50; DeAndre Hopkins, Houston, 42; Julio Jones, Atlanta, 5; Adam Thielen, Minnesota, 3.

Flex

Le’Veon Bell, Pittsburgh, 26; Alvin Kamara, New Orleans, 9; Travis Kelce, Kansas City, 2; Kareem Hunt, Kansas City, 2; DeAndre Hopkins, Houston, 2; Julio Jones, Atlanta, 2; Rob Gronkowski, New England, 2; Jarvis Landry, Miami, 1; Tyreek Hill, Kansas City, 1; Keenan Allen, Los Angeles Chargers, 1; Todd Gurley, Los Angeles Rams, 1; Doug Baldwin, Seattle, 1.

Tight End

Rob Gronkowski, New England, 40; Travis Kelce, Kansas City, 10.

[continue reading…]

{ 4 comments }

This duo took the NFC by storm in 2011.

We know that, in general, home teams are favorites in the postseason. But home teams are almost always the favorites in the division round, because those teams are coming off of a bye. In the wild card round, it’s not unusual to see road teams favored: that didn’t happen this year, but it’s easy to see why bad division winner can be an underdog against the best wild card team. It’s happened 20 times since 1990, and in 2015, three of the four home teams were underdogs in the wild card round, and the fourth was a one-point favorite. And all four home teams lost.

The conference championship game features, in theory, the two best teams in the conference; it’s not hard to understand that sometimes, the best team isn’t the #1 seed, and they can wind up being road favorites. It’s happened eight times since 1990, mostly recently two seasons ago. The Broncos were home underdogs to the Patriots in the 2015 AFCCG and won; New England was the better team on paper but lost a H2H tiebreaker for the 1 seed. The Falcons were home dogs in the 2012 AFCCG to the 49ers and lost; San Francisco was 4 points better in the SRS than Atlanta that year, but the Falcons won the 1 seed because they had a much easier schedule than the 49ers and outperformed their Pythagorean win total. The Packers might have been the best team in the NFC in 2010, but lost the NFC North by one game to the Bears; Green Bay won the Super Bowl and was a road favorite in the 2010 NFCCG in Chicago. In short, it happens.

But what rarely happens is seeing a top two seed coming off of a bye be a home dog. In fact, since the NFL expanded to 6 playoff teams per conference in 1990 and instituted byes for the top two seeds, it’s happened just three other times. [continue reading…]

{ 1 comment }

Dan Quinn and the Atlanta Falcons pulled off a big upset on Wild Card weekend, winning 26-13 in Los Angeles against the heavily favored Rams. The win was driven in large part by special teams: Atlanta picked up 40 yards of field position on punts, Falcons kicker Matt Bryant was 4/4 on field goals, including from 51 and 54 yards away, and the Rams lost two fumbles on special teams, with one muff and one fumble by Pro Bowler Pharoh Cooper.

Special teams was the story of the game, but the narrative nearly shifted to a monumental mistake by Quinn.  With just under 6 minutes left in the game, the Falcons scored a touchdown to take a 25-13 lead.  Up by 12 with 5:54 remaining, going for 2 is the obvious choice. The difference between a 12-point lead and a 13-point lead with 6 minutes left isn’t much; meanwhile, the difference between a 13-point lead and a 14-point lead is huge.  The Rams were very unlikely to have three possessions left and to tie the game with a touchdown and two field goals, but a Los Angeles touchdown, followed by a stop, followed by another Rams TD was certainly on the table.  That would win the game if the Rams were down 12 or 13, but only force overtime if the Rams were down by 14.

Yet, remarkably, Quinn chose to kick the extra point.  Since the start of the 2012 season, there had been 12 instances where a team scored a touchdown to take a 12-point lead with less than 7 minutes left in the game.  Even overly conservative coaches mostly got this right: they went for two in 9 of 12 cases.

The three exceptions were notable:

In week 2 of the 2016 season, the Jets took a 36-24 lead over the Bills with just over four minutes remaining.  I tweeted that the Jets needed to go for 2 after scoring, was incredulous after they did not, and then hoped the Jets media would ask Bowles about it after the game. It turns out that they did, and Bowles admitted making a mistake.

Bowles on Friday said he “should’ve” gone for two in this spot. Why didn’t he?

“I was occupied doing something with the defense,” he said. “When I turned around and looked at it, that was my bust. I’ll be better going forward.”

Another example came in 2013, when (at the time) everyone’s favorite coach, Chuck Pagano, pulled off a big upset but made this same mistake.  I wrote about that at the time, too:

I can’t believe I’m writing this article. Everyone loves Chuck Pagano, but he made a pretty embarrassing blunder at the end of the Colts upset win in San Francisco on Sunday. The Colts led 13-7 when Andrew Luck scrambled for a six yard touchdown on 3rd-and-3 with just over four minutes left in the fourth quarter. Incredibly, Pagano then chose to kick the extra point, which my buddy and Colts fan Nate Dunlevy identified immediately as a terrible decision.

I wasn’t going to write a post about that decision, because, ya know, what could be more obvious than going for two when up by 12 points with just over four minutes left in the game? I mean, Jason Garrett got this right in the season opener. Being up by 14 points means two touchdowns doesn’t beat you, while there is almost no difference between being up 12 or being up 13 points.

The final example involved the Browns in a 37-24 win over Buffalo.  Cleveland recorded a pick six with just under two minutes left to take a 36-24 lead.  Maybe Rob Chudzinski was so surprised by the score that he simply made a brainfart the way Bowles did.  In some ways, the mistake was minimized, because the odds of the other team scoring two touchdowns in less than two minutes are much lower than two touchdowns in six minutes.  On the other hand, there’s literally no justification at all for not going for two in that case, because the opponent can’t have three possessions. [continue reading…]

{ 11 comments }

Post Your 2017 Playoff Predictions

Post your playoff predictions in the comments. Here are mine:

Wild Card Round

Tennessee @ Kansas City

The AFC South has sent the Colts or Texans to the playoffs each year since 2008; this year, the other two AFC South teams are going to the playoffs.  Unfortunately for Tennessee, it’s hard to find much to like about the Titans.

The Chiefs destroyed, in Houston, a better AFC South opponent on the road in this exact slot (first playoff game) two years ago. Marcus Mariota and Alex Smith both finished the year 9-6, but that’s about all they had in common.

The Chiefs biggest vulnerability is their pass defense, but that’s not something Tennessee is likely to exploit. Four months ago, Eric Decker and Corey Davis were supposed to transform the Titans passing game, but that hasn’t happened yet.  The duo had their best games of the season two weeks ago (combining for 12 receptions and 164 yards), and Tennessee will need something similar to upset the Chiefs.

In 2016, Tennessee beat the Chiefs on a last-second field goal, in a game where Smith was held to a 56.1 passer rating. If the Titans do that again, they’d be the favorites, but that’s unlikely to happen.

Prediction: Kansas City 31, Tennessee 23

[continue reading…]

{ 24 comments }

Checkdowns: 2017 League Leaders

With the 2017 season in the books, let’s run down the players who history will remember as the leaders in various key metrics. Yesterday we looked at the passing numbers from 2017, so let’s focus on other individual stats today.

Running Backs

Carries

Le’Veon Bell led the NFL with 321 carries; LeSean McCoy was second with 287 carries. Bell had 21.4 rushing attempts per game, but it was Ezekiel Elliott who led the NFL with 24.2 carries per game. In the last 10 years, only twice has a running back had at least 24 carries per game: Elliott in 2017 and his predecessor in Dallas, DeMarco Murray in 2014.

Rushing Yards

Both Todd Gurley (1,305 rushing yards) and Le’Veon Bell (1,291) sat out the final week of the season, which allowed Kansas City’s Kareem Hunt to win the rushing title with 1,327 yards. A stat that may only interest me: this marks the end of a five-season streak where an NFC RB had won the rushing crown; the last AFC RB before Hunt to do it was Maurice Jones-Drew.  And the last non-AFC South RB to do it before Hunt? LaDainian Tomlinson.

Courtesy of a six-game suspension, Elliott was limited to just 10 games this year, but he did lead the NFL in rushing yards per game with 98.3.  Hunt was fourth with 82.9.

Rushing Touchdowns

Los Angeles RB Todd Gurley led the NFL with 13 rushing touchdowns; Saints RB Mark Ingram had 12, and no other player hit double digits.

Yards per Carry

Kamara was not easy to bring down in 2017.

Saints rookie Alvin Kamara finished with a 6.07 yards per carry average, easily the most in the NFL. Among non-QBs, Patriots RB Dion Lewis was second at 4.98. Kamara is just the 9th running back to average 6.00 yards per carry on 100+ carries in a season since the merger. Here’s the full list.

First Downs

Le’Veon Bell led all rushers with 74 rushing first downs. Gurley was second with 66.

Long Runs

Kareem Hunt and LeSean McCoy tied for the lead with 12 carries of 20+ yards. Jets running back Bilal Powell led all players with 4 carries of 40+ yards.

Fumbles

Gurley led all running backs with five fumbles. Dion Lewis (180) and Powell (178) had the most carries among running backs without a fumble. [continue reading…]

{ 9 comments }

Jared Goff was the single worst quarterback in the NFL last year. He was Ryan Leaf bad — and that’s no exaggeration. Goff averaged 2.82 ANY/A in 2016, but Goff averaged 7.72 ANY/A in 2017, meaning he just completed the biggest year-over-year increase in NFL history.

Goff actually led the NFL in ANY/A in 2017, a remarkable worst-to-first journey. That’s because, by the narrowest of margins, he eclipsed Drew Brees for the ANY/A lead. The league average was 5.91 ANY/A this year, So Goff is the rare winner who was less than 2.00 ANY/A above league average.

But because he had “only’ 502 dropbacks, Goff didn’t lead the league in Value Added over Average, which is simply ANY/A minus League Average ANY/A (5.91) multiplied by number of dropbacks. The leader there? The likely MVP, Tom Brady.

The table below shows the ANY/A and Value leaders from 2017. Brees narrowly finished second in both metrics, but because Brees was throwing a lot of short passes to his remarkable running backs, and Brady reinvented himself as a deep thrower, Brady is likely your MVP pick. [continue reading…]

{ 15 comments }

Tom Brady Has Reinvented Himself Again

Tom Brady made a name for himself — and won a few Super Bowls — by orchestrating a horizontal passing game for the Patriots in the early ’00s. But after acquiring Randy Moss, Brady and the Patriots offense changed completely, as he could be seen heaving footballs down the field on a regular basis.

Post-Moss, Brady reverted to a passing game that featured a lot of intermediate passes, but Brady and the Patriots look very different in 2017. And the numbers bear that out. Brady’s average pass this season, whether being completed or not, has traveled 9.09 yards in the air. That’s really high for Brady — in fact, it’s the highest for Brady since 2006, the first year that data is available (it ranks 6th among all passers in 2017). And he’s averaging 6.96 air yards per pass on throws that are completed, which also ranks 6th in 2017 and is the 2nd (behind only 2007) best number of Brady’s career. In other words, Brady is once again throwing downfield a lot. Take a look at the graph below, which shows in blue the average air yards per pass and in red the average air yards per completed pass for Brady for each year since 2006.  The 2017 version of Brady is a lot different than the versions of Brady we’ve seen in recent years with a healthy Julian Edelman, who of course was lost for the season with an ACL tear in the preseason: [continue reading…]

{ 13 comments }

Only two teammates have ever won the AP Offensive Rookie of the Year and AP Defensive Rookie of the Year awards. That happened 50 years ago in 1967, when the Detroit selected RB Mel Farr with the 7th pick in the first round of the draft and future HOF CB Lem Barney with the 34th overall pick in the second round. As a rookie, Farr gained 1,177 yards from scrimmage in 13 games, 7th most in the NFL. Barney, meanwhile, led the NFL in interceptions, interception return yards, and interception return touchdowns, with a 10-232-3 stat line. Both made the Pro Bowl, and Barney was a 2nd-team All-Pro choice by both the NEA and NYDN.

This year’s Saints have a similar story. New Orleans went cornerback first and running back second, drafting RB Alvin Kamara with the 67th pick (3rd pick in the 3rd round) and CB Marshon Lattimore with the 11th overall selection (Utah S Marcus Williams was the second round pick). Kamara has been remarkable with 1,426 yards from scrimmage (8th in the NFL) and 12 touchdowns (tied for 3rd) in 15 games, while averaging a remarkable 6.2 yards per carry and 9.9 yards per reception. Either Kamara or Kareem Hunt will win the AP OROY award this year. Meanwhile, Lattimore has been a huge part of the Saints defensive revival: he’s a frontrunner for the AP DROY award, and is tied for 5th in the league with five interceptions, including one returned for a touchdown.

The final AV numbers from Pro-Football-Reference aren’t in yet, but since the Saints offensive and defensive numbers are both outstanding this year, and both Kamara and Lattimore made the Pro Bowl, I think it’s safe to assume that both will have at least 10 points of AV. [continue reading…]

{ 1 comment }

There have been many great running back pairs in NFL history. The standard bearers when it comes to running back pairs both played in NFL at the time the AFL was born: Jim Brown and Bobby Mitchell in Cleveland, and Paul Hornung and Jim Taylor in Green Bay. Any great running back pair needs more than one season, but when it comes to just one year of dominance — since the AFL/NFL merger — I am not sure if any pair can top what Mark Ingram and Alvin Kamara of the Saints have done this year.

Kamara is currently 4th among running backs in fantasy points using 0.5 points per reception (the middle ground between PPR and non-PPR leagues) with 252.1 fantasy points.  Meanwhile, Ingram is just behind him in 5th place with 247.6 fantasy points (awarding 1 point for every 10 yards rushing or receiving and 6 points for every touchdown).  Todd Gurley, Le’Veon Bell, and Kareem Hunt are your top three running backs with 355.3, 303.1, and 261.2 fantasy points, respectively, and then Melvin Gordon (243.7) and LeSean McCoy (231.9) are the only other running backs with over 200 fantasy points.

So no matter what Kamara and Ingram do this weekend (and the Saints are playing for the NFC South title this weekend, so the incentive is there for them to do well), they will both finish in the top 7 among all running backs. And guess what: that has never happened since the AFL-NFL merger.

In fact, just 8 times has a team had two top-10 running backs over this time.  In reverse chronological order…. [continue reading…]

{ 7 comments }

I saw an interesting tweet yesterday:

My first thought was, “No way!” But then again, the leading RB in receiving touchdowns is a pretty obscure category, so who knows. Well, it turns out McDowell is correct (at least back to 1970, which is as far as I checked; before 1970 you are dealing with much smaller leagues, anyway).

So yes, Todd Gurley really does have a running back quadruple crown: he leads all running backs in rushing yards (1,305; Kareem Hunt is second with 1,292); rushing TDs (13; Mark Ingram is second with 12); receiving yards (Alvin Kamara has 742) and receiving TDs (6; Kamara and Christian McCaffrey each have 5).  That is not going to hold up, as Gurley will rest this weekend as the Rams have clinched the NFC West but can not get the 1 or the 2 seed in the NFC.  But for now, it is pretty remarkable, if from nothing else than from a trivia perspective.

In fact, since 1970, only two running backs — Jamaal Charles in 2010 and Arian Foster in 2013 — have led all running backs in three out of those four carries. Charles ranked 3rd in rushing yards that year, Foster ranked 7th in this receiving TDs.

The table below shows all running backs since 1970 whose average rank in these four categories was 5.0 or lower. [continue reading…]

{ 1 comment }

Two years ago, I set a baseline for what a pre-season projection system should hope to accomplish. The simplest baseline of all would be to project each team to go 8-8. That would require no thought at all: a person could wake up 49 years and eight months from now and project each then-existing team in the NFL (or its successor league) to go .500 in the 2067 season. So any projection system has to beat that, at a minimum. As I wrote two years ago:

If you did that in every season from 1989 to 2014, your model would have been off by, on average, 2.48 wins per team. This is calculated by taking the absolute value of the difference between 0.500 and each team’s actual winning percentage, and multiplying that result by 16. So that should be the absolute floor for any projection model: you have to come closer than that.

Now, let’s flash back to July of this year. The USA Today published its preseason predictions in a rather provocative fashion, particularly with respect to two teams. I see a ton of preseason projections every year and forget them minutes later, so please forgive me if you feel like I am picking on the USA Today here. That is not the intent, and other publications have made more egregious errors but are not at my fingertips. But this publication picked the Patriots to go 16-0 and the Jets to go 1-15, which was rather extreme.

Upon further view of their predictions, many of them are pretty ugly. So I decided to compare those predictions to the “every team in the same” test, or the “8-8” system.

There were six teams the USA Today got really wrong, where an 8-8 projection would be at least 3.0 games closer to being accurate:

The Buffalo Bills are 8-7 (off of 0.500 by 0.5 wins); the USA Today predicted them to go 4-12 (off by 4.5 wins).
The Green Bay Packers are 7-8 (0.500 projection is off by 0.5); the USA Today predicted them to go 12-4 (off by 4.5).
The Los Angeles Rams are 11-4; an 8-8 projection would be off by 3.5 games, but the USA Today had the Rams are 4-12, off by 7.5 games.
The Oakland Raiders are 6-9 (off by 1.5); the USA Today had them at 11-5 (off by 4.5).
The Detroit Lions are 8-7 (off by 0.5); the USA Today had them at 5-11 (off by 3.5).
The Tennessee Titans are 8-7 (off by 0.5); the USA Today had them at 12-4 (off by 3.5).

You might say the loss of Aaron Rodgers shouldn’t be held against them, and that the Rams success caught everyone off guard. Both of those things are true, but we also know that superstars get hurt and surprise teams happen every year. Both of those facts should urge predictors to be more conservative in the aggregate.

The USA Today thought the Titans would be great and the Bills terrible; both are 8-7. And the USA Today had the Raiders at 11-5 and the Lions at 5-11; instead, Detroit has two more wins than Oakland. These, again, are signs that we shouldn’t be too overconfident in our preseason projections (a look at the Giants and the Rams projected wins totals would also work to that effect).

Now, there were also three teams where the USA Today beat the 8-8 system by at least 3 games.

The Indianapolis Colts were projected to go 5-11 by the USA Today; they are 3-12 (USAT off by 1.5, .500 prediction off by 4.5).
The Cleveland Browns were projected to go 4-12; they are 0-15 (USAT off by 3.5, .500 prediction off by 7.5).
The Pittsburgh Steelers were projected to go 12-4; they are 12-3 (USAT off by 0.5, .500 prediction off by 4.5).

In the case of the Colts, Browns, and Bears, predicting them to be bad — but not terrible — was the wise move. (That would have worked with the Jets, too: the 1-15 projection is now off by 4 or 5 wins, giving another win to the 8-8 system). The Steelers were projected to be very good, and that prediction was nailed. The USA Today even wins the Patriots bet as we stand right now (12-3 is closer to 16-0 than 8-8), but a more conservative approach would have been better.

Overall, the USA Today fared worse than the blind 8-8 system. The USA Today projections were closer than the 8-8 system for 13 teams. Meanwhile, the 8-8 system was closer on 15 teams, with four teams (Houston, Kansas City, Jacksonville, New Orleans) currently graded as ties. Take a look: [continue reading…]

{ 5 comments }

From 2002 to 2017, DeSean Jackson and Malcom Floyd are the two leaders in yards per reception (minimum 250 receptions). Jackson has 548 receptions for 9,487 yards, a 17.31 yards per catch average, while Floyd is at 321/5,550/17.29. We’ll skip who is #3 in yards per catch for a minute, but the next three are Torrey Smith, Eddie Kennison, and T.Y. Hilton.

Those are all pretty light players. Jackson’s weight, according to PFR (where all weights for this post were obtained), is 178 pounds. Floyd played at 201 pounds, while Smith, Kennison, and Hilton weighed in at 205, 201, and 183 pounds, respectively.

There are five players, all tight ends, who weigh over 260 pounds and had 250+ receptions since 2002: Rob Gronkowski, Kyle Rudolph, Alge Crumpler, Brent Celek, and Jermaine Gresham. Rudolph and Gresham averaged under 10 YPC for their careers, while Celek was at 12.6 and Crumpler at 12.7 (this excludes Crumpler’s 2001 season, although that doesn’t move the needle on his career YPC). Oh, and then there’s Gronk, who has a career YPC average of 15.15.

That’s… really high for a heavy man. And, make no mistake, at a listed 265 pounds, Rob Gronkowski is a heavy man. The graph below shows each player since 2002 with at least 250 receptions. On the X-Axis is each player’s yards per catch average; on the Y-Axis, their weight. Gronk is the red dot. [continue reading…]

{ 4 comments }

Carolina, Buffalo, and Exceeding Pythagenpat Results

The Buffalo Bills are still in the playoff hunt despite not being a very good team. The Bills have been outscored by 63 points so far this year, but have an 8-7 record. They’ve lost two games by 30+ points and two more by 20+ points, but a 5-2 record in one-score games has Buffalo still in the playoff hunt (the Bills are in with a win in week 17 and either a Ravens loss or losses by both the Titans and Chargers).

The Carolina Panthers are 8-1 in one-score games, the best record in the NFL. Carolina may be a very good team, but the Panthers are just 3-3 in games decided by more than 8 points. Carolina has a Pythagenpat winning percentage of 0.592, which is more in line with a 9-6 team than an 11-4 team.

The table below shows the Pythagenpat winning percentages for each team this season. The Bills and Panthers have exceeded “expectations” by the largest amount this year when it comes to actual winning percentage vs. Pythagenpat winning percentage. The biggest underachievers? The Browns, Bucs, Jaguars, and Chargers. [continue reading…]

{ 1 comment }

There’s no dancing around the issue of Cleveland’s winless season.

On Thursday, I noted that Jimmy Garoppolo had joined rare company by beginning his career with a 5-0 start.  In the comments to that post, Mark Growcott commented that Browns rookie Deshone Kizer has begun his career with an 0-13 start.  Cleveland, of course, is 0-14 (Kevin Hogan started one game), with Kizer undoubtedly playing a large role in those failures. It may not be his fault per se — i.e., one could argue he’s too green to even be playing — but his production has been abysmal. He’s averaging 3.50 ANY/A this season, easily the lowest in the NFL.

Mark wanted to know if that was the worst losing streak to begin a career. The answer is… yes! Jack Trudeau like Kizer, was a mid-second round pick. Trudeau played at Illinois and was drafted by the Colts in 1986.  Indianapolis was not very good back then, and neither was Trudeau, who went 0-11 as a starter during his rookie season.  In 1987, Trudeau lost the team’s first game, but then after the players’ strike ended, he came back and helped the Colts beat the Patriots in late October for the first win of his career. Trudeau set the record by losing his first 12 starts, until Kizer broke that mark on Sunday with a loss to the Ravens.

Kizer is one of just 9 quarterbacks to begin his career with an 0-10 record or worse. Jack Trudeau was the only one to start 0-12, while Troy Aikman and Stan Gelbaugh both had 0-10 starts.

Derek Carr began his career with an 0-10 start just four seasons ago. So too did Brodie Croyle, Harry Gilmer, Zach Mettenberger, and Warren Moon. Rick Norton, Dan Orlovsky, and Norm Snead began their careers with 0-9 starts.

Cleveland is 0-14 for a lot of reasons, but as you can suspect, much of it can come down to the team’s passing offense and passing defense. In just one of 14 games this season have the Browns won the ANY/A battle against their opponent: [continue reading…]

{ 5 comments }

In week 3, the Jaguars blew out the Ravens in London, 44-7, producing a Game Script of 22.6. That was the biggest Game script of the season, until week 15. On Sunday, the Rams destroyed the Seahawks, 42-7 in a game that was over at halftime. Los Angeles seven first half drives ended as follows: field goal, field goal, touchdown, interception, touchdown, touchdown, touchdown. Seattle’s first half drives ended as follows: fumble, punt, punt, punt, punt, fumble, punt, end of half.

The Rams recorded the biggest Game Script of the season at +23.4, but Los Angeles wasn’t alone. The third and fourth biggest Game Scripts of the season also came on Sunday. The Jaguars, again, were the big rollers: Jacksonville beat Houston 45-7 and recorded a Game Script of +21.7, thanks to jumping out to a 31-0 halftime lead. And Minnesota took a 24-0 lead into the locker room against Cincinnati, and a 34-0 lead before finally winning 34-7. The Vikings posted a Game Script of +20.9, one of just six games this year with a Game Script of +20.0.

The full Game Scripts from week 15, below: [continue reading…]

{ 0 comments }

Two years ago, after week 15 of the regular season, I noted the following:

Antonio Brown has 1,586 receiving yards, most in the NFL, which puts him on pace for 1,813 receiving yards this season.

Adrian Peterson has 1,314 rushing yards, most in the NFL, which puts him on pace for 1,502 rushing yards in 2015.

That’s pretty weird.  In general, the rushing leader usually gains more rushing yards than the receiving yardage leader picks up through the air.  From 1970 to 2014, the receiving yards leader  “outgained” the rushing yards leader in only 10 of 45 seasons.  And in only three of those years did the receiving leader “win” by more than 100 yards: in 1999 (Marvin Harrison had 1663 receiving yards; his teammate Edgerrin James had 1553 rushing yards), 1990 (Jerry Rice over Barry Sanders, 1502 to 1304), and 1982 (Wes Chandler over Freeman McNeil in the strike-shortened season, 1032to 786). On a per-game basis, it’s tough to beat what Chandler did, but Brown is on pace to become the first receiving leader since the merger (in fact, the first in the NFL since 1952) to “outgain” the rushing leader by over 300 yards.

By the end of the year, Julio Jones led the league in receiving with 1,871 yards, while Peterson rushed for “only” 1,485 receiving yards. So that was an odd year where the receiving leader finished with nearly 400 more yards than the rushing leader.

Last season, T.Y. Hilton led the NFL with 1,448 receiving yards, while Ezekiel Elliott had 1,631 rushing yards despite missing one game.

But this year? Well, Brown is at it again.  Through 13 games, Pittsburgh had the leading rushing and receiver in the NFL.  Brown had a whopping 1,509 receiving yards while Le’Veon Bell led the NFL with “only” 1,105 rushing yards. That was a massive 404 yard difference after just 13 games!  In game 14 (which, of course, takes place in week 15), Brown was injured and is likely out for the rest of the regular season.  So through 15 games, Bell has 1,222 rushing yards and Brown has 1,533 receiving yards.

There’s a chance Brown winds up leading the NFL without taking another snap this year, or that DeAndre Hopkins passes him (1,313 yards with two games to play).  Either way, this is likely another season where the receiving leader will outgain the rushing leader.

But also noteworthy: right now, the leading receiver on 22 of the NFL’s 32 teams has more yards than that team’s leading rusher.  The Bills (LeSean McCoy) rushing leader has 600 more yards than the team’s receiving leader (Charles Clay), making them one of just 7 teams where the rushing leader has 100+ more yards than the receiving leader. Three teams — the Cardinals, Vikings, and Texans — have their receiving leader with 500+ more yards than their rushing leader. Take a look: [continue reading…]

{ 5 comments }

Through 15 weeks, the league-wide Adjusted Net Yards per Attempt average is 5.99, representing a small turn down from the high water marks of the past few seasons.

Tom Brady is second in the NFL in ANY/A at 7.72, just a hair behind Drew Brees (7.75). But because Brady has 52 more dropbacks than Brees this season, that makes Brady the better MVP candidate. Brady leads the NFL in passing value added, which is simply ANY/A minus league average ANY/A, with that difference multiplied by number of dropbacks. The table below shows the amount of passing value added by the 35 quarterbacks this season with 200 pass attempts. [continue reading…]

{ 40 comments }

Through 14 games, the Jacksonville Jaguars may be the best team in the NFL. Jacksonville ranks first by an enormous margin in pass defense, which is the main driver of the team’s success. The Jaguars are 0.90 ANY/A better than the second-ranked pass defense (Baltimore), and 1.37 ANY/A better than the third-ranked pass defense (Chargers). Jacksonville’s rush defense on a per-carry basis ranks just 29th, but the Jaguars are still the best defense in the NFL.

To measure defenses on per play basis, I took a weighted average of a defense’s yards per rush allowed (40%) and adjusted net yards per attempt allowed (60%). The Jaguars allow 3.87 yards per play, the best in the league by a good margin, followed by the Ravens, Vikings, and Eagles.

We can do the same thing for offense. Jacksonville ranks 8th in yards per carry and 12th in ANY/A, which may surprise folks, but Blake Bortles has been white hot the last three weeks. The best offense belongs to the Saints, who rank 1st in ANY/A (by a razor thin margin of the Patriots) and 2nd in YPC (by a razor thin margin behind the Chiefs). The Saints have the best offense in the NFL on a per-play basis (using the same 40%/60% split) and the 11th-best defense, good enough for New Orleans to rank as the 3rd best team overall.

But Jacksonville ranks 9th in offense, and with that pass defense, that’s enough to put the team in first place on a per-play basis overall. Take a look: [continue reading…]

{ 16 comments }

Bell leads the NFL in rushing yards and rushing attempts.

Steelers running back Le’Veon Bell is having another sensational season. Since 2014, Bell is averaging 91.3 rushing yards and 46.5 receiving yards per game. Bell actually leads all players in yards from scrimmage since 2014 despite missing 14 games! He’s averaging 137.8 yards from scrimmage per game since 2014; Ezekiel Elliott is second at 129.9, but he only played in 23 games. If you exclude Elliott, the next two players are wide receivers (Antonio Brown and Julio Jones) at 106.3 and 104.3, respectively. In fact, excluding Elliot, no other running back has averaged even 100 yards from scrimmage per game; LeSean McCoy is second to Bell at 99.9 yards per game.

Bell is not just a yards from scrimmage star, however. As of yesterday, he was also leading the NFL in rushing yards, Bell is at 1,105 rushing yards, ahead of Kareem Hunt (1,046), Todd Gurley (1,035), Jordan Howard (1,032), and McCoy (1,007). Last night, Hunt rushed for 155 yards in a win over the Chargers, so he is now ahead of Bell (the Steelers play the Patriots today). Elliott is at 97.9 rushing yards per game, a bit ahead of Bell (85.0), but Elliott has missed five (soon to be six) games due to suspension.

Assuming Bell does go on to win the rushing crown, he may in fact join a pretty rare group: leading the NFL in rushing yards despite averaging fewer than 4.0 yards per carry. Right now, Bell is at 3.90 yards per carry, and there’s a good chance his YPC either improves or if it doesn’t, he doesn’t wind up winning the rushing crown. But if he does win the rushing title, Bell would have the lowest yards per carry average of any rushing champion since Football Perspective favorite Eddie Price back in 1951.

The table below shows the rushing yards leader in each season in the NFL, AFL, and AAFC since 1932.

Running BackYearTeamLgRushYardsYPC
Whizzer White1940DETNFL1465143.52
Doug Russell1935CRDNFL1404993.56
Eddie Price1951NYGNFL2719713.58
Whizzer White1938PITNFL1525673.73
Bill Paschal1944NYGNFL1967373.76
Bill Paschal1943NYGNFL1475723.89
Cliff Battles1932BOSNFL1485763.89
Floyd Little1971DENNFL28411333.99
Christian Okoye1989KANNFL37014804.00
Tuffy Leemans1936NYGNFL2068304.03
Cliff Battles1937WASNFL2168744.05
Bill Dudley1946PITNFL1466044.14
Edgerrin James1999INDNFL36915534.21
Charles White1987RAMNFL32413744.24
Cookie Gilchrist1964BUFAFL2309814.27
Eric Dickerson1988INDNFL38816594.28
Emmitt Smith1991DALNFL36515634.28
O.J. Simpson1972BUFNFL29212514.28
Bill Dudley1942PITNFL1626964.30
Paul Robinson1968CINAFL23810234.30
Steve Van Buren1949PHINFL26311464.36
Gale Sayers1969CHINFL23610324.37
Pug Manders1941BKNNFL1114864.38
Edgerrin James2000INDNFL38717094.42
George Rogers1981NORNFL37816744.43
Eric Dickerson1986RAMNFL40418214.51
Alan Ameche1955BALNFL2139614.51
Jim Nance1967BOSAFL26912164.52
Adrian Peterson2015MINNFL32714854.54
Curtis Martin2004NYJNFL37116974.57
Jim Brown1959CLENFL29013294.58
Emmitt Smith1992DALNFL37317134.59
Earl Campbell1979HOUNFL36816974.61
Jim Brown1961CLENFL30514084.62
Marcus Allen1985RAINFL38017594.63
Eric Dickerson1983RAMNFL39018084.64
Steve Van Buren1947PHINFL21710084.65
Jim Brown1957CLENFL2029424.66
Jim Musick1933BOSNFL1738094.68
LaDainian Tomlinson2007SDGNFL31514744.68
Maurice Jones-Drew2011JAXNFL34316064.68
Steve Van Buren1948PHINFL2019454.70
Emmitt Smith1995DALNFL37717734.70
DeMarco Murray2014DALNFL39218454.71
Billy Cannon1961HOUAFL2009484.74
Larry Brown1970WASNFL23711254.75
Priest Holmes2001KANNFL32715554.76
Dickie Post1969SDGAFL1828734.80
Earl Campbell1978HOUNFL30214504.80
Rick Casares1956CHINFL23411264.81
Ricky Williams2002MIANFL38318534.84
Adrian Peterson2008MINNFL36317604.85
Jim Nance1966BOSAFL29914584.88
Arian Foster2010HOUNFL32716164.94
Leroy Kelly1968CLENFL24812395.00
Paul Lowe1965SDGAFL22211215.05
Barry Sanders1996DETNFL30715535.06
Spec Sanders1946NYYAAFC1407095.06
Ezekiel Elliott2016DALNFL32216315.07
Shaun Alexander2005SEANFL37018805.08
Clem Daniels1963OAKAFL21510995.11
Barry Sanders1990DETNFL25513045.11
LeSean McCoy2013PHINFL31416075.12
Cookie Gilchrist1962BUFAFL21410965.12
Terrell Davis1998DENNFL39220085.12
Leroy Kelly1967CLENFL23512055.13
Jim Brown1964CLENFL28014465.16
O.J. Simpson1976BUFNFL29015035.18
Earl Campbell1980HOUNFL37319345.18
Freeman McNeil1982NYJNFL1517865.21
LaDainian Tomlinson2006SDGNFL34818155.22
Emmitt Smith1993DALNFL28314865.25
Joe Perry1953SFONFL19210185.30
Jamal Lewis2003BALNFL38720665.34
Jim Brown1965CLENFL28915445.34
Otis Armstrong1974DENNFL26314075.35
Gale Sayers1966CHINFL22912315.38
Jim Taylor1962GNBNFL27214745.42
Walter Payton1977CHINFL33918525.46
O.J. Simpson1975BUFNFL32918175.52
Eric Dickerson1984RAMNFL37921055.55
Chris Johnson2009TENNFL35820065.60
Abner Haynes1960DTXAFL1568755.61
Barry Sanders1994DETNFL33118835.69
Dan Towler1952RAMNFL1568945.73
Bill Osmanski1939CHINFL1216995.78
Marion Motley1950CLENFL1408105.79
Steve Van Buren1945PHINFL1438325.82
Jim Brown1960CLENFL21512575.85
Jim Brown1958CLENFL25715275.94
Adrian Peterson2012MINNFL34820976.03
O.J. Simpson1973BUFNFL33220036.03
Joe Perry1954SFONFL17310496.06
Barry Sanders1997DETNFL33520536.13
Marion Motley1948CLEAAFC1579646.14
Spec Sanders1947NYYAAFC23114326.20
Jim Brown1963CLENFL29118636.40
Joe Perry1949SFOAAFC1157836.81
Beattie Feathers1934CHINFL11910048.44

In the last 20 years, Edgerrin James has the two lowest YPC averages of any rushing leader.  Before James, the lowest YPC average belongs to Christian Okoye, who averaged exactly 4.00 yards per carry in 1989.  Okoye narrowly avoided being one of just two running backs since the AFL-NFL merger to lead the NFL in rushing with a sub-4.00 YPC average. That lone honor therefore belongs to Floyd Little, who averaged 3.99 YPC in 1971.

{ 3 comments }

Yesterday, I noted one of the counter-intuitive facts of the 2017 season: the best defenses by yards per carry allowed weren’t very good teams, while the worst defenses by yards per carry allowed were good teams. The correlation coefficient between winning percentage and yards per carry allowed “should” be negative, but was in fact a positive 0.37.

What about for offenses? Well, the correlation coefficient is a positive 0.26, which is more intuitive. It means the teams that average more yards per carry also average more wins, although the relationship isn’t particularly strong. The best 8 teams by YPC average have won 54% of their games, while the worst 8 teams have won 45% of their games. The Steelers are a noteworthy example, as Pittsburgh is 11-2 but ranks 28th in yards per carry. The Bears and Browns rank 5th and 7th in yards per carry, but have combined to go 4-22.

But in general, there is a positive correlation in 2017 between being good at gaining yards per rush and winning teams. So the “reasons” you may have used to justify why bad teams were good at yards per carry allowed don’t hold much water here. [continue reading…]

{ 1 comment }

Regular readers know that I am not a big fan of yards per carry to measure a running game, on either the team or the individual level. That also goes for team defense. If you look at this year’s standings, though, and compare a team’s record to its yards per carry allowed, you will in fact notice a correlation.

And a moderately strong one at that. The correlation coefficient between a team’s winning percentage in 2017 and that team’s yards per carry allowed is 0.37. That indicates a positive correlation between the two stats, but… well, there isn’t supposed to be a positive correlation. This means that allowing more yards per rush is correlated with winning more games. See for yourself: [continue reading…]

{ 15 comments }

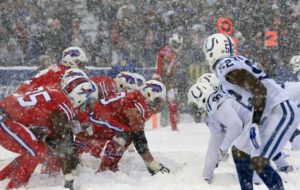
Week 14 Game Scripts: Bills and Colts Run In The Snow

A beautiful day for a photographer

There have been 208 games so far this season. Prior to week 14, the Chicago Bears, in a 27-24 win over Baltimore, had the lowest pass ratio of any team in a game at 27.6% (21 passes, 55 runs). Playing in the snow in Buffalo, the Bills rushed 51 times against 16 pass plays, for a 23.9% pass ratio. That’s the lowest pass ratio since a Monday Night Football game in 2014, when the Jets went back to Geno Smith as quarterback and basically didn’t let him throw the ball unless he had to. In modern times, teams just don’t run on 76% of their plays: the only other game since 2010 where that happened involved Tim Tebow, of course.

But wait, there’s more. The Colts ran on two-thirds of their plays, easily the lowest pass ratio of any team that lost its game this year; no other team had passed on fewer than 47 percent of its plays and lost. This was the most run-heavy game of the year and it wasn’t particularly close.

In fact, this was the most run-heavy game since the 2006 game between the Falcons and Panthers where Carolina rolled out a Wildcat offense with Jake Delhomme sidelined and starting QB Chris Weinke playing with a bum shoulder, the Panthers and Falcons combined for 71 rushing attempts and just 27 passes (plus six sacks). But the combined 97 runs for the Bills and Colts (helped by 15 overtime runs) was the most in a game since 1981 between the Chiefs and Bears that also went to overtime and was played in cold and wet conditions. The full week 14 Game Scripts, below: [continue reading…]

{ 5 comments }

Four years ago, I wrote an article about the — at the time — young and improving Seattle pass defense. It’s hard to compare modern defenses to what we saw in the ’70s, as the game has changed significantly in the favor of more impressive passing numbers.

But what we can do is compare each pass defense in each season to each other pass defense. In 2013, the Seahawks allowed 3.19 Adjusted Net Yards per Attempt, while the league average was 5.98. That’s a difference of 2.79 ANY/A, and the standard deviation among the 32 pass defenses was 0.95 ANY/A. In other words, the Seahawks were 2.93 standard deviations better than average (2.79 divided by 0.95).

This year, the Jaguars are allowing 3.52 ANY/A, and the league average is an almost identical 6.01. So Jacksonville is 2.49 ANY/A better than average, and given the standard deviation of 0.94, it means the Jaguars pass defense has a Z-Score of 2.65.

That would rank as the 6th best since 1950, behind the ’02 Bucs, ’88 Vikings, ’70 VIkings, ’13 Seahawks, and ’82 Dolphins. The 3.52 ANY/A average is the lowest since the 2013 Seahawks, and the second lowest since the 2009 Jets (who played in a less friendly passing environment; the league average was 5.74 ANY/A).

If you look at the NFL passing statistics through 13 games (well, 12 for the Dolphins and Patriots), it’s easy to see why the Jaguars pass defense is so good. It’s because they’re great at literally everything. The table below shows the team’s rank in every major category: top-5 finishes are in pink, and #1 finishes are in red with white font. [continue reading…]

{ 6 comments }

In week 13, the Cowboys, Packers, and Jets were run-happy teams, finishing with the three most run-oriented play ratios of the week. After accounting for Game Script, the Jets were really run-heavy: New York finished with a negative Game Script but finished with 49 runs! The Jets finished tied for the most rushing attempts since 1983 in a game (excluding OT) where the opponent scored 30+ points. The other time? The remarkable Jerome Harrison/Josh Cribbs game against the Chiefs from 2009, which I wrote about at the time.

The Cowboys finished with 23 pass plays and 42 runs in a blowout win over the Redskins. Dallas led most of the way against Washington, and the Cowboys are happy to institute a run-heavy plan whenever the Game Script allows.

The Packers led early against the Bucs, but Tampa Bay took a 4th quarter lead and the game went deep into overtime. Brett Hundley had 24 dropbacks, while Packers running backs had 22 carries and Hundley himself had 7 carries. The main reason for the run-heavy game plan? Hundley was a disaster throwing the ball, gaining 77 net yards on those 24 dropbacks with an interception. Since 1979, the Packers have won just one other game with so few passing yards: this disaster of a game in 1991 against the 1-10 Colts.

The full week 13 Game Scripts below: [continue reading…]

{ 1 comment }

The Jacksonville Jaguars have what appears to be a historically dominant defense this year (more on this later in the week). But here’s a simple way to look at it: Jacksonville is allowing just 8.0 points per game in wins this season, and has won just one game where it allowed more than 10 points. The Ravens have had a similar run of success (3 of the team’s 7 wins have come in shutouts) and the Giants have won just two games (but the defense played well in both); the other teams have all allowed an average of 13 points per game or more in wins. You can see how many points each team has allowed in wins and losses this season here.

But I think we are all a bit surprised to see a Blake Bortles led team sport an 8-4 record, and it would hardly be surprising to see the Jaguars win 10 or 11 games this year (Houston and San Francisco are still on the schedule). So when we look back and say how the heck did this happen, well, obviously the defense dominating in wins played a huge role. How huge?

Among quarterbacks since 1950 to win at least 6 games in a season, only 58 played on teams that allowed fewer than 10 points per game in wins. Of those 58, 13 played between 1950 and 1969, another 16 played from 1970 to 1977, and another 9 played from 1978 to 1989.

That means just 20 played from 1990 to 2016, and only 8 from 2002 to 2016. That’s about one every two years, and right now, Bortles and Joe Flacco are poised to join the list. When you look back and see that Kyle Orton once won 10 games, or Mark Sanchez had a winning record, or a 37-year-old Jeff Garcia went 8-5, well, this list helps clarify things. [continue reading…]

{ 9 comments }

With the conference championship games in the books, it’s time to look at the final regular season results. The 4 playoff teams — Clemson, Oklahoma, Georgia, and Alabama — rank in the top 7 of the final ratings. The other 3 teams? They’re all in the Big 10, a conference that sent zero teams. [continue reading…]

{ 3 comments }

Yesterday, I noted that in 2017, teams that outrush their opponents have won 71% of games this season.  That’s higher than the rate last season, but it’s generally in line with winning percentages over the last few years.  In fact, for just about all of pro football history, teams have won around 73% of their games, plus or minus 5%.  But if you look closely enough, you can see a bit of a decline over time. Take a look: [continue reading…]

{ 5 comments }

This year, teams are 126-51 when outrushing their opponents, for a 0.712 winning percentage. In the abstract, that doesn’t mean much, and I’ll take a historical look at this data tomorrow. But what about teams this year?

The 10-1 Eagles rank 2nd in rushing yards and 1st in rushing yards allowed, thanks to a dominant run defense and an offense that is usually playing with the lead. The Eagles have outrushed their opponents in 9 straight games, but in week 1 the Eagles beat Washington despite being outrushed 64-58, and in week 2, the Eagles lost to the Chiefs and were outrushed 112-107. The table below shows how often each team has outrushed its opponents this year: [continue reading…]

{ 1 comment }

Joe Flacco is currently averaging just 8.2 yards per completion this year. That would be the lowest in NFL history among players with at least 100 completions. Flacco, who once had a reputation as one of the game’s best deep throwers, is now completing passes for less yards than anyone ever has.

The Ravens rank 18th in the NFL in completions and yet 32nd in passing yards. The Ravens rank 8th in completion percentage and but 32nd in yards per attempt! That is remarkable. Since 1970, here are the teams that ranked at least 18 slots slower in yards per attempt than completion percentage: [continue reading…]

{ 3 comments }
Next Posts Previous Posts