≡ Menu

Week 12 Game Scripts: Goff, Wentz, Pass To Victory

The Eagles and the Rams were the two most pass-happy teams of week 12. For Philadelphia, Carson Wentz (and Nick Foles) still had 40 dropbacks in a blowout against the Bears; Eagles running backs combined for only 24 carries despite the game being out of reach for most of the day. Philadelphia had the largest Game Script of the week and also the 5th most pass-happy performance among the 16 winning teams.

In Los Angeles, Jared Goff and the Rams had the most pass attempts and the highest pass ratio of any winning team in week 12; this despite a +7.0 Game Script. This was likely because Goff and the passing attack was very successful, in part because the Saints were down their starting two cornerbacks.

The full week 12 Game Scripts below: [continue reading…]

{ 0 comments }

As it turns out, having Ben Roethlisberger, Philip Rivers, and Tom Brady causes teams to be pretty pass-happy.

In week 11, the Steelers, Chargers, and Patriots all were very pass-happy. Pittsburgh passed on 70 of its plays despite blowing out the Titans, winning by 23 points with a +8.8 Game Script. The Chargers had the biggest Game Script of the week at +20.1, but still passed more often than they ran. There have only been 22 games in history where a team led by 28 points after 2 quarters and after 3 quarters and passed more often than they ran; the last 11 prior to this game all featured Hall of Fame quarterbacks. Speaking of Hall of Fame quarterbacks, the Patriots just became the 4th team to pass on over 65% of plays despite leading by 14+ at halftime and 28+ after three quarters, and one of those teams was the 1999 Panthers in week 17 who kept passing to attempt to run up the score to make the playoffs.

The full week 11 Game Scripts below: [continue reading…]

{ 2 comments }

Carson Wentz and Winning It All On Your First Try

Carson Wentz and the Eagles are 10-1, and are the frontrunners to earn the #1 seed in the NFC and win the conference. Once we get to the playoffs, though, you can imagine what a common refrain will be:

Yes, Wentz and the Eagles are good, but they are unproven in the playoffs!

So, is that a meaningful criticism? Let’s leave out that the quarterbacks of the other two best teams in the NFC are Case Keenum (or Teddy Bridgewater) and Jared Goff, as the NFC playoff field will still likely see Drew Brees and a combination of Cam Newton, Matt Ryan, Russell Wilson, and Matthew Stafford. Here’s the real question: how likely is a QB to win a Super Bowl his first time making the playoffs?

You may be surprised to learn that ten quarterbacks have won the Super Bowl in their year they started their first playoff game (and another ten made it to the Super Bowl and lost).

The list, hidden in spoiler tags for those who want some trivia:


To be fair, only a few of those would count as young funs. Plunkett and Theismann were both 33, Staubach and Hostetler were 29, and Warner was 28. McMahon and Aikman were both 26 but in their 4th year (and Aikman played in a playoff game in reserve in his third year), but Brady, Montana, and Namath certainly qualify as “Wentz-like” when it comes to age and experience.

But what about the hosts of young stud quarterbacks that haven’t won a Super Bowl? In other words, if Brady/Montana/Namath are the 3 positive examples, how many negatives ones are there? There are only 9 quarterbacks who started their first playoff game at the age of 25 of younger and also were on the team that won (or tied for) the most games in their conference. In reverse order…

  • Dak Prescott, as a 23-year-old rookie led the #1 seed Cowboys into the playoffs in 2016, but Dallas lost after the bye to the Packers. Prescott played well in that game, however.
  • A.J. McCarron technically makes the list, as he started a playoff game in place of Andy Dalton. The Bengals lost that game to the Steelers (which was arguably not McCarron’s fault), but given that he was a backup, he doesn’t feel like a great comparison.
  • In 2004, another Pennsylvania young gun took the country by storm: Ben Roethlisberger and the Steelers went 15-1 that year in Roethlisberger’s rookie season at age 22. Roethlisberger struggled in two playoff games, particularly in the loss to the Patriots in the first half of the AFC Championship Game (two first half interceptions, including a pick six, as the Steelers were held to 3 points).
  • In 1986, Doug Flutie started his first playoff game for the Bears in a McCarron-esque situation (he started just one game in the regular season).
  • In 1983, a rookie Dan Marino made the postseason for the 12-4 Dolphins at the age of 22. He lost his first playoff game, although he played pretty well and had a 3-point lead late in the 4th quarter.
  • In 1981, Montana made the playoffs with the 49ers, who had the #1 seed. San Francisco won all three games.
  • In 1975, Ron Jaworski started a playoff game for the Rams in another McCarron/Flutie-esque situation; starter James Harris was injured in the second-to-last regular season game. Jaworski won his only start, although he played most of the NFC Championship Game against the Cowboys, which was a bloodbath.
  • Finally, we have Bob Lee for the 1971 Vikings.  This was another McCarron/Flutie/Jaworski situation: Lee went 3-1 as the Vikings starter due to injuries in 1971, got the start in the playoff game against the Cowboys, and imploded.

So if you are an Eagles fan, yes it’s pretty rare for a young quarterback to win the Super Bowl.  But it’s also pretty rare for a young quarterback to guide his team to the best record in his conference: only Prescott, Rivers, Roethlisberger, Marino, and Montana have done that.  Of that bunch, none of them played badly except for Roethlisberger, with some bad luck (including facing an all-time great QB and/or blowing a fourth quarter lead) ending the seasons for Prescott, Rivers, and Marino.

In the last 20 years, Cam Newton, Matt Ryan, Daunte Culpepper, Donovan McNabb, and Peyton Manning have been young quarterbacks who first led their team to the playoffs in a year where their team finished one game behind the conference leader in wins.  Those stories aren’t quite as impressive.   In general, though, being on the best team in a conference is a pretty good place to start.

{ 9 comments }

When the Los Angeles Chargers started the season 0-4, it was tempting to think that the season was over. But, as I cautioned, not all 0-4 teams are created equally. And while only one team had ever gone from 0-4 to the playoffs (ironically, the Chargers in 1992), that was a little misleading. Most 0-4 teams don’t make the playoffs because of the 0-4 start *and* because they are bad teams. But if the team is a good team, an 0-4 start is not necessarily a death sentence.

Los Angeles is proving that to be the case. Right now, the Chargers rank 7th in the NFL in Adjusted Net Yards per Attempt, and 4th in Adjusted Net Yards per Attempt allowed. The Chargers rank 3rd in the NFL in ANY/A Differential — the difference between those two statistics — and rank 1st in the AFC in that category. Take a look: Take a look: the Y-Axis shows each team’s winning percentage, while the X-Axis displays ANY/A differential.
[continue reading…]

{ 1 comment }

Yesterday, I appeared on the Wharton Moneyball Podcast on Sirius XM. It is available on SoundCloud here:

https://soundcloud.com/user-780849378/112217-wharton-moneyball

My segment starts at 31:25.

{ 0 comments }

Every year, I look at the least-conforming games in the NFL. What do I mean by least-conforming? Well, let’s use the Titans trip to Jacksonville in week 2 this season as an example. Tennessee has an SRS of -5.1 this year, while the Jaguars have an SRS of +9.3. Given that the game was in Jacksonville, we would expect the Titans to lose by 17.4 points, assuming 3 points for the home team. In reality, the Titans won by 21 points, a swing of 38.4 points! That was the “weirdest” game of the year.

The Titans were also in the second least-conforming game of the season. Facing a Deshaun Watson Texans team, the Titans traveled to Houston and lost by a whopping 43 points. The Texans — thanks in part, of course, to several non-Watson games — have an SRS of -0.4. So at home against Tennessee, we would have expected the aveage Texans team to win b 7.8 points, not 43 points. That difference of 35.2 was one of just three games where the difference between the actual result and expected result exceeded 30 points. [continue reading…]

{ 0 comments }

In 2006, playing for the Detroit Lions, quarterback Jon Kitna was responsible for every pass attempt by the team. He wound up throwing for 4,208 yards, and ran for another 156 yards. The Lions, being a terrible 3-13 team, finished 32nd in rushing attempts (because they were always losing) and 2nd in pass attempts (because they were always losing).

So you won’t be surprised to see that the Lions threw for a lot of yards (7th most in the NFL) and ran for not many yards (last). And since Kitna took every passing attempt, well, Kitna was responsible for most of the Lions total yards. In fact, the 4,364 yards he totaled wound up representing 81.7% of the Lions 5,337 team yards from scrimmage. That is the most in a single season by any player in NFL history… until, maybe, now.

Here’s a good tip: if you see a stat that says Superstar X has the most Y in history, and it doesn’t tell you who currently has the most Y in history, there’s a good chance it’s a player who isn’t very good. (Also, and this is a more rare rule: if a stat says since X date, it usually means another player had a better season before X date. That’s not the case here; the “in the Super Bowl era” modifier was not necessary.)

Wilson has all 2,543 passing yards thrown by the Seahawks this year, and he also leads the team in rushing. Wilson has 290 rushing yards, so he’s accounted for 2,833 yards for Seattle this year, or 82.1% of the team’s 3,443 yards through ten weeks.

Below are the current list of single-season leaders in percentage of team yards: [continue reading…]

{ 12 comments }

Adjusted Completion Percentage, Part 2

Last summer, I discussed that while completion percentage is a bad statistic, there’s one simple way to improve the metric: include sacks in the denominator.

If a quarterback takes a sack, that is *worse* than an incomplete pass, but it is *better* for the quarterback’s completion percentage. That is Just Plain Wrong.

As it turns out, this really impacts Peyton Manning and, to a lesser extent, Drew Brees. In 2003, Manning led the NFL in both completion percentage (67.0%) and adjusted completion percentage (64.9%). Technically, Manning didn’t win any other completion percentage crowns, although PFR gives him a tie in 2012. [1]Technically, he lost it to Matt Ryan that year once you go out to two decimal places, 68.62% to 68.61% (although if you include sacks in the denominator but keep the minimum at 224 passing plays, … Continue reading However, he won the adjusted completion percentage crown a whopping five more times in his career: 2004, 2006, 2008, 2012, and 2013.

Brees has three completion percentage crowns (a fourth may come this season), but two more adjusted completion percentage titles. From 2003 to 2016, Manning won six AC% titles, Brees won give, and the rest of the league (Cousins, Brady, Palmer) won just three. In fact, from the six-year period covering 2008 to 2013, Manning and Brees won all of the adjusted completion percentage crowns.

The full list of leaders in each year since the merger are presented below, along with where that quarterback ranked in raw completion percentage (using a minimum of 224 passing plays per 16 team games for both metrics): [continue reading…]

References

References
1 Technically, he lost it to Matt Ryan that year once you go out to two decimal places, 68.62% to 68.61% (although if you include sacks in the denominator but keep the minimum at 224 passing plays, Alex Smith was the completion percentage champion in 2012).
{ 2 comments }

Week 10 Game Scripts: Saints Stick To the Ground Game

The Broncos, Saints, Packers, and Steelers were your run-happy teams of week 10.

Denver made the quarterback switch to Brock Osweiler, which is a good reason why they decided to be run-happy. Osweiler had 33 pass attempts, while Broncos running backs had 27 carries… in a game Denver trailed 27-9 at halftime. Consider that New England had a +14.5 Game Script… and finished with a higher pass ratio than Denver!

New Orleans called a running play on 24 straight plays, and passed on fewer than 35% of their plays, the first time that’s happened for the Saints since 2001. Even with a +16.6 Game Script, that’s still incredibly run-heavy.

Green Bay was in a tight game throughout with the Bears, but Jamaal Williams had 20 carries and Green Bay rushed 37 times against the Bears, compared to just 28 pass plays for Brett Hundley (who also had only two rushing attempts).

Finally, Pittsburgh trailed most of the day against the Colts, but Le’Veon Bell still had 26 carries. The Steelers had a nearly 50/50 pass/run ratio, remarkable for a team playing with a -4.7 Game Script.

The full week 10 Game Scripts below: [continue reading…]

{ 0 comments }

Let’s get to the week 9 Game scripts! Yes, these are a week late: my apologies, as well, other topics wound up being covered last week.

The biggest stories of week 9 were the blowout wins by Los Angeles, Philadelphia, and New Orleans. The Rams and Saints followed that up with another pair of blowout wins in week 10, while the Eagles were on bye. But before turning to week 10, let’s review some of the biggest outliers from week nine.

In week 9, the Jets and Panthers were very run-heavy. Lest you forget, the Jets beat the Bills on Thursday night in week 9, and while quarterback Josh McCown did have 5 carries, the running backs combined for 36 carries, while McCown had just 21 attempts. The Jets blew out Buffalo, but consider that the Lions had a similar Game Script and passes on 50% of plays.

Carolina beat Atlanta in a close game where the Panthers trailed for most of the first half. Still, behind Cam Newton and his 9 carries, Carolina wound up passing just 25 times while running 38 times! That’s really run-heavy.

The full Game Scripts data below: [continue reading…]

{ 0 comments }

The Jets had an ugly 15-10 loss to the Bucs today, and quarterback Josh McCown was as responsible for it as anyone. Prior to some garbage yard throws, he had passed for just 157 net yards on 41 dropbacks with an interception, and the Jets first 11 drives (before a meaningless touchdown) ended with 7 punts, 2 turnovers, 1 FG attempt, and 1 turnover on downs.

But in the final seconds of the game, McCown managed to throw his 14th touchdown pass of the season. That set a new single-season career high for McCown, which is notable: that’s the oldest age any player set their single-season career high in passing touchdowns.

As I wrote earlier, McCown has turned into one of the great late bloomers in quarterback history. Of McCown’s 70 career starts, half of them have come with him at 34.4 years of age or older, giving him the fifth oldest median age of start in league history. But now he has another record all to his own.

Warren Moon set a career high with 33 touchdown passes at age 34 in 1990; 5 years later, Moon tied that mark at the age of 39. But he didn’t set a new career high at age 39, so the tie goes to McCown.

Similarly, Craig Morton originally set a career high in passing touchdowns in 1969 at the age of 26 with 21 scoring strikes; at age 38, in 1981, he again threw 21 touchdown passes.

Five player — Y.A. Tittle, Roger Staubach, John Elway, Steve Young, and Peyton Manning — set a new career high in touchdown passes at the age of 37. Those are the men McCown pushed aside it he record books today.

There are 301 quarterbacks in NFL history who threw for at least 10 touchdown passes in one season and are at least 35 years old in 2017. The graph below shows for each age, the number of QBs who set their career high at that age (and quarterbacks who tie that number later in their career get a 0.5 for each year; so age 26 and age 38 each get 0.5 for Morton). [continue reading…]

{ 1 comment }

Today at Slate:

While we’ve known for a long time that going for it on fourth-and-short is the wise move, NFL coaches have typically eschewed this aggressive approach. Are coaches getting any smarter? I took a shot at answering that question in August, analyzing fourth-and-1 decisions that fell within the following three constraints:

  • The decision must have come in the first three quarters before end-of-game factors encourage or discourage aggressive play.
  • The offense had to be between its own 40-yard line and its opponent’s 40-yard line, so kicking a field goal wasn’t an option, but the team wasn’t so close to its own end zone as to make fourth down conservativism a defensible move.
  • The game needed to be competitive, defined as within 10 points, to ensure the scoreboard wasn’t the primary factor dictating those decisions.

From 1994–2004, teams went for it on these fourth-and-1 situations 28 percent of the time. From 2005–2014, that number ratcheted up, with teams going for it 35 percent of the time. And in 2015 and 2016, offenses stayed on the field for these fourth downs more than 40 percent.

That trend is still holding halfway through the 2017 season.

You can read the full article here.

{ 2 comments }

Carolina is #1… in percentage of rushing yards not by running backs

The Carolina Panthers have rushed for 982 yards this year, an average of 109.1 per game.  That ranks 15th in the NFL, and just a hair above the league average rate of 108.1 rushing yards/game.  But the Panthers don’t have anything resembling a traditional ground game: of those 982 yards, starting running back Jonathan Stewart has just 350 of them, while quarterback Cam Newton has 341 rushing yards, the most of any quarterback in the NFL in 2017.

In addition, wide receivers Curtis Samuel, Damiere Byrd, and Russell Shepard have combined for 87 yards; that’s the third-most rushing yards in the league for any team behind the Rams (Tavon Austin) and Raiders (Cordarrelle Patterson) among non-QB/non-RBs. In fact, Panthers running backs are averaging just 61.6 rushing yards per game, the fewest in the NFL.

This is hardly shocking, of course: Newton has been an incredible rushing threat since he arrived in the NFL in 2011. But it’s still interesting to see the numbers and understand that the Panthers are an above average team in total rushing, but dead last in rushing by running backs. The table below shows each team’s rushing yards in 2017 through nine weeks, both by running backs only and overall. Here’s how to read the table below. The Jacksonville Jaguars rank 1st in running back rushing yards, with 145.1 per game. The Jaguars also rank 1st in total rushing yards per game, at 166.5. For Jacksonville, 87.2% of their rushing yards have come from running backs. The Panthers rank last in both running back rushing yards per game and percentage of rushing yards by their running backs. [continue reading…]

{ 7 comments }

Kirk Cousins is Spreading It Around

In the summer, I wrote an article describing the increased emphasis on spreading the ball around in team passing games. Through nine weeks of the 2017 season, which teams have the most and least concentrated passing games?

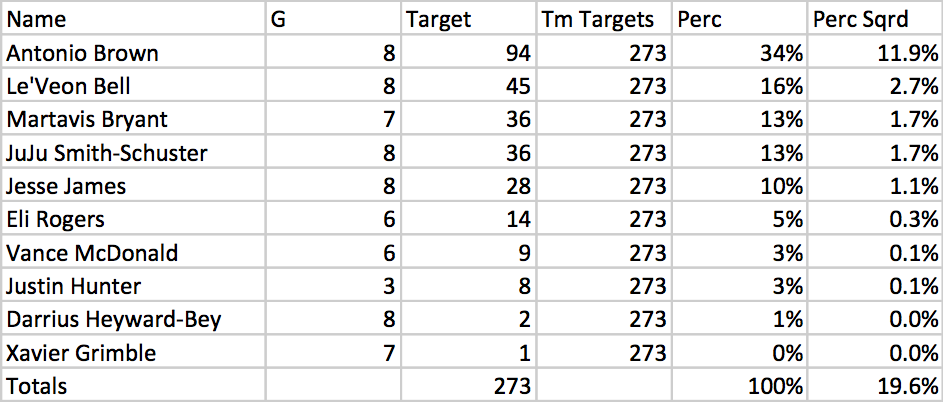
One way to measures this is to calculate the percentage of team targets had by every player on each team, square that result, and sum those squared results to get a team grade. Let’s use the Steelers as an example. Pittsburgh has 273 team targets this year, and star receiver Antonio Brown has seen 94, or 34%, of those targets. The square of 34% is 11.9%; perform those calculations for every Steelers who has a target this year, and the sum of those squares is 19.6%.

[continue reading…]

{ 1 comment }

Jared Goff was the worst quarterback in the NFL last season, and had one of the worst rookie quarterback seasons in modern history. This year, Goff is averaging 8.04 ANY/A, the 2nd-best in the NFL, and is on pace to set the NFL record for the largest year-over-year increase in Adjusted Net Yards per Attempt.

Dak Prescott had one of the best rookie quarterback seasons of all time in 2016, taking Dallas from the basement to the division crown. Prescott averaged 7.86 ANY/A last year, and isn’t far behind this year: he’s at 7.13 ANY/A, 7th-best in the NFL.

Carson Wentz had a very up-and-down rookie season, ultimately finishing with poor numbers and showing a lack of big play ability. This year, he’s having an MVP-caliber season: he ranks 5th in ANY/A at 7.55, and leads the NFL with 23 touchdowns as his Eagles have a 8-1 record. [continue reading…]

{ 7 comments }

Largest Decreases in Team Scoring

Yesterday, I looked at the largest increases in team scoring from one year to the next. Today, the opposite: which teams have seen the largest decreases in scoring?

In the post-merger era, that “honor” would belong to the 1974 Falcons. In 1973, the Falcons averaged 22.7 points per game, 7th-best in the NFL. The team was led by fullback Dave Hampton and quarterback Bob Lee, and while both returned the next season, the results were disastrous. Atlanta averaged just 7.9 points per game, the lowest in the NFL. Along with the 1977 (not ’76) Bucs, the ’74 Falcons are one of just two teams since 1950 to average fewer than 8 points per game.

In more modern times, the 2015 Cowboys (after losing Tony Romo), 2011 Colts (after losing Peyton Manning), and 2010 Vikings (in year two under Brett Favre) are the biggest decliners. The top 100 biggest declines below: [continue reading…]

{ 2 comments }

Largest Increases in Team Scoring

Last year, the Los Angeles Rams scored 224 points, or just 14.0 points per game. That ranked last in the NFL, 40 points behind the 31st-ranked Cleveland Browns. But as noted earlier this week, the 2017 Rams have scored 212 through seven games, a 30.3 points per game average that ranks 2nd in the NFL.

If that holds, the Rams increase of 16.3 points per game would rank as the third largest ever, and the biggest increase since 1950. [Update: Los Angeles ended the season averaging 29.9 points per game; that 15.9 PPG increase remains the third largest in NFL history, and displaces the 1999 Rams for the biggest year-over-year increase since 1950.] The table below shows the 100 biggest per-game increases in scoring in pro football history: [continue reading…]

{ 3 comments }

Let’s get to the week 8 Game scripts! The Raiders and Redskins stood out as pass-happy this week, as Derek Carr and Kirk Cousins kept passing in losing efforts. They were the two most pass-happy teams without accounting for Game Scripts in week 8, at 78% (Oakland) and 74% (Washington), respectively. But even after accounting for Game Script, both team’s pass-heavy nature stands out.

The Washington-Dallas game was competitive most of the way, but Cousins had 43 dropbacks while the team had just 15 rushing attempts.  Meanwhile, the Raiders called 49 pass plays against just 15 rushing plays, although that may have been due to Marshawn Lynch being suspended and both backup running backs underwhelming. This was just the second time in the last five years the Raiders passed on 77% of more of their plays. 

The full Game Scripts data from week 8, below: [continue reading…]

{ 5 comments }

Jameis Winston‘s average pass completion has traveled 8.24 yards in the air, the longest distance in the league.

On Carson Wentz‘s average completion, the ball traveled 8.11 air yards.

And Marcus Mariota? His average completion picked up 7.61 air yards before being caught.

Those are the three most vertical passers in the NFL this season by that metric.

Last year, Winston and Mariota ranked 2nd and 3rd in this category: Winston’s average gain was 7.89 yards before being caught, Mariota’s 7.86. Cam Newton led all passers at 8.14 air yards on completed passes. But Wentz? He ranked 27th out of 30 qualifying passers, at 5.34 yards.

In 2015 — the rookie years for Winston and Mariota — Winston ranked 2nd behind Carson Palmer with an 8.13 average; Mariota was in the top 10 at 7.24.

Wentz is having a remarkable season: he ranks 4th in yards per pass attempt, and ranks 1st in yards per completion. Winston ranks only 4th in yards per completion, while Mariota is down at 11th in yards per completion. That’s because those two — and especially Mariota — aren’t getting much yards after the catch from their receivers. Mariota and Winston are both getitng just 4.2 yards of YAC per completed pass, ranking them both in the bottom six of that metric. Wentz ranks 19th with 4.8 YAC per completion.

The graph below shows Air Yards per completed passes for each quarterback in the 2017 season on the X-Axis, and Yards After the Catch per completed passes on the Y-Axis. Mariota, Wentz, and Winston are all to the far right of the graph, of course: [continue reading…]

{ 5 comments }

Adam Gase was hired as the Dolphins head coach last year. His tenure with the team has been both successful and underwhelming, which is pretty hard to do. The Dolphins are 14-9 under Gase, tied with the Packers for the 8th-best record in the NFL. It feels hard to imagine, but Miami has a better record than Philadephia or Denver since 2016, and has as many wins as the Falcons.

On the other hand, Miami has a -77 points differential, which is the 7th-worst in the league. That’s a very stark difference: most teams have records that are proportional to their points differential, but not Miami. Tennessee (11th in record, 20th in points differential) and Houston (14th, 23rd) are the next two biggest outliers in that direction, with winning percentage ranks that are 9 slots better than their points differential ranks; Miami is at +17.5, by being tied for 8th in record and 26th in points differential. The Saints (t-19th; 8th), Jaguars (29th; 19th), and Chargers (t-27th; 18th) are the biggest underachievers by this method.

The graph below shows each team’s winning percentage (on the X-Axis) and points differential (on the Y-Axis) since 2016. Miami is a pretty large outlier: [continue reading…]

{ 8 comments }

Last week, the Bears and Steelers were two of the most run-heavy teams in the league. That repeated itself in week 7, as Chicago and Pittsburgh finished with the two lowest pass ratios of the week.

The Bears ran just 37 plays on Sunday against the Panthers, the fewest by any NFL team in a game since 2010. So while the headlines may have been that Chicago threw just 7 passes (plus four sacks), to be fair to the Bears, that represented a 30% pass ratio, higher than what the team did last week.  Chicago had two long return touchdowns, which limited the offense to just 9 drives, six of which were three-and-outs.  But the Bears are clearly looking to throw as infrequently as possible, making them the most run-happy team in the NFL.

In Pittsburgh, Le’Veon Bell had over 30 carries for the second straight week. The Steelers had a Game Script of +7.3, but consider that they had a lower run rate than the Cowboys or Jaguars, who both had nearly 20-point Game Scripts! Pittsburgh finished the day with 25 runs and 43 pass attempts. The Steelers defense limited the Bengals to just 18 yards on 6 second-half drives (two of which ended on interceptions); with that dominant a performance, expect Pittsburgh to continue to rely on the ground game.
[continue reading…]

{ 2 comments }

Drew Brees Finally Has A Defense Again

Did you know: The Saints currently lead the NFC in the Simple Rating System? And for a change, it’s not *all* because of Drew Brees and the passing game. The graph below shows how the Saints pass offense and pass defense have fared in ANY/A in each year since 2006. As a rule of thumb, you want the gold line (offense) to be a lot higher than the black line (defense); but despite Brees, that hasn’t always been the case.

As an aside, how remarkable is it that the 2015 Saints with such a historically bad defense still went 7-9?

Anyway, you can see that the pass defense is faring very well by Saints standards, similar to what New Orleans had in 2009 (13-3), 2010 (11-5) and 2013 (11-5).  New Orleans is on a four-game winning streak, and all four games have been won in large part due to the defense: [continue reading…]

{ 4 comments }

You remember the 2008 Bengals, don’t you? Remarkably, that Cincinnati team was led by two quarterbacks still in the league: Carson Palmer started the first 4 games (all losses) before elbow issues caused him to shut things down for the rest of the year. From there, a young Ryan Fitzpatrick took over, leading the team to a 4-7-1 record the rest of the way.

Cincinnati had some talented weapons at wide receiver. T.J. Houshmandzadeh had led the NFL in receptions in 2007, and in 2008 he still had another 92 receptions. Chad Johnson had just come off his fifth straight Pro Bowl season, but the ’08 year was the beginning of the end for the man once known as Ochocinco. Chris Henry, who had been a big play receiver the past few years in Cincinnati, was reduced to a possession player in this offense in ’08.

The offensive coordinator was longtime coach Bob Bratkowski, who manned that role in Cincinnati from 2001 to 2010. But the 2008 season was very different. The Bengals averaged just 8.83 yards per completion, the single lowest output in NFL history. On a team with two longtime NFL quarterbacks and two Pro Bowl wide receivers, Cincinnati somehow couldn’t manage to push the ball down the field with any sort of consistency. The longest reception of the year was a 79-yard completion to… running back Cedric Benson! Johnson and Henry combined for 72 receptions, but none of them went for more than 26 yards.

So why am I bringing up the 2008 Bengals? Well, the 2017 Dolphins (through 5 games) and 2017 Ravens (through 6 games) are both averaging just 8.5 yards per completion. Yes, those gunslingers formerly known as Jay Cutler and Joe Flacco are running two of the most anemic passing attacks we have ever seen.

Here’s the breakdown on the Miami side: [continue reading…]

{ 7 comments }

Through six weeks, the 49ers and Browns were both 0-6, while the Giants were 1-5. That’s bad, but it’s notable because those were the only three teams in the NFL with a record that was worse than 2-4. And on the flip side, only two teams — the 5-1 Chiefs and 5-1 Eagles — had a record that was better than 4-2. In other words, 27 of the 32 teams in the NFL were within two games of .500; or thought of differently, 84% of the NFL teams had a winning percentage between 0.333 and 0.667.

That… is… unusual. The graph below shows the percentage of NFL teams that had a record between 0.333 and 0.667 after six weeks in each year since 1970. As you can see, 2017 has set a new mark for parity: [continue reading…]

{ 3 comments }

Chicago upset Baltimore in week 6, and rookie QB Mitch Trubisky picked up his first career victory in the process.  But if you want to award credit to the Bears for the win, the passing game would be a distant third.

The Bears picked up a first down on just 23.8% of all passing plays, and that includes a halfback pass that went for a touchdown; Trubisky gained 4 first downs on 20 dropbacks.  But the Bears defense was outstanding, limiting the Ravens passing offense to a 20.5% first down rateJoe Flacco had a 48.8 passer rating; for his career, he is 2-16 in the regular season when he has a passer rating below 55.0.

But for Chicago, it was the running game that carried the day.  The Bears passed on just 28% of dropbacks, and Tarik Cohen and Jordan Howard combined to run 50 times for 199 yards. They also caught two passes for 23 yards and threw one pass for a 21-yard touchdown.  Given how competitive the game was (Chicago had a Game Script of just +3.3), you could argue it was the most run-heavy game of the season.

The full week 6 Game Scripts data below: [continue reading…]

{ 0 comments }

The Purple People Eaters

Last Monday, I provided some initial thoughts on the relative values of completion and passing first down percentage. The next day, I looked at how teams with disparate performances in those two metrics. And last Wednesday, I looked at the best passing offenses in NFL history in first down rate on passing plays.

Today? A look at the best pass defenses at preventing first downs.  This time, I am also going to era adjust these ratings. In 1969, the Vikings faced 459 pass plays (410 pass attempts, 49 sacks) but allowed only 88 passing first downs. That’s a remarkable rate of just 19.2%, the best since World War II.   It’s also the best rate on an era-adjusted basis.  The league average in the NFL in 1969 was 29.0%, which means this iteration of the Purple People Eaters was 9.8% better than league average, the highest differential ever. [continue reading…]

{ 7 comments }

Brown is averaging more yards per game than his uniform number.

Yep, that’s pretty good.

Dating back to December 16, 2012, and including the playoffs, Steelers wide receiver Antonio Brown has 578 receptions for 7,755 yards in his last 77 games. Brown has 48 catches in six games this season for 700 yards, a 116.7 yards per game average.

Before the 2015 season, I wrote that Julio Jones had maintained a 100 receiving yards per game average over 57 straight games. I did not include the postseason when I wrote that post, but Jones still would have qualified had I done so: he had 5,703 receiving yards in his last 57 regular season games and 305 receiving yards in his 3 playoff games during that time. Through the end of last regular season, Jones was still keeping this pace up, at 7,417 receiving yards through his last 74 games.

And following the Super Bowl, Jones was at 7,751 yards — or just 4 yards behind Brown’s pace — through his last 77 games. Even through week 3 of this year, Jones had 8016 receiving yards in his last 80 games, but he has had two poor games since: as a result, he’s fall slightly under the 100 yard/game pace in his last 82 games.

But Jones still is at over 100 yards per game through his last 79 games (that’s because the first 3 games in his 82-game streak weren’t great). In his last 79 games, Jones has 7,932 receiving yards, a 100.4 yards per game average. [continue reading…]

{ 9 comments }

The Jaguars used the fourth overall pick on LSU RB Leonard Fournette. The addition of Fournette was supposed to change the team’s identity, and it seems… to have worked? Fournette finished with 28 carries for 181 yards and 2 TDs, although the last of those carries was a 90-yard touchdown run when the game was over. Still, the Jaguars finished with 37 carries against just 16 pass plays: that’s a 30% pass rate, easily the lowest of the week. Jacksonville has a great defense and seems to have figured out its running game, and that may be the formula for success for this team.

Blake Bortles completed just 8 passes on his 16 dropbacks for only 5 first downs, but that was enough given that the Jaguars forced five interceptions and returned two of those for touchdowns. The Raiders and Bears were the other teams that showed up as run-happy this week, which probably isn’t surprising given that both teams were starting new quarterbacks in week five. For Oakland, EJ Manuel had 29 dropbacks but gained just 137 yards, while the running game had 25 carries for 108 yards and a touchdown (Manuel had two carries for 15 yards). For Chicago, Mitch Trubisky picked up just 108 yards on 26 dropbacks, while the running game had 115 yards on 29 attempts (with Trubisky picking up 22 yards on the ground on three carries).

Below are the week 5 Game Scripts data:
[continue reading…]

{ 2 comments }

Against the Saints in week four, Jay Cutler completed 20 of 28 passes for 164 yards, which translates to a sparkling 71.4% completion percentage. But that was about as misleading as it gets. Cutler also was sacked four times — a 12.5% sack rate — and several of those completions were pretty meaningless. In fact, Cutler threw just 7 first downs against New Orleans.

When you hear the 71.4% completion rate, you think: pretty good. You’d be wrong. Completion percentage ignores sacks (it shouldn’t), and it treats a completed pass for a first down the same as a completed pass for zero yards. On 32 dropbacks, Cutler threw just 7 first downs — a 21.9% rate that is more meaningful than his completion percentage. Why is it more meaningful? Well, the Dolphins were shutout against the Saints.

Want another example? Against the Redskins in week 3, Derek Carr completed 19 of 31 passes, for a nominally effective 61% completion rate. But Carr was also sacked four times (which, again, should be in the denominator when looking at completion percentage) and picked up just three first downs. Three! So while he completed 61% of his passes, Carr threw for a first down on only 9% of his pass plays against Washington.

How about from this weekend? In his first start of the year, Titans quarterback Matt Cassel completed 66% of his passes and produced a passer rating of 85.5 against Miami. That’s pretty good, right? Well, it isn’t when you have drives that like this that increase your completion percentage and passer rating:

Cassel was sacked six times on the day and threw for just 9 first downs. So while he was 21/32 on the stat sheet, he was also 9/38 at throwing for first downs, a very poor 24% rate. The Titans had 14 drives, and one of them was a 4-play drive for -3 yards that resulted in a field goal because it started at the Dolphins 24; the other 13 drives produced one touchdown, two fumbles, and ten punts. Tennessee lost, 16-10, despite Cassel completing 66% of his passes: or, maybe they lost because Cassel completed 66% of his passes playing that style.

A high completion percentage shouldn’t be any offense’s goal; instead, it feels like more and more quarterbacks (and offensive coordinators) are treating it like the ends and not the means.

The graph below shows completion percentage in the NFL (excluding the AFL) from 1950 through five weeks of 2017. That line is in blue and plotted against the Left Y-Axis; as you can see, it’s been increasing steadily over the last seven decades.  Plotted in orange and against the Right Y-Axis is the percentage of pass plays that have gone for first downs.  That’s also increasing, although it’s been a little bit bumpier. [continue reading…]

{ 6 comments }

Week 4 Game Scripts: Buffalo Runs To Victory

The Buffalo Bills and their run-heavy ways are at it again. The Bills upset the Falcons in week 4, but it wasn’t because their offense stole the show. Buffalo scored only 23 points, and that included a defensive touchdown, a 55-yard field goal, and a 56-yard field goal. The Bills had just 15 first downs, and four of the team’s 8 drives ended with three or fewer yards. But Buffalo is going to stick with the ground game, even when it isn’t working. And that makes them a unique team in 2017.

The highlight for the offense came on a 19-play, 82-yard drive that took over 11 minutes off the clock. Here’s the full summary: bonus points if you can figure out whether or not this counts as run-heavy:

Full Play-By-Play Table
Quarter Time Down ToGo Location Detail BUF ATL EPB EPA Win%
3 8:20 1 10 BUF 12 LeSean McCoy left tackle for 8 yards (tackle by Keanu Neal) 14 10 -0.350 0.290 44.4
3 7:49 2 2 BUF 20 LeSean McCoy for 2 yards. Penalty on Eric Wood: Offensive Holding, 10 yards 14 10 0.290 -0.780 49.1
3 7:31 2 10 BUF 12 Mike Tolbert right guard for 7 yards (tackle by Dontari Poe) 14 10 -0.780 -0.600 48.1
3 6:51 3 3 BUF 19 Tyrod Taylor right end for 5 yards (tackle by Deion Jones) 14 10 -0.600 0.540 42.1
3 6:17 1 10 BUF 24 LeSean McCoy right end for 7 yards (tackle by Keanu Neal) 14 10 0.540 0.940 39.7
3 5:29 2 3 BUF 31 LeSean McCoy right tackle for 7 yards (tackle by Deion Jones) 14 10 0.940 1.470 36.4
3 4:51 1 10 BUF 38 Mike Tolbert right guard for 3 yards (tackle by Brooks Reed) 14 10 1.470 1.330 36.5
3 4:14 2 7 BUF 41 Mike Tolbert left guard for 6 yards (tackle by De’Vondre Campbell) 14 10 1.330 1.420 35.4
3 3:35 3 1 BUF 47 LeSean McCoy right tackle for 4 yards (tackle by Deion Jones) 14 10 1.420 2.320 30.4
3 3:02 1 10 ATL 49 Tyrod Taylor pass complete deep left to Zay Jones for 18 yards 14 10 2.320 3.510 24.5
3 2:19 1 10 ATL 31 LeSean McCoy right tackle for 4 yards (tackle by Keanu Neal) 14 10 3.510 3.510 23.6
3 1:39 2 6 ATL 27 LeSean McCoy right tackle for 7 yards (tackle by Sharrod Neasman) 14 10 3.510 4.240 19.8
3 1:01 1 10 ATL 20 Mike Tolbert left end for 8 yards (tackle by Damontae Kazee). 14 10 4.240 5.040 16.1
3 0:09 2 2 ATL 12 Patrick DiMarco left guard for -2 yards (tackle by Grady Jarrett) 14 10 5.040 3.890 19.3
4th Quarter
4 15:00 3 4 ATL 14 Penalty on John Miller: False Start, 5 yards (no play) 14 10 3.890 3.100 22.5
4 15:00 3 9 ATL 19 Tyrod Taylor pass complete short middle to Andre Holmes for 10 yards 14 10 3.100 5.140 14.5
4 14:20 1 9 ATL 9 LeSean McCoy left end for 6 yards (tackle by Brooks Reed and Keanu Neal) 14 10 5.140 5.530 12.4
4 13:37 2 3 ATL 3 LeSean McCoy right tackle for 1 yard (tackle by Brooks Reed and Grady Jarrett) 14 10 5.530 4.950 13.3
4 12:59 3 2 ATL 2 Tyrod Taylor pass complete short left to Jordan Matthews for 1 yard 14 10 4.950 3.550 17.7
4 12:09 4 1 ATL 1 Penalty on Tyrod Taylor: Delay of Game, 5 yards (no play) 14 10 3.550 2.990 18.8
4 12:03 4 6 ATL 6 Steven Hauschka 24 yard field goal good 17 10 2.990 3.000 18.6

The drive opened with NINE straight running plays, and 15 of the 18 plays were rushes! A pass on 1st-and-10 following those nine runs was the only non-third down pass of the drive. That’s just crazy. The Bills ended the day passing on just 39% of plays despite this being a back-and-forth game throughout.

Below are the week 4 Game Scripts: [continue reading…]

{ 5 comments }
Next Posts Previous Posts