≡ Menu

Ben Roethlisberger takes a lot of sacks. Since entering the league in 2004, he has nearly 100 more sacks than any other quarterback. I thought it would be interesting to look at the leaders in sacks taken over rolling 5-year periods.

Over the last 5 years, the most sacked quarterback is Ryan Tannehill, who may be going down a Roethlisberger-like path. Tannehill has surprisingly only missed 3 games in his 5-year career, but I’d say the odds of him continuing to take sacks at a high rate and playing 16 game seasons is pretty low.

As for Roethlisberger, he had the most sacks taken from ’04 to ’08, ’05 to ’09, ’06 to ’10, ’07 to ’11, and ’09 to ’13; he was 2nd from ’08 to ’12, just four sacks behind Aaron Rodgers. That was the only thing stopping Ben from leading for a whopping 6 straight 5-year periods.

Here’s a list of the leader for every 5-year period beginning in 1969, which is as far back as PFR’s sack data goes: [continue reading…]

{ 9 comments }

Median Age of Sacks (By Defensive Players)

Yesterday, I looked at the median age of interceptions by defensive players. Today, using the same methodology, I will be looking at sacks by defensive players.

Since 1982, the median sack age has been rising, although it did drop from the high levels we saw 5-10 years ago. Take a look:


[continue reading…]

{ 2 comments }

Just like yesterday, I’m very short on time, so Bryan Frye agreed to help keep the streak alive here by asking me to reproduce his work on the career rushing touchdown kings. What follows is a reproduction of his work here. As always, thanks so much to Bryan for contributing.

***************************

As a lover of football history, I enjoy writing about the evolution of the game and examining statistical achievements from a historical perspective. I’m also fond of looking at the progression of career records, as doing so can often give us a glimpse into the progression of the game itself. I’ve previously written about the history of the passing touchdowns, passing yards, and receptions records. Today, I’ll focus on the storied history of the carer rushing touchdowns record.

The first ever Football Sunday in league history occurred on September 26, 1920. [1]This is in dispute, however, because that game, between the Rock Island Independents and the St. Paul Ideals, only featured one official NFL team – the Independents Rock Island Independents back Eddie Novak scored the first touchdown on a ten yard rush, but that was in the day before official stats. We have to move twelve years from that point till we find a full season with officially recorded stats. Note that, while the NFL does not recognize as official most records prior to 1932, it does recognize touchdowns; whether or not the league is correct in doing so is beyond the scope of this article. My aim is to begin in 1932, but to use the numbers the league recognizes for its first rushing touchdown king, Ernie Nevers. Without further ado…

Running Backs to Hold the Career Rushing Touchdowns Record

Ernie Nevers (16 years, 1 month as official record-holder) [continue reading…]

References

References
1 This is in dispute, however, because that game, between the Rock Island Independents and the St. Paul Ideals, only featured one official NFL team – the Independents
{ 14 comments }

Top Running Backs Rarely Play For Just One Team

With the Vikings and Chiefs moving on from Adrian Peterson and Jamaal Charles, respectively, it’s a reminder that even the best running backs rarely finish their careers with one team.

Currently, there are 31 running backs in NFL history who have at least 7,000 rushing yards and have rushed for at least 70 yards per game.  Among that group, Peterson and Charles are two of just six players to spend their entire careers with one team — and that is likely going to change.  Can you guess the first 4?  Take a second.

Those thresholds aren’t insanely high.  To put some scope on those thresholds, drop them to 6500/65 and you bring in Robert Smith of the Vikings, and a pair of Giants in Tiki Barber and Rodney Hampton.

Who are those four?  They are all Hall of Famers: Barry Sanders, Jim Brown, Walter Payton, and… Terrell Davis.

For comparison’s sake, there are 30 wide receivers who have at least 6,000 receiving yards and a career average of at least 60 receiving yards per game. Even excluding the six receivers who are still active, Don Hutson, Charley Hennigan, Steve Largent, Sterling Sharpe, Michael Irvin, Marvin Harrison, Reggie Wayne, Marques Colston, and Calvin Johnson all retired and played for just one team; they represent nearly half — 9 of 19 — of the retired players in the 6000/60 club.

I don’t have much to add to that, other than I find it kind of interesting.

{ 9 comments }

The Jets have not exactly been a powerhouse franchise in NFL history, and that’s true in recent years, too. But the Jets were legitimate Super Bowl contenders in 2009 and 2010, making the AFC Championship Game both years. Take a look at the Jets yearly SRS grades from 1990 to 2016, and ’09 and ’10 stand out as the last great Jets teams:

[continue reading…]

{ 9 comments }

It’s not easy to gain recognition as an offensive lineman. It’s even harder to do so as a center. And it’s almost impossible to do it as a center on a bad offense.

Travis Frederick of the Cowboys was the first-team All-Pro center in 2016, based on voting from the AP, PFW, and PFF. Alex Mack of the Falcons was the 2nd-team choice from the APP and PFF. Dallas and Atlanta, of course, had two of the best three offenses in the NFL this year.

Since the merger, 31 of the 47 first-team All-Pro centers (based on the AP team) played for teams that ranked in the top 10 in passing efficiency, as measured by Adjusted Net Yards per Attempt. Just five of the 47 selections played for offenses that ranked 20th or worse in ANY/A, and all five played for the Jets or Steelers: Mike Webster (1983, Pittsburgh, 26th), Dermontti Dawson (1998, Pittsburgh, 28th), Kevin Mawae (1999, Jets, 20th), Mangold (2009, Jets, 27th), and Mangold again (2010, Jets, 20th). Here’s where the AP 1AP center’s team ranked in ANY/A each year: [continue reading…]

{ 1 comment }

The 2015 Cowboys and One Strike Out Wonders

In 2014, Dallas, behind Tony Romo, went 12-4 (and 12-3 in Romo starts).

In 2015, with Matt Cassel, Brandon Weeden, and Kellen Moore, the Cowboys went 4-12 (and 3-1 in Romo games).

In 2016, Dallas, with Dak Prescott at quarterback, went 13-3.

So Dallas saw the team’s win total drop by 8 games from ’14 to ’15, and then bounce back up by 9 more games.  That’s an average change of 8.5 wins, even more extreme than the Panthers change (in the other direction) we discussed yesterday.

Of course, given the quarterback changes in Dallas, it’s not super surprising to see that big swings in wins totals.  The Cowboys are the 3rd team to have an average win swing of 8.5 wins over a 3-year period, with the middle year being really bad. The first two also happened pretty recently:

  • In 2012, the Texans (with Matt Schaub) went 12-4; in ’13, Schaub’s performance fell through the floor, and Houston went 2-14 (-10). The next year, with Ryan Fitzpatrick, Houston went 9-7 (+7).

[continue reading…]

{ 6 comments }

The 2015 Carolina Panthers and One Hit Wonders

The 1999 Rams weren’t a fluke. They were a shocking team that went from terrible to excellent overnight, but their success in 2000 and 2001 proved that the team wasn’t a fluke.

The 2015 Panthers? That may be a different story.  In 2014, Carolina went 7-8-1, before winning 7.5 more games (counting a tie as half a win) in 2015 as part of a magical 15-1 season.  Last year, Carolina’s win total dropped by 9 games to 6-10. That means the Panthers 2015 season was, on average, 8.25 wins better than how the team performed in the two surrounding years.

How does that stack up among all teams since the merger? Well, it’s the second biggest outlier since 1970.  Can you guess the first? [continue reading…]

{ 14 comments }

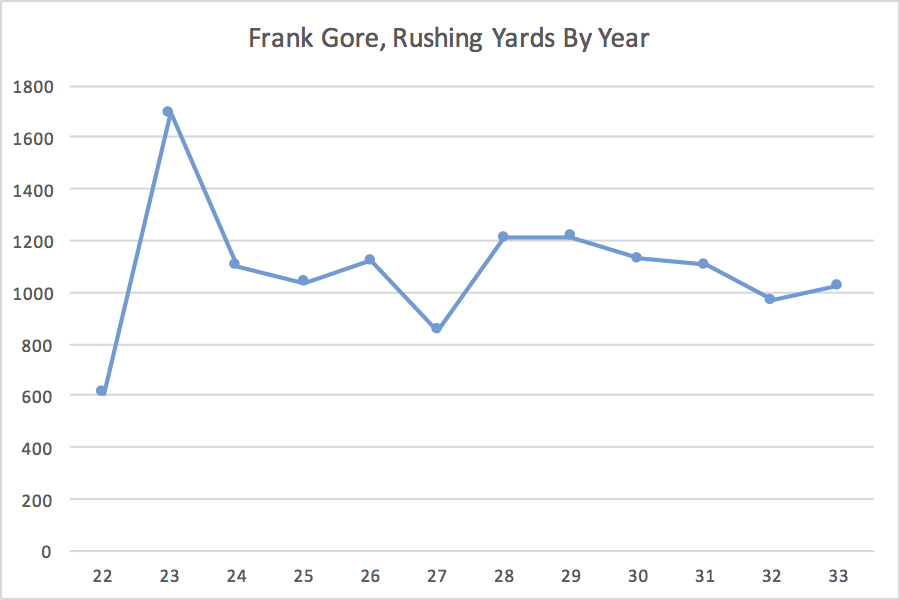
Frank Gore Isn’t Aging

Since turning 28 years old, Frank Gore has rushed for 6,651 yards. That’s the 4th most rushing yards from age 28+ in NFL history.  Gore has also hit the 1,000-yard mark in 5 seasons since turning 28, tied with Emmitt Smith for the most ever.   Here’s Gore’s year-by-year rushing totals:

[continue reading…]

{ 24 comments }

Hall of Famers on Multiple Teams

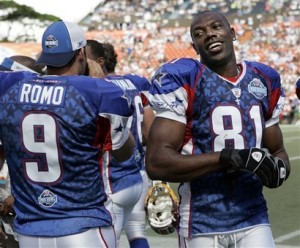
Terrell Owens in the uniform he wore most often

With the Hall of Fame failing to elect Terrell Owens to the Hall of Fame this year, much of the discussion in the media has centered around the fact that Owens bounced around the league for much of his career. That made me wonder: where does Owens stand when it comes to the Hall of Fame and playing for multiple teams?

Owens has a Career AV [1]I am using perceived AV throughout this post, which assigns 100% credit to a player’s best season, 95% credit to his second best season, 90% to his third best, and so on. of 119. That was split as follows (any discrepancies due to rounding):

  • 74 points of AV, or 62% of his career AV, came with the 49ers;
  • 28 points of AV, or 24%, came with the Cowboys;
  • 11 points of AV, or 9%, came with the Eagles;
  • 4 points of AV, or 3%, came with the Bengals; and
  • 3 points of AV, or 3%, came with the Bills.

It is pretty rare for a player to make the Hall of Fame and lace up for five different teams, although there are already two wide receivers in Canton who can make that claim.  But we’ll get to that at the end of this post.

Where Does Having “Just” 62% of Your Career AV With One Team Rank?

There are 20 Hall of Famers who failed to eclipse 62% of their career AV with one team, including guys like Marshall Faulk, Reggie White, and Deion Sanders. A number of players, including 2017 selection Kurt Warner, barely eclipsed 50% with one team, with Curley Culp and Eric Dickerson the two lowest players at 51%. [continue reading…]

References

References
1 I am using perceived AV throughout this post, which assigns 100% credit to a player’s best season, 95% credit to his second best season, 90% to his third best, and so on.
{ 6 comments }

Return Touchdowns Were Way Down in 2016

Most years, there are about 3.5 to 4.0 return touchdowns per team season in the NFL, or about 115 in the entire NFL. But in 2016, there were just 73 return touchdowns, the fewest in a single season since 1988. I’m defining a return touchdown as a punt return, kickoff return, fumble return, or interception return for a score; this does exclude some unusual returns, such as a blocked field goal return, blocked punt return, missed field goal return, etc.

By this measure, the average team had just 2.3 return touchdowns last year. That’s a pretty unusually low number: [continue reading…]

{ 8 comments }

Jason Taylor Was An Unusual First Ballot Hall of Famer

Jason Taylor was a first ballot Hall of Famer, which was pretty surprising to a lot of folks. Let’s start with defensive ends: Andy Robustelli, Howie Long, and Michael Strahan were clear choices, but all had to wait one year before making it to Canton. Jack Youngblood, Carl Eller, and Willie Davis each made 5 Associated Press first-team All Pro teams, but all wait at least 7 years. Chris Doleman and Doug Atkins made 8 Pro Bowls, but both had to wait 8 years.

In the last 30 years, there have been 36 non-quarterbacks who have made the Hall of Fame in their first year of eligibility. Among those players, Taylor is one of only 12 with 3 or fewer 1APs. Half of those 12 were running backs, which isn’t too surprising. Like quarterbacks, running back is a position with a lot of statistics, so reputation matters less when selecting All Pros. As a result, it’s much harder for a running back to rack up a high number of 1AP teams.

The other six? Placekicker Jan Stenerud (1), wide receiver Steve Largent (1), tackle Jackie Slater (0), Taylor (3), and defensive backs Darrell Green (1) and Mel Blount (2). Taylor is also one of just 8 of the last 36 first ballot Hall of Famers with 6 or fewer Pro Bowls. Five of those 8 were running backs; the other three are Taylor (6), Blount (5), and Stenerud (6). [continue reading…]

{ 17 comments }

Bill Belichick and the Patriots won their fifth Super Bowl on Sunday. For a number of reasons, that brings up some good trivia tidbits.

Most Championships

Belichick, of course, is now the only coach with five Super Bowl rings. However, three other coaches have won more titles. Paul Brown won 7 championships, although only three NFL titles (the remaining four were in the AAFC). George Halas and Curly Lambeau each won 6 NFL titles, while Belichick is now tied with Vince Lombardi at five.

Oldest Coach

Belichick is 64 years old, making him the third oldest head coach to win it all. In 2011, Tom Coughlin and the Giants beat Belichick’s Patriots in the Super Bowl, and Coughlin was 65 years old that season. George Halas won his final title in 1963, at the age of 68. Meanwhile, Dick Vermeil was 63 years old when he won the Super Bowl with the Rams to conclude the 1999 season.

Longest Run Between Titles

Belichick’s first title came in 2001, which means he’s now won championships 15 years apart. That’s tied with Curly Lambeau for the third longest stretch: Lambeau won his first championship in 1929, and his last in 1944, with both coming with the Packers. Jimmy Conzelman won as head coach of the Providence Steam Roller in 1928 and then 19 years later with the Chicago Cardinals in 1947. The longest reign, of course, goes to George Halas at 42 years; he won championships with the Bears in both 1921 and 1963. The only other coach to win titles at least 10 years apart? Weeb Ewbank, who won with the Colts in ’58 and ’59, and then as head coach of the Jets (and against the Colts) in 1968.

Most Common Record

There have been 8 Super Bowl champions with 14-2 records, and three of them (’03, ’04, ’16) were coached by Belichick. That’s tied for the second most common record for a Super Bowl champion behind 12-4. There were 11 teams that won with that record, including Belichick’s 2014 squad. The other record to win it all 8 times was 13-3. [continue reading…]

{ 5 comments }

Super Bowl LI Reaction

Well, Super Bowl LI is in the books. The Falcons dominated for most of the game, making it both a surprising but pretty uneventful Super Bowl — until the final 10 minutes or so. Matt Ryan had a perfect passer rating for the majority of the night, Robert Alford had a game-turning pick six late in the first half, and Grady Jarrett tied a Super Bowl record with 3 sacks.

Oh, and then New England staged the greatest comeback in Super Bowl history, and maybe the greatest comeback in NFL history? Atlanta led 28-3 with 3 minutes left in the 3rd quarter.  Atlanta led 28-9 with 10 minutes left in the game. Atlanta led 28-12 with 7 minutes left in the game. Atlanta led 28-20 with 60 seconds left in the game. And yet, somehow, the Patriots won.

Down by 16, the Patriots needed everything to go right.  And it did. The Patriots scored a touchdown, got a two point conversion, forced an Atlanta punt, scored another touchdown, got another two point conversion, forced another punt to force overtime, won the coin toss in overtime, and then scored a touchdown in overtime to win.

If it wasn’t the Patriots, it wouldn’t feel real.  With the Patriots, these unrealistic finishes seem preordained.  There had been 105 playoff games where a team trailed by at least 18 points entering the 4th quarter; teams had been 0-105.

I don’t even know where to start, so I’m going to kick it to you. What is the takeaway from Super Bowl LI?  And while I know it will mostly be Patriots-centric, what about from Atlanta’s perspective? Can they recover from this?

{ 136 comments }

Super Bowl LI: Post Your Predictions Here

The two leaders in ANY/A in 2016.

Finally, it’s here: Super Bowl LI has arrived. You can read all my Super Bowl LI articles here.

What’s your projection? Post it in the comments.

For me, I’m going Atlanta 33, New England 28. I think the Falcons offense is the best thing in this game, and the absence of Rob Gronkowski will be the difference here.

And while Julio Jones is the star, I’m going to go with Devonta Freeman as my MVP. And not because of what he will do as a rusher, but as a receiver. Seattle — the 19th team to beat bot Super Bowl teams in a season — set the blueprint. C.J. Prosise caught 7 of 7 targets for 87 yards and 5 first downs, and I don’t think the Patriots linebackers can cover Freeman (especially since safety help will be needed for Jones). Freeman will clear 140 yards from scrimmage, and take home the honors.

What’s your prediction?

{ 7 comments }

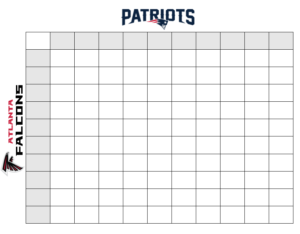
A couple of years ago, I wrote a detailed breakdown about Super Bowl squares. Well, it’s that time of year again, so I’m going to repost that article here to help you cheat to win at your Super Bowl party.

Every Super Bowl squares pool is different, but this post is really aimed at readers who play in pools where you can trade or pick squares (surely no pool has a prohibition on this!) I looked at every regular season and postseason game from 2002 to 2013. [1]Yes, this means your author was too lazy to update things for the 2014, 2015, or 2016 seasons. I suppose the rule change moving back the extra point would probably change things ever so slightly, … Continue reading The table below shows the likelihood of each score after each quarter, along with three final columns that show the expected value of a $100 prize pool under three different payout systems. The “10/” column shows the payout in a pool where 10% of the prize money is given out after each of the first three quarters and 70% after the end of the game; the next column is for pools that give out 12.5% of the pool after the first and third quarters, 25% at halftime, and 50% for the score at the end of the game. The final column is for pools that give out 25% of the pot after each quarter — since I think that is the most common pool structure, I’ve sorted the table by that column, but you can sort by any column you like. To make the table fully sortable, I had to remove the percentage symbols, but “19, 6.7, 4.1, 2” should be read as 19.0%, 6.7%, 4.1%, and 2.0%. [continue reading…]

References

References
1 Yes, this means your author was too lazy to update things for the 2014, 2015, or 2016 seasons. I suppose the rule change moving back the extra point would probably change things ever so slightly, given the small increase in missed extra points.
{ 5 comments }

On Saturday, I noted that Matt Ryan and Tom Brady were the top two quarterbacks in ANY/A in 2016, setting up a rare Super Bowl matchup of the two leaders in that metric. The Falcons and Patriots offenses as a whole also rank 1st and 2nd in ANY/A: Matt Ryan averaged 9.03 ANY/A, and since he handled all but 3 of the Falcons pass attempts this year, you won’t be surprised to know that the Falcons offense averaged 9.01 ANY/A. Brady averaged 8.81 ANY/A, but of course missed four games due to a suspension; the Patriots team ANY/A was 8.46, still good enough for second-best in the NFL.

But as regular readers will remember, the Falcons and Patriots don’t just rank 1-2 in ANY/A; they rank first and second in ANY/A differential, too. Atlanta’s ANY/A differential was 2.70 (9.01 on offense, 6.31 on defense), just a hair ahead of New England (8.46, 5.78, net of 2.68). No other team was within 1 ANY/A of those two, making them the clear best teams in the NFL in ANY/A differential. [continue reading…]

{ 19 comments }

The two leaders in ANY/A in 2016.

Matt Ryan and Tom Brady finished the season ranked 1st and 2nd in the NFL in Adjusted Net Yard per Attempt. How unusual is that?

  • In 1966, Bart Starr led the NFL in ANY/A and was the NFL MVP. Len Dawson led the AFL in ANY/A, and was the AFL’s first-team All-Pro selection at quarterback (running back Jim Nance was the MVP). The Packers and Chiefs met in the Super Bowl, of course, making it one of just two times that the Super Bowl featured two first-team All-Pro choices at quarterback. The other? Super Bowl III, featuring Earl Morrall and Joe Namath).
  • In 1971, Roger Staubach had a historically great season, producing a remarkable 7.81 ANY/A. The runner-up that year was Bob Griese, at 6.35, and no other passer was over 6.00. Those 1971 seasons from Staubach and Griese both ranked in the top 50 in my era-adjusted passer rating seasons, too. Alan Page was the AP MVP choice that year, Staubach won the Bert Bell Award for Player of the Year, and Griese won the third MVP, given by the NEA. So when the Cowboys and Dolphins met in the Super Bowl, it featured two MVP quarterbacks, a feat that could be matched this year. The PFWA has already named Ryan as its MVP, but the AP or the Bert Bell Award could choose Brady, which would give us another set of dueling MVPs.
  • In 1984 Dan Marino was a unanimous MVP (AP, NEA, PFWA, Bert Bell) on the back of a groundbreaking performance. His raw numbers (48 TDs, 5,084 yards) were remarkable, but so was his 8.94 ANY/A average. Joe Montana had a darn good year, too: his 49ers went 15-1 and his 7.93 ANY/A was 1.24 ANY/A better than any quarterback not named Marino. From an ANY/A dominance standpoint, it’s very similar to what Ryan and Brady have done this year.

[continue reading…]

{ 1 comment }

Today’s guest post/contest comes from Thomas McDermott, a licensed land surveyor in the State of California, a music theory instructor at Loyola Marymount University, and an NFL history enthusiast. As always, we thank him for his hard work. You can view all of his work at Football Perspective here.


I wrote this article last year, when I generated the statistics and then ranked all starting quarterbacks in 2015 based on how well they played in “clutch” [1]Note that throughout this post, anything that happens within this situation is termed “clutch”; as in “clutch yards”, “clutch plays”, “clutch touchdown”, etc. situations. I used a simple definition: if it occurred in the 4th quarter or overtime, when the game was tied or the quarterback’s team was trailing by as much as one score (8 points), then it was a clutch situation.

The main metric used was Bryan Frye’s Total Adjusted Yards per Play, and today we’ll use the same methodology [2]In my post last year, I included a 2-point conversion bonus of 15 yards which I’m going to leave out for now. Besides not really adding much to the study, when I started collecting the data for the … Continue reading to find the 2016 Clutch Value Leader as well as the single season leaders since 1994. Here’s Bryan’s TAY/P formula, which Chase supports as an all-encompassing basic measure of quarterback performance:

(passing & rushing yards + (touchdowns * 20) – (interceptions * 45) – (fumbles lost * 25) – ( sack yards)) / (pass attempts + rush attempts + sacks) [3]Note that Bryan uses a 25-yard penalty for all fumbles (lost or recovered) while this study uses that penalty for lost fumbles only (which are the only ones being counted here).

The other change I’m making from the previous post, is that I’ll be using a 3-year rolling league average, as opposed to a single year league average, when adjusting for era. Thanks to Bryan (through his great website GridFe) for providing me with that information.

So let’s get to it. Below are the quarterbacks in 2016 who had at least 30 clutch action plays, [4]For 2015, I used 24 actions plays as the cutoff, after looking at the numbers more when doing the single-season rankings, 30 seemed more appropriate. and here’s how to read the table: [continue reading…]

References

References
1 Note that throughout this post, anything that happens within this situation is termed “clutch”; as in “clutch yards”, “clutch plays”, “clutch touchdown”, etc.
2 In my post last year, I included a 2-point conversion bonus of 15 yards which I’m going to leave out for now. Besides not really adding much to the study, when I started collecting the data for the single season and career leaders in this metric, I found that the data on 2-point conversions is somewhat spotty before 2005; in fact, in most cases before 1998, the players involved aren’t even mentioned. So, for those of you who read the last post, taking away that conversion bonus means Eli Manning is at the top for 2015 and not Jay Cutler.
3 Note that Bryan uses a 25-yard penalty for all fumbles (lost or recovered) while this study uses that penalty for lost fumbles only (which are the only ones being counted here).
4 For 2015, I used 24 actions plays as the cutoff, after looking at the numbers more when doing the single-season rankings, 30 seemed more appropriate.
{ 23 comments }

Before last year’s Super Bowl, I wrote that Carolina led the NFL in points scored in a unique way. What made the Panthers scoring success so unusual? Most notably were these two facts:

  • Carolina ranked only 11th in yards, the worst-ever ranking for the top-scoring team; and
  • Carolina ranked only 9th in NY/A, the worst-ever ranking for the top-scoring team.

With the Patriots, you may be surprised to learn that while New England finished 1st in points allowed, the defense ranked just 16th in DVOA. There are a few explanations here:

  • The Patriots faced by far the easiest schedule of any defense in the NFL.  New England’s SOS was -7.1%, while Tennessee was 31st at -4.2%, and the Bills were 30th at -3.0%.  The Patriots would be tied for 8th in DVOA if that metric was not adjusted for strength of schedule, which is why the defense falls to 16th with those adjustments.
  • New England had just 11 turnovers, tied with the Falcons for fewest in the league. Combined with a generally good offense, and the average opponent’s drive against New England started inside the 25-yard line, the best in the league. That means the Patriots defense had a lot of turf behind them, making life much easier for the defense.
  • Opposing kickers missed 8 of 29 attempts, including three from within 45 yards.  In addition, the Patriots were 8th in red zone defense and 3rd in goal-to-go defense, which helps the points allowed numbers.

New England’s defense was hardly bad by traditional numbers: the Patriots ranked 8th in total yards allowed, 6th in Net Yards per pass Attempt allowed, and 3rd and 4th in yards per carry allowed and rush defense DVOA.  That’s a good defense, but again, is boosted by the very easy schedule. [continue reading…]

{ 13 comments }

Beating the Patriots in a Shootout

Can the Falcons beat the Patriots in Super Bowl LI in a shootout?  On some level, the answer is of course.  Atlanta was the highest-scoring team in the regular season, and the Falcons offense has been historically great. And yet, the early returns from the media on how Atlanta can beat New England tend to focus on whether the Falcons defense and pass rush can dominate the game.

That’s not surprising given the post mortem written following the Patriots two Super Bowl losses, and there is no doubt that “getting the better of Brady” has been the m.o. for most teams that have knocked New England out of the playoffs.   So can Atlanta win a 35-31 style game against the Patriots?

In general, the conventional wisdom is true regarding how to beat New England: the Patriots are 19-1 when scoring over 21 points in playoff games since 2001, with the only loss coming in the classic 2006 AFC Championship Game against the Colts.  But there are other exceptions.  There have been 12 games in the Tom Brady era that I would classify as a shootout, which means:

  • Both teams combine for 60+ points;
  • The game is decided by 15 or fewer points; and
  • Both teams combined for 600+ passing yards (which, surprisingly, eliminates the ’06 AFCCG)

The first of those games was Super Bowl XXXVIII against the Panthers; that game, of course, was in fact decided by the last team to have the ball, which was New England. The Patriots are “only” 8-4 in these games, though, which means there may in fact be a blueprint for the Falcons to follow.  Let’s look at those losses and see if they meet the spirit of the question:

  • 2009, SNF at Indianapolis: This was the “4th and 2” game, and it wouldn’t surprise anyone if the Patriots (or Falcons) employed a similarly aggressive tactic in this year’s Super Bowl.  The Patriots led the 9-0 Colts 31-14 early in the 4th quarter, when Peyton Manning kicked it into overdrive.  He led Indianapolis on a 5-play, 79-yard drive for a touchdown; after a Patriots punt, a Manning deep pass was intercepted.  New England responded with a FG to extend the lead to 34-21, but Manning responded with another 79-yard touchdown drive. New England tried to run out the clock, but faced a 4th-and-2 with 2:08 to go at the Patriots own 28.  The idea of giving Manning two minutes while trying to prevent a 6-point lead didn’t sound very good — and it wouldn’t against 2016 Matt Ryan, either — so the Patriots went for it but fell a yard short.  Manning responded with a quick touchdown, and Indianapolis won, 35-34.
  • 2011, week 3, at Buffalo: Yes, the “If Ryan Fitzpatrick can do it” game. Both Brady and Fitzpatrick cleared 350 passing yards, and Buffalo recorded four interceptions, one of which was a pick six. Buffalo had a 95-yard touchdown drive in the 4th quarter, and hit a field goal as time expired for a 34-31 win.
  • 2012, SNF at Baltimore: Another primetime game on the road against a hated rival. This was a back-and-forth game that saw Brady and Joe Flacco combine for over 700 yard through the air.  With 7:29 left in the game, Baltimore had the ball at their own 8, down by 9 points.  The Ravens drove 92 yards for the score, forced a punt, and then hit the game-winning field goal as time expired to steal a 31-30 win.
  • 2012, SNF vs. San Francisco: Yet another primetime game, and this one was a crazy one. The 49ers jumped out to a 31-3 lead, with Randy Moss, Delanie Walker, and Michael Crabtree all pulling in touchdowns.  The Patriots then stormed back with four touchdowns to make it 31-31 in the 4th quarter, before Kaepernick hit Crabtree for another touchdown.  The 49ers iced it with a field goal late, and a last-minute field goal by New England made the final score 41-34.

There are also these 12 regular season games that, for one reason or another, don’t fit the above criteria, but involved New England losing and the opponent scoring over 30 points:

Points
Tm
Year Date Time LTime Opp Week G# Day Result OT PF PA PD PC
NWE 2016 2016-11-13 8:30 SEA 10 9 Sun L 24-31 24 31 -7 55
NWE 2015 2015-12-06 4:25 4:25 PHI 13 12 Sun L 28-35 28 35 -7 63
NWE 2014 2014-09-07 1:03 1:03 @ MIA 1 1 Sun L 20-33 20 33 -13 53
NWE 2014 2014-09-29 8:31 7:31 @ KAN 4 4 Mon L 14-41 14 41 -27 55
NWE 2010 2010-11-07 1:02 1:02 @ CLE 9 8 Sun L 14-34 14 34 -20 48
NWE 2009 2009-11-30 8:40 7:40 @ NOR 12 11 Mon L 17-38 17 38 -21 55
NWE 2009 2010-01-03 1:02 12:02 @ HOU 17 16 Sun L 27-34 27 34 -7 61
NWE 2005 2005-10-02 1:02 1:02 SDG 4 4 Sun L 17-41 17 41 -24 58
NWE 2005 2005-11-07 9:08 9:08 IND 9 8 Mon L 21-40 21 40 -19 61
NWE 2004 2004-10-31 4:15 4:15 @ PIT 8 7 Sun L 20-34 20 34 -14 54
NWE 2003 2003-09-07 1:04 1:04 @ BUF 1 1 Sun L 0-31 0 31 -31 31
NWE 2001 2001-10-28 2:15 2:15 @ DEN 7 7 Sun L 20-31 20 31 -11 51

Do any of those games (or the ones described in more detail above) stick out to you as the right blueprint for Atlanta?  Would you say Atlanta has better odds of winning in a shootout, or in a low-scoring game?

{ 24 comments }

Scoring 3 Different Ways In One Game

Last night, Dion Lewis scored a touchdown for the Patriots on a kickoff return, along with scoring touchdowns on a reception and on a rush attempt. Earlier this year, Tyreek Hill did the same thing to provide the margin of victory over the Broncos.  Those were the 12th and 13th times since 1960 that a player has scored touchdowns three different ways in a game.

  • In 1995, Jimmy Smith pulled off a unique hat trick against the Broncos: He recovered a blocked punt in the end zone for a fumble return touchdown, scored on a lateral on a kickoff return, and caught a touchdown.
  • In 1976, Freddie Solomon, then with the Dolphins, scored via punt return, catch, and run against the Bills.
  • In 1969, Travis Williams of the Packers scored via an 83-yard punt return, a 96-yard kickoff return, and on a 1-yard run against the Steelers.
  • In 1965, Gale Sayers did it three times.
    • Against the Vikings, Sayers scored three touchdowns in the 4th quarter — one on a catch, one on a kickoff return, and one on a rush.
    • Later in his rookie season, Sayers rushed for four touchdowns, caught a touchdown, and had a touchdown on a kickoff return against the 49ers.
    • Two years later, Sayers had another hat trick — and again against San Francisco — by scoring via a kickoff return, punt return, and rushing touchdown.
  • Also in 1967, Saints Walter Roberts pulled off a hat trick against the Eagles, with a kickoff return, fumble return, and receiving touchdown.
  • In 1962, Timmy Brown of the Eagles did what Sayers did in ’65 and what Hill and Lewis did this year.  Against the Redskins, Brown had a 99-yard kickoff return, a 3-yard rushing touchdown, and a 10-yard touchdown reception.
  • In the AFL in 1961, Abner Haynes nearly single-handedly pulled off an incredible 4th quarter comeback against the Bills, with a 69-yard touchdown catch, 3-yard touchdown run, and 87-yard kickoff return touchdown in the final frame.
  • Bobby Mitchell — the other great running back on the Browns in the early ’60s — did it twice. Against the Cowboys in 1960, he had a 46-yard touchdown catch, 30-yard touchdown run, and 90-yard kickoff return touchdown.  A year later, against Washington, Mitchell scored on a punt, catch, and run.

And for completeness’ sake, prior to 1960, Frank Minini, Joe Scott, Spec Sanders, Billy Hillenbrand, Hugh Gallarneau, Jay Arnold, Hank Bruder, Buckets Goldenberg, Art Folz, and Roddy Lamb had a touchdown hat trick at one point in their careers.

{ 3 comments }

The Seahawks and Falcons face off today, and the over/under for the game is 51 points. If that sounds like a lot of points, that’s because it is: it’s the first Seahawks game where the over/under is greater than 50 points since 2004.

13 of 16 Falcons games this season went “Over”, and there was a push in the Falcons/Panthers game in December with an over/under of 49 points. The Seahawks maybe have their worst defense in years (which isn’t much of an insult) with Earl Thomas out, and are facing a dominant Falcons offense.  So it makes sense that this is expected to be the highest scoring Seattle game in years.  Although earlier this year, on the road in a dome against another NFC South team, the over/under was 50 points.

{ 5 comments }

There is a lot of talk about the large point spread in the Patriots/Texans game. New England is a 15.5-point favorite over Houston tonight, tied for the second largest spread ever in a non-Super Bowl playoff game behind only Minnesota/Arizona in 1998.  The over/under is 44.5, which means the projected final score is 30-14.5.

Let’s say the Texans pull off the upset. Are they more likely to do so in a low-scoring game, or in a shootout?  If Houston wins 14-13, they will have come in under their projected points total by 0.5, but held New England to 17 fewer points than expected.  If the Texans win 31-30, they would have exceeded their projected points total by 16.5 points, while holding New England to exactly the number of expected points.

So, which result is more likely? My intuition says a low-scoring game, but what do the numbers say? There have been 24 games since 1985 where a team won despite being an underdog of at least 14 points.  As it turns out, intuition is correct: on average, these underdogs exceeded their projected points for total by 7.8 points, but held their opponents to 13.3 fewer points than expected. [continue reading…]

{ 8 comments }

The Chargers franchise started in Los Angeles in 1960, before moving to San Diego in 1961.  The team spent 56 years in San Diego before deciding to move to Los Angeles yesterday. That’s the longest amount of time any professional football team has spent in one city before relocating.

The Cleveland Browns existed for 50 years, from 1946 to 1995, before Art Modell moved the franchise to Baltimore. Cleveland was given an expansion team three years later, and the new Browns entered the league in 1999.

The Rams also began in Cleveland, playing there from 1937 to 1945.  The team moved west to Los Angeles in 1946, and remained in the greater Los Angeles area [1]The team played in Anaheim from 1980 to 1994. until 1994, when the franchise moved to St. Louis.  That means the Rams existed in LA for 49 seasons before moving to the midwest.  Of course, after 21 seasons in St. Louis, the Rams returned home last season.

The Cardinals were one of the NFL’s original franchises, playing in Chicago from 1920 through 1959.  Then, after 40 seasons in Chicago, the Cardinals moved to St. Louis in 1960.  The team stayed there for 28 years, before moving to Arizona in 1988.

The Houston Oilers were one of the AFL’s initial franchises in 1960, but Bud Adams took the franchise east to Tennessee in 1997.  So after 37 years in Houston, the Oilers moved, but the city received the expansion Texans a few years later.

The only other team to move after 25 years in one city was the Colts, of course.  The franchise began in complicated fashion: the franchise was awarded to Carroll Rosenbloom in 1953, although it really was a legacy of the ’52 Dallas Texans.  The Colts stayed in Baltimore for 31 years, before Robert Irsay – who had traded for the Colts in 1972 – moved the team to Indianapolis after the 1983 season.

What do you think of the Chargers moving to LA?

References

References
1 The team played in Anaheim from 1980 to 1994.
{ 15 comments }

2016 Approximate Value Released

With the All-Pro votes now in, the initial 2016 Approximate Value numbers have been released by PFR. Here are the leaders:

Query Results Table
Games Misc
Rk Player Year Age Draft Tm Lg G GS Yrs PB AP1 AV
1 Matt Ryan 2016 31 1-3 ATL NFL 16 16 1 1 1 21
2 Damon Harrison 2016 28 NYG NFL 16 16 1 0 1 18
3 Aaron Rodgers 2016 33 1-24 GNB NFL 16 16 1 1 0 18
4 David Bakhtiari 2016 25 4-109 GNB NFL 16 16 1 0 0 17
5 Von Miller 2016 27 1-2 DEN NFL 16 16 1 1 1 17
6 Bobby Wagner 2016 26 2-47 SEA NFL 16 16 1 1 1 17
7 Drew Brees 2016 37 2-32 NOR NFL 16 16 1 0 0 16
8 Calais Campbell 2016 30 2-50 ARI NFL 16 16 1 0 0 16
9 Ezekiel Elliott 2016 21 1-4 DAL NFL 15 15 1 1 1 16
10 Julio Jones 2016 27 1-6 ATL NFL 14 14 1 1 1 16
11 Sean Lee 2016 30 2-55 DAL NFL 15 15 1 0 1 16
12 Andrew Luck 2016 27 1-1 IND NFL 15 15 1 0 0 16
13 Alex Mack 2016 31 1-21 ATL NFL 16 16 1 1 0 16
14 Khalil Mack 2016 25 1-5 OAK NFL 16 16 1 1 1 16
15 Le’Veon Bell 2016 24 2-48 PIT NFL 12 12 1 1 0 15
16 Jack Conklin 2016 22 1-8 TEN NFL 16 16 1 0 1 15
17 Kirk Cousins 2016 28 4-102 WAS NFL 16 16 1 0 0 15
18 Aaron Donald 2016 25 1-13 LAR NFL 16 16 1 1 1 15
19 Devonta Freeman 2016 24 4-103 ATL NFL 16 16 1 1 0 15
20 David Johnson 2016 25 3-86 ARI NFL 16 16 1 1 1 15
21 Zach Orr 2016 24 BAL NFL 15 15 1 0 0 15
22 Dak Prescott 2016 23 4-135 DAL NFL 16 16 1 1 0 15
23 Tyrod Taylor 2016 27 6-180 BUF NFL 15 15 1 0 0 15
24 Olivier Vernon 2016 26 3-72 NYG NFL 16 16 1 0 0 15
25 Travis Frederick 2016 25 1-31 DAL NFL 16 16 1 1 1 14
26 Chris Harris 2016 27 DEN NFL 16 15 1 1 1 14
27 Dont’a Hightower 2016 26 1-25 NWE NFL 13 13 1 0 0 14
28 T.Y. Hilton 2016 27 3-92 IND NFL 16 16 1 1 0 14
29 Zack Martin 2016 26 1-16 DAL NFL 16 16 1 1 1 14
30 LeSean McCoy 2016 28 2-53 BUF NFL 15 15 1 1 0 14
31 Benardrick McKinney 2016 24 2-43 HOU NFL 16 16 1 0 0 14
32 C.J. Mosley 2016 24 1-17 BAL NFL 14 14 1 1 0 14
33 Matthew Stafford 2016 28 1-1 DET NFL 16 16 1 0 0 14
34 Aqib Talib 2016 30 1-20 DEN NFL 13 13 1 1 1 14
35 Russell Wilson 2016 28 3-75 SEA NFL 16 16 1 0 0 14
Provided by Pro-Football-Reference.com: View Original Table
Generated 1/12/2017.

You can view the top 100 players here, and individual player AV by team is available as well.

{ 29 comments }

Additional Thoughts On The 2016 Falcons Offense

Atlanta had “only” 175 drives on offense this year, tied with Washington for the fifth fewest drives in the NFL. That’s partially because the offense was so good — Atlanta had the 2nd fewest number of drives end in a 3-and-out, behind only New Orleans — but also because the defense was below average, keeping the offense off the field.

Despite that, Atlanta scored a whopping 540 points. But here’s another way to think about it: the Falcons had just 11 turnovers and 48 punts, meaning just 59 drives ended in a punt or a turnover. That’s the fewest in modern history, one fewer than the 2007 Patriots (who had just 167 drives). And Atlanta scored 58 offensive touchdowns, meaning the offense had nearly as many drives end in a touchdown as a punt or turnover. And that’s just, well, crazy: [continue reading…]

{ 40 comments }

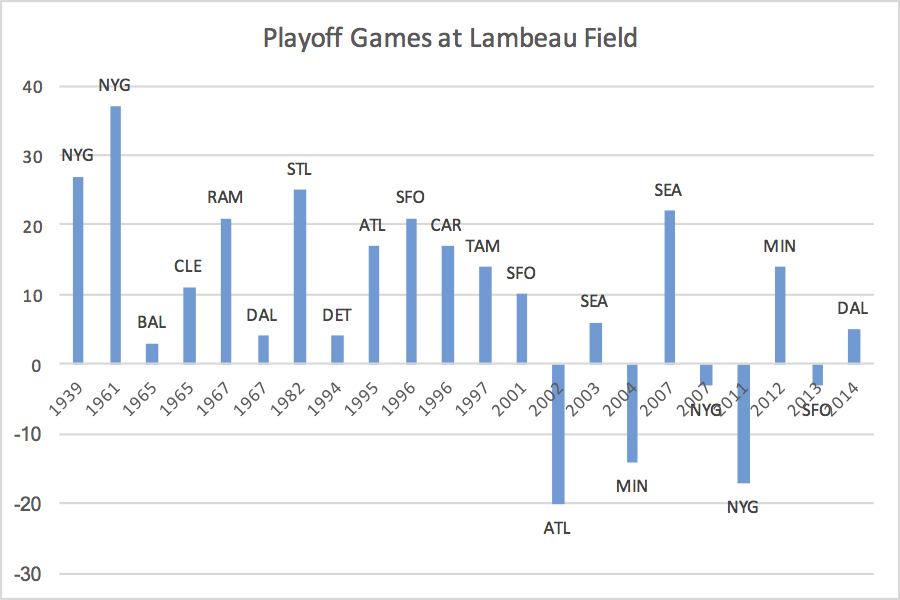
The Packers won every home playoff game for over 60 years. Green Bay was 13-0 at home in playoff games until Michael Vick and the Atlanta Falcons won as 6.5-point underdogs at the end of the 2002 season. Since that 13-0 start, the Packers are a much less intimidating 5-4 in the postseason. Below is the points differential in every playoff game in Green Bay in NFL history:

[continue reading…]

{ 11 comments }

Three games this year had an over/under of 38 points: Rams/Seahawks in week 2, Jaguars/Vikings in week 14, and Broncos/Chiefs in week 16. But today, with the Brock Osweiler-led Texans — Houston ranked 30th in offensive DVOA — facing off against the Connor Cook-led Raiders, in his first ever start, the over/under in Houston is just 37 points.

In addition to being the lowest in a game this season, it’s also the lowest in a playoff game in five years.  Two years ago, the Ryan Lindley Cardinals and Panthers faced off in Carolina; the over-under was 37.5, and Lindley had one of the worst playoff games ever. But the last time a playoff game had an over/under of 37 or lower was in 2011, when Tim Tebow and the Broncos traveled to Pittsburgh. Tebow wound up having an incredible game, leading Denver to a 29-23 win in a game where the over/under was just 34.

In a game with the worst quarterback in the NFL during the 2016 regular season against a quarterback who has never made an NFL start, you can understand why we have the lowest over/under of the season.

But betters, take note. From 2002 to 2015, there were 18 playoff games where the over/under was less than 37.5. In those games, 11 went over, 1 was a push, and 6 went under.

What do you predict today? I was leaning Oakland, but I think the loss of Donald Penn will change things. This feels like a true toss up.

{ 3 comments }

Post Your 2016 Playoff Predictions here

Post your playoff predictions in the comments. Here are mine:

Wild Card Round

(5) Oakland over (4) Houston
(3) Seattle over (6) Detroit
(3) Pittsburgh over (6) Miami
(5) New York Giants over (4) Green Bay

Divisional Round

(1) Dallas over (5) New York Giants
(2) Atlanta over (3) Seattle
(1) New England over (5) Oakland
(2) Kansas City over (3) Pittsburgh

Conference Championships

(1) New England over (2) Kansas City
(1) Dallas over (2) Atlanta

Super Bowl

(1) New England over (1) Dallas

This is a pretty chalky set of picks, but it feels like there are a few tiers in the NFL:

Tier 1: New England. Okay, the Patriots do seem vulnerable without Rob Gronkowski. Tom Brady averaged 9.33 Adjusted Yards per Attempt during the regular season (excluding sacks). On passes to Gronk, Brady averaged an unreal 15.8 AY/A, with 540 yards and 3 touchdowns on 38 targeted passes. On all other passes, he averaged 8.85 AY/A. That’s still great, but an offense with the two highest targeted players are Julian Edelman and James White has the ability to be contained in the playoffs. And while the Patriots don’t have a great defense, the team easily led the NFL in both points allowed and points differential. [continue reading…]

{ 31 comments }
Next Posts Previous Posts