≡ Menu

ESPN’s Total QBR: Updated For 2015

Earlier this week, ESPN announced three key changes to the way its Total QBR metric is calculated. Let’s review them:

1) Interception returns

The base statistic used throughout QBR is EPA, which stands for Expected Points Added per play. So if an interception was returned for a touchdown, that play would obviously have a large negative EPA. For example, when the Chargers had 3rd-and-8 at the St. Louis 8-yard line in the 2nd quarter of a game in week 12 of last season, PFR calculated the Expected Points for that situation as +3.58 for San Diego. When Rivers threw a pick-6 on that play, that situation turned into a -7, which is a swing of 10.58 points. Presumably ESPN’s formula came to a pretty similar result.  And that leaves Rivers with an enormous penalty.

So now, instead of penalizing the quarterback for the actual EPA swing, ESPN will penalize the quarterback for the expected swing based on the type and location of the interception.  This means much smaller penalties on pick sixes, and (one would assume) slightly larger ones on all other interceptions.

This makes sense to me, although it highlights the question of what is QBR actually supposed to measure.  This change, while eliminating some of the randomness involved in a play, moves away from the way QBR has been tied to EPA. On some (though not all) interceptions, whether a player returns it 90 yards or 10 yards is completely random, so penalizing a quarterback a fixed amount (that varies by type and location) is likely going to improve the predictability of the model. What I mean by that is that QBR will become “stickier” from time period to time period, which is a good thing (if you like predictive models). [continue reading…]

{ 46 comments }

On June 15, 2012, I launched Football Perspective. Since that day, Football Perspective has posted at least one new article every single day. This is the site’s 1,249th post, so I won’t blame you if you’ve missed an article here or there. At the top of every page is a link to the Historical Archive, a page that is updated after each post is published.

In what is becoming an annual tradition, I use this space every June 15th to thank the people who have helped make this site successful.  And, as it turns out, every year I feel indebted to even more people.   And this year, that starts with you.

“Never read the comments” is a meme that has near-universal support on the internet.  But that’s not true here, and that’s because Football Perspective’s regular commenters are not just some of the smartest football minds on the planet, but some of the nicest.  And that means the world to me.

Consider, for a minute, what Brad Oremland is doing.  Brad’s a senior writer at Sports-Central, and he planned on writing a series on the greatest quarterbacks of all time this off-season.  And while he’s running that series there, he’s co-running it here, too.  Why? Because of you. Because when smart people put out great work, they want to hear what other smart people have to say.  The fact that a great football mind like Brad is eager to post stuff here just to get feedback from this site’s commenters is a remarkable advertisement for this community.  I remain indebted to the many great folks who comment on this site, and your love, intelligence, and civility motivates me to keep this thing going. [continue reading…]

{ 9 comments }

Philadelphia Eagles and Offensive Turnover

The Eagles 2015 offense isn’t going to look very much like the team’s 2014 offense. The starting quarterback duties were split between Mark Sanchez and Nick Foles last year, but Sam Bradford is expected to be the team’s top quarterback this year. [1]If he falters, Sanchez is still around, but then of course there’s also Tim Tebow. The top running back was LeSean McCoy, but he’s been replaced by DeMarco Murray and Ryan Mathews. And the team’s top wide receiver, Jeremy Maclin, is also gone.

Already, this is pretty freakin’ rare. For purposes of this post, I am going to assume that Mark Sanchez isn’t on the 2015 Eagles roster, because that meet the spirit of the question. [2]Or, you could call Foles the team’s top quarterback if you like. But the way I’m defining top quarterback in this post — the player with the most passing yards — Sanchez would … Continue reading If that’s the case — or if Sanchez doesn’t take a single snap all year — Philadelphia would be the first team since 2008 to have turned over their top quarterback, top running back, and top receiver.

That team was the 2008 Bears. The prior year, the team went 7-9 with an ugly offense, led by Brian Griese, Cedric Benson, and Bernard Berrian. A year later, those three were in Tampa Bay, Cincinnati, and Minnesota.

The only other team since 2002 to meet these standards were the ’06 Saints. You might recall that the 2006 Saints were a very good team that reached the championship game with Drew Brees, Deuce McAllister, and Marques Colston. But Brees and Colston joined New Orleans in ’06, while McAlister missed most of ’05 with an injury; as a result, it was Aaron Brooks, Antowain Smith, and Donte’ Stallworth that were the statistical leaders on the Katrina Saints, a team that ranked 31st in points. [continue reading…]

References

References
1 If he falters, Sanchez is still around, but then of course there’s also Tim Tebow.
2 Or, you could call Foles the team’s top quarterback if you like. But the way I’m defining top quarterback in this post — the player with the most passing yards — Sanchez would get marked down as the ’14 Eagles top passer.
{ 1 comment }

Some house keeping notes today.

1) Every April 1st, friend-of-the-program Matt Waldman (@MattWaldman) releases his Rookie Scouting Portfolio. The RSP not only provides rankings and analysis of all of the major skill position players in this year’s draft, but also provides over 1,000 pages of scouting checklists and play-by-play notes.

Matt does top-notch work year round, and I support just about everything he does.  In fact, I’m a bit delinquent this year in letting you hear about the RSP, and my apologies for that.  But this is not the worst time to bring you news of the RSP, because Matt also writes a post-draft analysis with rankings assembled in a tiered cheat sheet. This is free with the RSP purchase and will be available by the end of this week.

The RSP is $19.95 and available at www.mattwaldman.com. Matt donates 10 percent of every sale to Darkness to Light, a non-profit that combats sexual abuse through individual community and training to recognize how to prevent and address the issue.    Matt’s not only a great football writer, but a great guy, so I don’t think you can go wrong here.

2) Let’s make the smooth transition to a man who has decided that he’s had enough of football.  It’s All Over, Fatman, was the best Broncos website on the internet.  And the main man behind it, Douglas Lee, is another one of the good guys. But last week, IAOFM shut its doors.  Doug is not just a smart guy, but a thoughtful one, and well, here’s an excerpt from his very interesting farewell post:

It’s become increasingly difficult for me to think about football outside the context of the brutal long term physical and cognitive toll the sport exacts upon its players. This would be somewhat more palatable if I thought the league and its owners cared about their current and former players to a greater extent than a settled class action lawsuit dictates. Their actions consistently suggest otherwise.

Given those long-term consequences, I’ve known for quite some time that I wouldn’t want my son to ever play tackle football. More recently, I realized I didn’t necessarily want him to become a fan. Sure, I’ll have far more control over the former than the latter, but what example would I be setting by continuing to pour so much energy into chronicling and analyzing the NFL?

Teams pump players full of (performance enhancing) narcotics to mask pain, stay on the field, and risk more serious injury. But when those players turn to HGH to help rebound from this increasingly brutal sport (hello, Thursday Night Football), they’re branded as cheaters. Owners hold cities up for hundreds of millions of dollars in stadium subsidies, while simultaneously demonizing players who seek to maximize their earning potential during limited career spans.

Those three paragraphs don’t do the whole article justice, so give it a read. Of course, we all wish Doug and the other members of IOAFM well in their future, football-less lives. And I can’t say that I am shocked by his words, or that I haven’t battled some variation of them myself. I don’t know how many people will quit football, but if someone like Doug is going to, that should be enough to make everyone stop and think.

3) Yes, I will surround IAOFM’s farewell with a pair of football fanatics. Arif Hasan, another friend of the program, has put together a great set of post-draft “grades” based on his consensus rankings. It’s well worth a read.

{ 3 comments }

In the comments to this post, Ryan noted that Mike Alstott led the Bucs with 557 receiving yards in 1996, but it was the fewest yards of any player who led his team in receiving yards that season. And in 1997, Karl Williams led Tampa Bay with just 486 receiving yards, also the fewest of any player who led his team in receiving yards that year.

Which made Ryan wonder: why isn’t there a list of the lowest team-leading receiving total across the league for each season? That’s a good question, so I went ahead and generated it for every season since 1950. For example, Jacksonville’s undrafted rookie Allen Hurns led the Jaguars with 677 receiving yards in 2014, but every other team had at least one player with more yards. [continue reading…]

{ 5 comments }

There have been 35 quarterbacks in NFL history to throw for at least 30,000 yards. Given enough time, you could probably guess that Drew Bledsoe, Jim Kelly, and Steve McNair are three of them. All three have something else in common: they were all born on February 14th.

If we drop the cut-off to 16,000 yards, we jump to 130 quarterbacks but get to include David Garrard, another Valentine’s Day baby. But wait, there’s more: If we drop the threshold to 3,500 passing yards, we get to include Patrick Ramsey and Anthony Wright. Those guys may not impress you, but consider that only 322 players have thrown for 3,500 yards. That means dozens of days have zero quarterbacks with 3,500 yards, so slotting in Ramsey and Wright as QB5 and QB6 on your birthday dream team is pretty damn good.

By now, regular readers will have picked up on the fact that this post is a blatant ripoff of Doug’s original post back in 2008, which I updated two years ago. In terms of total career passing yards through the entire history of the league, today has an enormous lead on the second-best birthday, March 24, which consists entirely of Peyton Manning, Aaron Brooks, and Scott Brunner.  Put simply, passing yardage is for lovers, with maybe an exception or two for a certain linebacker or running back.

If you’re looking to give birth to an NFL quarterback, let me give you a word of comfort: one need not be so precise with their delivery dates. That’s because tomorrow, February 15th, is another outstanding day for quarterbacks, ranking in the top five for passing yards. It’s the birthday of Football Perspective love icon John Hadl, a (perhaps) one-day-Hall-of-Famer in Ken Anderson, and former Raider Marc Wilson. So my parenting advice to you is to circle May 14 and May 15 on your calendars, to give yourself a little wiggle room.

Oh, and happy 22nd birthday to one man who is most certainly not a lover of quarterbacks: Jadeveon Clowney.

{ 3 comments }

[Update: You can view the results from our 80 ballots here.]

Regular guest contributor Adam Steele has offered to administer a Wisdom of Crowds edition of the GQBOAT debate. And we thank him for that.


Who is the Greatest Quarterback of All Time? This is a fun question to debate because there is no absolute right answer. In recent years, the practice of crowdsourcing has gained momentum in the analytics community, in some cases yielding more accurate results than mathematical models or expert opinions. For the uninitiated, here’s the gist: Every human being represents a data point of unique information, as all of us have a different array of knowledge and perspective about the world. Therefore, when you aggregate the observations of a group of people, they will collectively possess a greater and more diverse reservoir of knowledge than any single member of the group.

The readers of Football Perspective are an insightful bunch with areas of expertise spanning the entire football spectrum; we are the perfect group for crowdsourcing an age old football question. If you’d like to participate in this experiment, there are just a few guidelines to follow:

1. Create a list of the top 25 quarterbacks of all time, in order, using any criteria you believe to be important. I encourage readers to be bold in your selections – don’t worry about what others may think.

2. Commentary is not necessary, but most definitely welcome. In particular, I’d enjoy seeing a short blurb explaining the criteria you based your selections on.

3. Please compile your rankings BEFORE reading anyone else’s. Crowdsourcing works best when each source is as independent as possible.

4. Please DO NOT use multiple screen names to vote more than once.

I’ll give readers a week or so to cast their ballots, then analyze the results in a follow-up article. A first place vote is worth 25 points, second place 24 points, and so on. Let the process begin!

{ 344 comments }

Open Thread: Post Your Super Bowl XLIX Reactions Here

I’m sure many of you have reactions to the crazy Patriots/Seahawks Super Bowl. Fire away!

{ 77 comments }

Super Bowl Champions and First Round Contributors

The only skill position player in Super Bowl XLIX drafted in the first round

The only skill position player in Super Bowl XLIX drafted in the first round

On offense, the Patriots have one player on the entire roster who was selected in the first round: tackle Nate Solder.  On defense, starters Chandler Jones, Dont’a Hightower, Devin McCourty, and Vince Wilfork were chosen by New England in the first round. And let’s not forget Darrelle Revis, a first round pick of the Jets; those are five of the best players on New England’s defense right now.  The Patriots defense also features Jerod Mayo and Dominique Easley, two former first round picks now on injured reserve.

But most of New England’s key contributors were not first round picks. Tom Brady, of course, was a 6th round pick. Rob Gronkowski was a 2nd, Julian Edelman was a 7th, Brandon Lafell was a 3rd, Rob Ninkovich was a 5th, and so on. Every year, Pro-Football-Reference generates an Approximate Value rating for each player in the NFL. This year, former first round picks of the Patriots generated just 23% of the team’s Approximate Value. [continue reading…]

{ 2 comments }

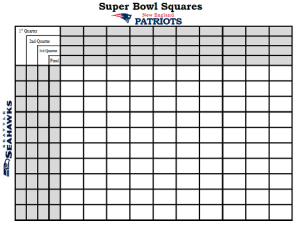
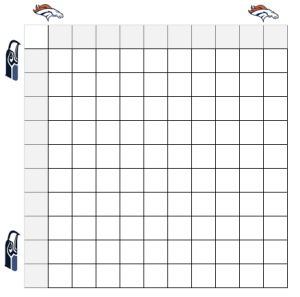
super-bowl-squares-xlixFor the last two years, I’ve written about Super Bowl squares. Well, it’s that time of year again, so here’s your helpful cheat sheet to win at your Super Bowl party.

Every Super Bowl squares pool is different, but this post is really aimed at readers who play in pools where you can trade or pick squares (surely no pool has a prohibition on this!) I looked at every regular season and postseason game from 2002 to 2013. [1]Yes, this means your author was too lazy to update things for the 2014 season, because frankly, the extra work isn’t worth it. The table below shows the likelihood of each score after each quarter, along with three final columns that show the expected value of a $100 prize pool under three different payout systems. The “10/” column shows the payout in a pool where 10% of the prize money is given out after each of the first three quarters and 70% after the end of the game; the next column is for pools that give out 12.5% of the pool after the first and third quarters, 25% at halftime, and 50% for the score at the end of the game. The final column is for pools that give out 25% of the pot after each quarter — since I think that is the most common pool structure, I’ve sorted the table by that column, but you can sort by any column you like. To make the table fully sortable, I had to remove the percentage symbols, but “19, 6.7, 4.1, 2” should be read as 19.0%, 6.7%, 4.1%, and 2.0%. [continue reading…]

References

References
1 Yes, this means your author was too lazy to update things for the 2014 season, because frankly, the extra work isn’t worth it.
{ 0 comments }
Madden cover curses don't scare Sherman

Madden cover curses don’t scare Sherman

The Seahawks had three players named to the Associated Press’ first-team All-Pro roster: inside linebacker Bobby Wagner, safety Earl Thomas, and cornerback Richard Sherman. The Patriots had two such players: tight end Rob Gronkowski and cornerback Darrelle Revis.

It is no surprise that Revis and Sherman were named first-team All-Pros. This is the fourth such time Revis has been so honored, while it’s the third straight year for Sherman. Once deflategate goes away, [1]Just kidding, that will never happen. I expect the media to realize that hey, the teams with the top two cornerbacks in the NFL are in the Super Bowl! That might be a story worth covering! [2]Of course, with Thomas in Seattle, one could extend the story beyond just the cornerback position to the defensive back grouping. In addition, both Patriots safety Devin McCourty and Seattle’s … Continue reading [continue reading…]

References

References
1 Just kidding, that will never happen.
2 Of course, with Thomas in Seattle, one could extend the story beyond just the cornerback position to the defensive back grouping. In addition, both Patriots safety Devin McCourty and Seattle’s other safety, Kam Chancellor, received first-team All-Pro votes, with Chancellor actually being just two votes shy of making the first team, and the leading vote-getter on the second team.
{ 2 comments }
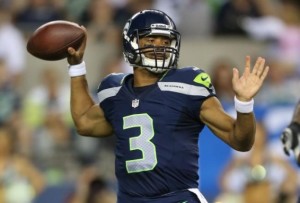
The Seahawks have met high expectations this year, thanks to #3

The Seahawks have met high expectations this year, thanks to #3

Nobody is surprised to see the New England Patriots or the Seattle Seahawks hosting games on championship Sunday. The Patriots are in the AFC title game for the 9th time in 14 years — NINE times! That is insane. Only six other teams — the Steelers, 49ers, Cowboys, Raiders, Broncos, and Rams — have been to nine conference championship games since 1970, a feat New England has matched since 2001.

Perhaps even more incredibly: on Sunday, Foxboro will be the site of the AFC title game for the 7th time in 14 years. Since 1970, just two other cities — Pittsburgh and San Francisco — can match that claim. For some perspective, New York has hosted just two conference title games — the Giants in ’86 and ’00.

Oh, and if you’re counting at home, this will also be the fourth straight year with the Patriots in the AFC Championship Game. Ho hum.

As for Seattle? The Seahawks are the defending champions, and were arguably the top team in football by the end of the 2012 season, too. Seeing Seattle in the NFC Championship Game is no surprise to any football fan.

The Packers and Colts are only slightly more surprising participants. At the start of the season, Green Bay was tied with New Orleans for having the third best odds (behind Seattle and San Francisco) for winning the Super Bowl; the Colts were a distant third behind the Denver/New England tier in the AFC, but still, no other AFC team was as clear a Super Bowl contender after the Broncos and Patriots as Indianapolis. The table below shows the odds (from Bovada) each team was given to winning the Super Bowl at various points in the off-season; the final two columns display what percentage those odds convert to, both before and after adjusting for the vigorish: [continue reading…]

{ 0 comments }

Manning returns to face his former team

Manning returns to face his former team

Today, Peyton Manning will face off against his former team, the Indianapolis Colts, in a playoff game. This is actually the 3rd time Manning has played in a Colts/Broncos playoff game — Manning is 2-0 — but the first time he is facing his former team in the playoffs. This will be just the 4th time that has happened in NFL history.

In 1960 and 1961, Jack Kemp quarterbacked the Chargers to the AFL Championship Game, ultimately losing both times to the Houston Oilers. Then, in 1964 and 1965, Kemp reached the AFL Championship Game again, only this time, the San Diego Chargers were his opponent! Both times! That’s right, in four of the first six seasons, Kemp started in the AFL title game either for or against the Chargers. And in all four games, San Diego went 0-4, as Kemp’s Bills defeated the Chargers, in both games, on the strength of some dominant Buffalo defenses. San Diego did win the AFL title in 1963, otherwise that would go down as one of the saddest stretches in championship game history. [continue reading…]

{ 1 comment }

Nuke

Would you believe this guy is good at catching footballs?

Houston Texans wide receiver DeAndre Hopkins is having a fine year. While his 69 receptions is tied for only 24th in this era where catching passes is easier than ever, he’s averaging an impressive 16.9 yards per reception. No player with more than 50 receptions has a higher yards per catch average, which is why Hopkins ranks 9th in receiving yards despite ranking 24th in receptions.

But 9th is still just 9th, which is a long cry from 1st. But consider that the Texans are just 31st in pass attempts this year: in that light, ranking 9th looks a lot more impressive. And then consider the state of the Houston quarterback play. The Texans actually rank above average in yards per attempt, but there’s a reason that statistic is misleading: that reason is DeAndre Hopkins.

Houston passers (Ryan Fitzpatrick, mostly, with some Ryan Mallett and Tom Savage cameos) are averaging 7.4 yards per attempt, but that is the result of a 10.7 Y/A average on passes to Hopkins and 6.2 yards per attempt on all other passes.

So start with a player who ranks 9th in receiving yards, adjust for the fact that he’s on the team with the second fewest passes in football, and then consider that his quarterbacks are terrible on passes to everyone else on his team. That’s how you end up with Hopkins being responsible for a league-high 38.6 percent of his team’s receiving yards. [continue reading…]

{ 6 comments }

The Worst Matchups in NFL History

Johnson returns to Nashville

Johnson returns to Nashville

The Jets and the Titans play tomorrow, in a matchup of 2-11 teams that ranks as one of the worst in NFL history. If you’re watching this game, you’re either a diehard fan of both teams or are fascinated by the idea of a Chris Johnson revenge game (which is probably even sadder than being a fan of either team). It’s even worse than the Colts-Jaguars game of a few years ago, when the 2-13 Colts needed a loss in Jacksonville to the 4-11 Jags in order to secure the rights to Andrew Luck. Something similar could be on the line in Tennessee: with the Jets, Bucs, and Titans all 2-11 (not to mention the Jaguars and Raiders), there are three quarterback-needy teams in a draft with two marquee quarterbacks: Jameis Winston and Marcus Mariota. As a result, the loser of the New York/Tennessee game could ultimately be the long-term winner.

This will be the first matchup of 2-11 teams since a 2008 game between the Rams and Seahawks. That game turned out to be much less exciting for draftniks with the benefit of hindsight: St. Louis selected Jason Smith with the second overall pick, while the Seahawks drafted Aaron Curry fourth overall.

So what’s the worst matchup of teams in NFL history? You can’t use just winning percentage, and it’s hard to compare teams who have played a different number of games. One solution is to add 11 games of .500 ball to each team. For the Jets and Titans, that would make both teams 7.5-16.5, which translates to an adjusted winning percentage of 0.313. That would be tied for the 19th worst game in NFL history.

The worst? There’s a tie there, too, involving a pair of Colts teams a decade apart. In 1981, the 1-14 Colts defeated the 2-13 Patriots. Baltimore had an adjusted (after adding 11 games of .500 play) winning percentage of 0.250, while New England was at 0.288, for an average of 0.269. The win swung the first overall pick to the Patriots and dropped the Colts to second overall, although Kenneth Sims and Johnie Cooks didn’t change the fate of either franchise. Ten years later, the Colts were again 1-14 and were scheduled to play the 2-13 Bucs. The twist here: Tampa Bay had already traded the team’s first round pick in 1992 to Indianapolis in exchange for Chris Chandler in 1990. The Bucs defeated the Colts, and Indianapolis selected Steve Emtman and Quentin Coryatt with the first two picks. Spoiler alert: that didn’t change the fate of the franchise, either. [continue reading…]

{ 3 comments }

Checkdowns: YPC Differential Leaders

Wilson's rushing prowess has powered Seattle this year

Wilson's rushing prowess has powered Seattle this year

[End of Year update: Seattle finished the season with 2,762 rushing yards on 525 carries, good enough for a 5.26 YPC average. The Seahawks allowed just 1,304 yards on 380 carries, which translates to a 3.43 YPC average. Therefore, the 2014 Seahawks averaged 1.83 more yards per carry than they allowed; that’s the second best differential since the merger, and just a behind the ’63 Browns for the third best since 1950.]

Last season, the Seahawks posted the best ANY/A differential in the NFL. In fact, it was the 9th best ANY/A differential of any team since the merger, and Seattle wound up becoming the 5th team in the top ten in that statistic to win the Super Bowl.

You heard all about Richard Sherman and Earl Thomas and the great Seahawks pass defense, and it’s not as though Russell Wilson was flying under the radar, either. But this year, the Seahawks are recording even more extreme statistics in a different differential stat.

Yards per carry is super overrated: Danny Tuccitto did a nice job revealing that just a couple of days ago. But hey, I love trivia, so let’s move on.

Seattle ranks 1st in the NFL in yards per carry (5.08). Marshawn Lynch is at 4.2 YPC on 132 carries, but it’s Wilson’s 7.6 yards per carry average on 52 carries that sets the Seahawks apart. But the defense — so unstoppable against the pass in 2013 — ranks 1st in this metric, too. Seattle is allowing just 3.19 yards per carry this year; if it holds, that would be the best mark since the 2010 Steelers.

Combine, though, is where the Seahawks really stand out. Seattle has a 1.89 YPC differential, defined as YPC for the offense minus YPC allowed for the defense. How good is that? If it holds, it would be the 2nd best mark since 1950: [continue reading…]

{ 3 comments }
The braintrust.

The braintrust.

The Jets passing offense being bad does not qualify for news.  However, the Jets passing offense and passing defense combining for historically inept numbers? Sure, that qualifies.

New York has thrown 8 touchdown passes this year against 11 interceptions. That’s a -3 differential which is pretty bad.  Only two other teams have negative ratios this year: the Jaguars, also at -3 (11 TDs, 14 INTs), and the Vikings at -5 (6/11).  But the Jets pass defense has allowed 24 touchdowns while forcing just 1… ahem, ONE… interception.  That +23 ratio for opposing quarterbacks is better than any offense this year (the Broncos are at +19 (24/5), and the Patriots and Steelers are both at +20 with matching 23/3 TD/INT ratios).

From the perspective of the Jets defense, though, that +23 reverses to a -23.  Add to that the -3 from the offensive side of the ball, and New York’s combined TD/INT ratio from both units is an incredibly bad -26.

How bad? It’s tied for the 2nd worst number through 9 games since 1970, just narrowly behind the 1975 Cleveland Browns. Those Browns began the year with 3 passing touchdowns and 17 interceptions through nine games. Okay, that was even bad for the dead ball era, but what about the defense? Cleveland allowed 19 passing touchdowns while forcing just six interceptions during that stretch! Those numbers led to an 0-9 start under first-year head coach Forrest Gregg.

The table below shows all teams to start the season with at least a -20 ratio in this statistic I just made up. Here’s how to read the line from the famous 1944 Card/Pitt combination, forced together due to World War II. Through nine games, that team threw 8 touchdowns and 40 interceptions (-32), while allowing 19 passing touchdowns and intercepting just 15 passes (-4), for a total score of -36. [continue reading…]

{ 1 comment }

There's been a long drought in Cleveland

There’s been a long drought in Cleveland

October 27, 1991. The 4-3 Browns were hosting the 3-4 Steelers, and Vegas oddsmakers set the Browns as 1.5-point favorites. Bernie Kosar would complete 21 of 29 passes for 179 yards and a score, while Kevin Mack would lead the team with 54 yards rushing on 19 carries. It was not a great offensive day for the Browns, but the team managed to pick off Neil O’Donnell two times, and held Merrill Hoge to just 48 yards on 12 carries (the factor back chipped in with 56 receiving yards, too). Clay Matthews — the middle one — had one sack, Louis Lipps led all players with 69 receiving yards, and the only thing that would trick you into thinking that this game didn’t take place generations ago was that Matt Stover started the scoring with a 34-yard field goal. [continue reading…]

{ 8 comments }

Are Kickers Faring Worse In 2014?

Does it feel like kicking accuracy is down so far in 2014? Detroit rookie Nate Freese was just 3/7 before the Lions cut him on Monday, with all four misses coming in the 40-to-49 range. Bengals kicker Mike Nugent has also missed four attempts so far this year; for him, a 38-yarder balances out his 55-yard miss, to go along with a pair of unsuccessful tries in the 40-to-49 range.

Tampa Bay placekicker Patrick Murray had a 24-yard attempt blocked in a game Tampa Bay lost by two points. Randy Bullock, the Texans kicker who was Freese before Nate Freese existed, saw his 27-yard attempt blocked by Justin Tuck. [1]Who is not to be confused with the near-automatic Justin Tucker. The Ravens kicker did miss once this year, but we’ll give him a pass since it was a 55-yarder. Eight more kicks were missed in the 30-to-39 range, too, so if you feel like you’ve seen a bunch of missed field goals, well, I won’t tell you how to feel.

But are kickers actually faring worse this year? I broke down field goal attempts in three yard increments (18 to 20, 21 to 23, 24 to 26, etc.) for the first three weeks of each year beginning in 2002. The blue line shows the data from 2002 to 2005, the red line represents kicking from 2006 to 2009, and the green line covers the last four years. Since the data can be choppy, I included larger, smoothed lines, for each four-year period. [continue reading…]

References

References
1 Who is not to be confused with the near-automatic Justin Tucker. The Ravens kicker did miss once this year, but we’ll give him a pass since it was a 55-yarder.
{ 13 comments }

This week at the New York Times, I take a look at how Andy Dalton and Ryan Fitzpatrick are relying on yards after the catch to produce great efficiency numbers.

Two 2-0 teams have ridden the short-passing game to success. For the Cincinnati Bengals and the Houston Texans, the best players in their passing attacks are not the quarterbacks. As a result, both teams have constructed offenses that focus on high-percentage passes and getting the ball into the hands of their best playmakers.

Bengals quarterback Andy Dalton is averaging 9.1 yards per attempt through two weeks and 13.8 yards per completion; both marks are the highest in the league. But Cincinnati players have averaged 9.2 yards gained after the catch per reception, easily the highest mark in the N.F.L. Running back Giovani Bernard is responsible for 25 percent of Dalton’s passing yards, but most of the credit there goes to Bernard. On his 11 receptions, he has gained 141 yards, with 158 yards coming after the catch (Bernard’s average reception came 1.6 yards behind the line of scrimmage). For wide receiver Mohamed Sanu, 90 of his 120 receiving yards have come after the catch, with the majority of those coming on his long touchdown against Atlanta.

As a result of the efforts of players like Bernard and Sanu, 67 percent of Dalton’s passing yards this season have come after the catch. That is the second highest percentage in the league behind Minnesota’s Matt Cassel. While it is easy to be impressed by Dalton’s gaudy numbers, it is fair to wonder how much of the credit belongs to Dalton and how much belongs to his talented teammates.

You can read the full article here.

{ 3 comments }

Checkdowns: Quarterback-Receiver Touchdown Pairings

A good article today from our pal Neil Paine, who asks whether Antonio Gates is the second best tight end in NFL history. I won’t weigh in on that subject, but after catching three touchdowns against the Seahawks on Sunday, Philip Rivers and Antonio Gates have now connected on 63 touchdown passes.

That’s the 10th most in NFL history, and the most by any quarterback/tight end pairing. The table below shows all quarterback-receiver combinations that scored at least 50 touchdown passes, including playoffs (and the AAFC). The final column shows the last year in which the duo scored a touchdown; as you can see, one other active combination is on the list, although Drew Brees and Marques Colston have not connected for a touchdown yet this year. [continue reading…]

{ 15 comments }

The weekly New York Times posts are back! This week, I look at how unusual it is for the Patriots to occupy the AFC East cellar.

After seven months without meaningful football, it is easy to overreact over the first week of the N.F.L. season. This does not mean Week 1 is unimportant; it is as important as any other week.

Still, what happened Sunday, at least in the American Football Conference East, was not any less extraordinary. For only the third time in a single week since 2001, the Patriots lost while the Jets, the Dolphins and the Bills won. The other times that happened were Week 6 in 2012 and Week 15 in 2004. New England ran away with the division title in both of those years, so do not declare the king dead just yet. But to put that statistic in perspective, consider that there have been 17 weeks since 2001 when the Patriots won while the Jets, the Dolphins and the Bills lost.

To understand the A.F.C. East is to understand its history. New York, Buffalo and Miami finished with a better record than New England in 2000. Since then, none of them has. Recent history shows this to be a remarkably stable division: in fact, the 2013 A.F.C. East had the fewest changes in wins of any division from one year to the next since the N.F.L. realigned divisions in 2002. The Patriots have long been the overlord of the division; most expected more of the same in 2014, but it may be time to re-examine that narrative.

You can read the full article here.

{ 3 comments }

Hurns was part of a big Jaguars first quarter

Hurns was part of a big Jaguars first quarter

Jacksonville’s Allen Hurns led all players in the preseason with 232 receiving yards. The 6’3, 195 receiver had a breakout senior year with Miami(FL) — in fact, he set a school record for receiving yards in a season — but that was not enough to get him selected in May’s draft.

We know that the Jaguars spent some time watching tape of the Miami offense, since Jacksonville used a third round pick on Hurricanes guard Brandon Linder. Perhaps that tipped them off to Hurns, who provided immediate returns in week one. What sort of returns?

  • Hurns caught four passes for 110 yards and two touchdowns against the Eagles in week one. Prior to the Calvin Johnson explosion on Monday night, those numbers put Hurns tied for fifth in the league in receiving yards, and tied for second in receiving touchdowns.
  • Hurns became just the 5th player since 1970 to hit the 100-yard receiving mark and catch two touchdowns in week one of his rookie season.
  • Hurns produced the 2nd best performance by an undrafted rookie wide receiver in a season opener since the merger.

[continue reading…]

{ 9 comments }

Friend of the program Stephanie Stradley (@StephStradley) interviewed me over at her blog at the Houston Chronicle to discuss quarterback stats.

Some folks have the point of view that rookie quarterbacks should sit and learn. Some folks have the point of view that the only way a young quarterback can learn is by getting a ton of first team reps in practice and then playing real games. Do the numbers say anything about this?

“This is always going to be an impossible question to answer. We don’t live in a counter-factual world, and nobody knows what would have happened to David Carr if he sat on the bench for a couple of years. Ryan Mallett might benefit from having sat behind Tom Brady for three years, or he might just be the next Curtis Painter (or Brian Hoyer or Jim Sorgi or Rohan Davey).

That said, I’m pretty skeptical of the idea that a quarterback needs to sit and learn. There’s nothing wrong with sitting and learning, but I don’t think it makes a quarterback better.  Aaron Rodgers was great right away after sitting for three years; had he started right away, he almost certainly would not have been that good, but I don’t doubt that he would have still turned into the superstar he is today.

One thing that isn’t really true: rookie quarterbacks aren’t really starting much earlier than they used to. In general, top picks always got a chance pretty early in their careers.”

You can read the full article here.

{ 0 comments }

Unstable Divisions

The AFC East was a very stable division over the past two years. The Patriots won 12 games in 2012 and 12 more in 2013. The Bills, with six wins in 2013, also repeated their 2012 win total. Miami won 7 games in 2012, and then 8 last year. And the Jets followed up a 6-10 season in 2012 with an 8-8 season last year. That’s about as stable as a division can get. The four teams saw their win totals move by an aggregate of just three wins, making the 2012-2013 AFC East the most stable division since realignment.

On the other end of the spectrum: the NFC South. The Falcons dropped from 13 wins in 2012 to just four last year. The Panthers jumped from 7 wins in 2012 to 12 last year, and it didn’t even take Bill Parcells to do it. New Orleans also won seven games in 2012, but jumped to 12 wins in 2013. The team that saw the least movement in the NFC South last year was Tampa Bay, but the Bucs still fell from 7 wins to 4 wins, matching the total movement by all AFC East teams. As a group, NFC South teams had a change of 21 wins from 2012 to 2013, the most of any division since realignment.

That’s hardly new for the NFC South, or for that matter, the AFC East. Since realignment, the NFC South has easily been the league’s most unstable division: the Falcons, Saints, Bucs, and Panthers have seen their win totals fluctuate by an average total of 18.8 wins per year, beginning with the 2002-2003 seasons. The AFC East has been incredibly stable: no team has ever finished with more wins than New England, while the Bills have finished last or tied for last eight times since realignment. As a result, the average movement among AFC East teams — in the aggregate — has been just 6.3 wins.

RkDivisionChange in Wins/YrChange # Wins/Tm Yr
1NFC South15.73.9
2NFC North13.33.3
3AFC West11.93.3
4AFC North11.93.0
5AFC South11.72.9
6NFC East11.32.8
7NFC West10.82.7
8AFC East10.82.7

[continue reading…]

{ 1 comment }

538: NFC West Preview Articles

Yesterday, Neil Paine previewed the NFC East teams over at FiveThirtyEight. Today, yours truly is up with a look at the NFC West.

The Cardinals won 10 games last year, only the second time the team reached double digits in victories since moving to Arizona in 1988. Their run defense was the key. The Cardinals allowed just 1,351 rushing yards, the fewest in the NFL. They ranked first in rushing defense DVOA, Football Outsiders’ main defensive statistic, and stuffed opposing ball-carriers for no gain or a loss on 28 percent of runs, the most in the NFL.

But three of the key players responsible for that success are gone, including inside linebacker Karlos Dansby. Dansby was one of just two players in 2013 to record 100 tackles, more than four sacks, and more than four interceptions. He is a very good run defender, but he is also a strong pass-rusher and is excellent in pass coverage. Of course, that’s why the Cleveland Browns signed him to a four-year, $24 million deal on the first day of free agency.

The Cardinals were prepared for Dansby’s departure, but the other two exits left the team with little time to find a solution. In June, starting inside linebacker Daryl Washington was suspended for the season for (again) violating the league’s substance abuse policy. Like Dansby, Washington is a versatile player: He’s a great pass-rusher (his nine sacks in 2012 were the most by an inside linebacker since Bart Scott’s 9.5 in 2006) and above-average in coverage, in addition to being a strong run-defender.

And last Monday, defensive end Darnell Dockett was lost for the season after tearing the ACL in his right knee. Dockett is not just an above-average 3-4 defensive end against the run, but a team leader and — along with superstar wide receiver Larry Fitzgerald — the player on the team with the longest tenure.

You can read the full article here.

{ 7 comments }

The AP’s All-Pro Voting Process Is a Joke

In early January, the Associated Press announced its All-Pro team. The voting process is pretty simple: 50 voters select their top players at each position, and a first-team All-Pro squad is announced.  The runners-up at each position are placed on the second-team, but that leads to some very odd results. If fans, teams, and Hall of Fame voters are going to put weight on a player being considered a 2nd-team All-Pro, then the voters should actually vote for both a first and second team. Simply naming the second vote getter (or third and fourth vote getters at positions with two starters) as the second-team All-Pro(s) invites significant abuses of the system.

Let’s take a look at the detailed voting breakdown.  I’ve bolded the first-team All-Pro(s) at each position, and italicized the second-team “choices.”

Quarterback

Peyton Manning, Denver, 50.

This one’s pretty easy.

Running Back

LeSean McCoy, Philadelphia, 48; Jamaal Charles, Kansas City, 47; Adrian Peterson, Minnesota, 1; Eddie Lacy, Green Bay, 1.

Did you hear that Eddie Lacy was a second-team All-Pro choice in 2013? That’s because one voter — presumably one in Wisconsin — decided that Lacy was better than McCoy or Charles in 2013. And that’s it. Is Lacy, or for that matter, Peterson, a more-deserving choice as a 2nd-team All-Pro than Matt Forte, Marshawn Lynch, Alfred Morris, Knowshon Moreno, or DeMarco Murray? Who knows — and that’s the point. The 2nd-team All-Pro honors going to Peterson and Lacy are essentially meaningless pieces of information. All we know is that 1 voter out of 50 decided that those two were top-2 running backs in 2013. Gregg Rosenthal noted that it was a shame that Forte was passed over for 2nd-team honors, and I agree with that sentiment. But Forte wasn’t passed over in the literal sense: had the 50 voters actually selected a second-team pair of running backs, I suspect Forte would have been chosen.

It’s also worth noting that it appears as though 3 voters selected only one running back. Brilliant.

Fullback

Mike Tolbert, Carolina, 31; Marcel Reece, Oakland, 8; Anthony Sherman, Kansas City, 5; Bruce Miller, San Francisco, 4; John Kuhn, Green Bay, 1.

Anyone want to offer me 49:1 odds that the AP voter who selected Kuhn also selected Lacy?

Tight End

Jimmy Graham, New Orleans, 49; Vernon Davis, San Francisco, 1.

Vernon Davis was a 2nd-team All-Pro in 2013 because…. 2% of all voters thought Davis was better than Jimmy Graham. Graham should have been a unanimous pick, but we all know what happened here: some voter decided that he wanted Davis to get some love, and figured he could ensure such accolades by placing Davis on the 2nd team by casting just one vote for him. I love Davis, and think he’s probably an underrated player nationally, but how can anyone give any credibility to this “accomplishment”?

[continue reading…]

{ 35 comments }

sb xlviii squaresLast year, I wrote an article about Super Bowl squares. Well, it’s that time of year again, so here’s your helpful cheat sheet to win at your Super Bowl party.

Every Super Bowl squares pool is different, but this post is really aimed at readers who play in pools where you can trade or pick squares. I looked at every regular season and postseason game since 2002. The table below shows the likelihood of each score after each quarter, along with three final columns that show the expected value of a $100 prize pool under three different payout systems. The “10/” column shows the payout in a pool where 10% of the prize money is given out after each of the first three quarters and 70% after the end of the game; the next column is for pools that give out 12.5% of the pool after the first and third quarters, 25% at halftime, and 50% for the score at the end of the game. The final column is for pools that give out 25% of the pot after each quarter — since I think that is the most common pool structure, I’ve sorted the table by that column, but you can sort by any column you like. To make the table fully sortable, I had to remove the percentage symbols, but “19, 6.7, 4.1, 2” should be read as 19.0%, 6.7%, 4.1%, and 2.0%. [continue reading…]

{ 2 comments }

It’s Christmas in January. Again. Thanks to the tireless work of Mike Kania and the P-F-R staff, PFR has now generated the Approximate Values for every player in the NFL this year. For the uninitiated, you can review how AV is calculated here. And if you’re so inclined, you can thank Mike or PFR on twitter. (You can still thank Neil, although he has now officially moved on.)

Here’s a list of the top 100 players. AV is also listed for each player on each team’s roster page on PFR (for Seattle, it’s Richard Sherman). You can use the PFR player finder for all sorts of AV-related fun, too. For example, you could see the player with the most AV on your favorite team (for the Jets, it’s Muhammad Wilkerson), or by position (among wide receivers, it’s a three-way tie between Antonio BrownAlshon Jeffery, and Demaryius Thomas), or by age (among those 35 or older, it’s Peyton Manning, or John Abraham for non-quarterbacks; Vontaze Burfict and Luke Kuechly lead the 23-and-younger crowd.)

Here’s a list of the 25 players with an AV of 15+ or greater:

Games Misc
Rk Player Year Age Draft Tm G GS PB AP1 AV
1 Peyton Manning 2013 37 1-1 DEN 16 16 1 1 19
2 Richard Sherman 2013 25 5-154 SEA 16 16 1 1 19
3 Louis Vasquez 2013 26 3-78 DEN 16 16 1 1 19
4 Navorro Bowman 2013 25 3-91 SFO 16 16 1 1 18
5 Vontaze Burfict 2013 23 CIN 16 16 1 0 18
6 Luke Kuechly 2013 22 1-9 CAR 16 16 1 1 18
7 Drew Brees 2013 34 2-32 NOR 16 16 1 0 17
8 Jason Peters 2013 31 PHI 16 16 1 1 17
9 Jamaal Charles 2013 27 3-73 KAN 15 15 1 1 16
10 Karlos Dansby 2013 32 2-33 ARI 16 16 0 0 16
11 Cam Newton 2013 24 1-1 CAR 16 16 1 0 16
12 Robert Quinn 2013 23 1-14 STL 16 16 1 1 16
13 Philip Rivers 2013 32 1-4 SDG 16 16 1 0 16
14 Tyron Smith 2013 23 1-9 DAL 16 16 1 0 16
15 J.J. Watt 2013 24 1-11 HOU 16 16 1 1 16
16 Muhammad Wilkerson 2013 24 1-30 NYJ 16 16 0 0 16
17 Russell Wilson 2013 25 3-75 SEA 16 16 1 0 16
18 Matt Forte 2013 28 2-44 CHI 16 16 1 0 15
19 Greg Hardy 2013 25 6-175 CAR 16 13 1 0 15
20 Colin Kaepernick 2013 26 2-36 SFO 16 16 0 0 15
21 Andrew Luck 2013 24 1-1 IND 16 16 0 0 15
22 Robert Mathis 2013 32 5-138 IND 16 16 1 1 15
23 LeSean McCoy 2013 25 2-53 PHI 16 16 1 1 15
24 Patrick Peterson 2013 23 1-5 ARI 16 16 1 1 15
25 Ndamukong Suh 2013 26 1-2 DET 16 16 1 1 15
{ 49 comments }

The table below shows the results of every game in the division round of the playoffs from 1990 to 2012. Each game is displayed from the perspective of the home team. For example, last year, Denver hosted Baltimore in the second round of the playoffs, and you can click on the Boxscore link to see the full boxscore at Pro-Football-Reference. Denver lost 38-35 as a 9-point favorite, and the Over/Under was 44.5. The “dnc” means that the Broncos did not cover.

YearHomeRoadBoxscorePFPALineO/UResultATS
2012SFOGNBBoxscore4531-345.5Woncover
2012DENBALBoxscore3538-944.5Lost (OT)dnc
2012ATLSEABoxscore3028-347Wondnc
2012NWEHOUBoxscore4128-9.551Woncover
2011SFONORBoxscore36323.547Woncover
2011NWEDENBoxscore4510-13.550Woncover
2011BALHOUBoxscore2013-837.5Wondnc
2011GNBNYGBoxscore2037-854.5Lostdnc
2010ATLGNBBoxscore2148-1.543.5Lostdnc
2010PITBALBoxscore3124-337Woncover
2010NWENYJBoxscore2128-9.545Lostdnc
2010CHISEABoxscore3524-1043Woncover
2009INDBALBoxscore203-6.544Woncover
2009NORARIBoxscore4514-757Woncover
2009MINDALBoxscore343-2.545Woncover
2009SDGNYJBoxscore1417-942.5Lostdnc
2008TENBALBoxscore1013-333.5Lostdnc
2008CARARIBoxscore1333-1049.5Lostdnc
2008NYGPHIBoxscore1123-439Lostdnc
2008PITSDGBoxscore3524-6.538.5Woncover
2007GNBSEABoxscore4220-7.544Woncover
2007NWEJAXBoxscore3120-13.551.5Wondnc
2007DALNYGBoxscore1721-747.5Lostdnc
2007INDSDGBoxscore2428-1147Lostdnc
2006BALINDBoxscore615-441Lostdnc
2006NORPHIBoxscore2724-4.548.5Wondnc
2006SDGNWEBoxscore2124-546.5Lostdnc
2006CHISEABoxscore2724-8.537.5Won (OT)dnc
2005DENNWEBoxscore2713-344Woncover
2005SEAWASBoxscore2010-8.541Woncover
2005CHICARBoxscore2129-331Lostdnc
2005INDPITBoxscore1821-8.546.5Lostdnc
2004ATLSTLBoxscore4717-6.549Woncover
2004PITNYJBoxscore2017-935.5Won (OT)dnc
2004NWEINDBoxscore203-151Woncover
2004PHIMINBoxscore2714-847Woncover
2003NWETENBoxscore1714-634Wondnc
2003STLCARBoxscore2329-746Lost (OT)dnc
2003KANINDBoxscore3138-353Lostdnc
2003PHIGNBBoxscore2017-443Won (OT)dnc
2002TENPITBoxscore3431-4.544Won (OT)dnc
2002PHIATLBoxscore206-7.538.5Woncover
2002OAKNYJBoxscore3010-5.547Woncover
2002TAMSFOBoxscore316-639.5Woncover
2001NWEOAKBoxscore1613-341.5Won (OT)push
2001CHIPHIBoxscore1933-332.5Lostdnc
2001PITBALBoxscore2710-5.532Woncover
2001STLGNBBoxscore4517-1154.5Woncover
2000MINNORBoxscore3416-849.5Woncover
2000OAKMIABoxscore270-942Woncover
2000NYGPHIBoxscore2010-4.533.5Woncover
2000TENBALBoxscore1024-634Lostdnc
1999TAMWASBoxscore1413-4.538Wondnc
1999JAXMIABoxscore627-837.5Woncover
1999INDTENBoxscore1619-5.546.5Lostdnc
1999STLMINBoxscore4937-752Woncover
1998ATLSFOBoxscore2018-3.553Wondnc
1998DENMIABoxscore383-13.548Woncover
1998NYJJAXBoxscore3424-943Woncover
1998MINARIBoxscore4121-16.552.5Woncover
1997PITNWEBoxscore76-642Wondnc
1997SFOMINBoxscore3822-11.542Woncover
1997KANDENBoxscore1014041Lostdnc
1997GNBTAMBoxscore217-1338Woncover
1996GNBSFOBoxscore3514-541.5Woncover
1996DENJAXBoxscore2730-12.543.5Lostdnc
1996CARDALBoxscore26173.537.5Woncover
1996NWEPITBoxscore283-341.5Woncover
1995PITBUFBoxscore4021-642Woncover
1995SFOGNBBoxscore1727-9.552Lostdnc
1995KANINDBoxscore710-841.5Lostdnc
1995DALPHIBoxscore3011-13.545.5Woncover
1994PITCLEBoxscore299-3.532.5Woncover
1994SFOCHIBoxscore4415-15.546.5Woncover
1994SDGMIABoxscore2221-346Wondnc
1994DALGNBBoxscore359-1043Woncover
1993BUFRAIBoxscore2923-733.5Wondnc
1993SFONYGBoxscore443-841.5Woncover
1993HOUKANBoxscore2028-741.5Lostdnc
1993DALGNBBoxscore2717-13.542Wondnc
1992PITBUFBoxscore324-236Lostdnc
1992SFOWASBoxscore2013-9.539Wondnc
1992MIASDGBoxscore310-237Woncover
1992DALPHIBoxscore3410-6.538Woncover
1991DENHOUBoxscore2624-3.537Wondnc
1991WASATLBoxscore247-11.543Woncover
1991DETDALBoxscore386043Woncover
1991BUFKANBoxscore3714-10.541Woncover
1990BUFMIABoxscore4434-734Woncover
1990SFOWASBoxscore2810-841Woncover
1990RAICINBoxscore2010-643Woncover
1990NYGCHIBoxscore313-733Woncover

Overall, home teams are 67-25 and 49-42-1 against the spread.

{ 1 comment }
Next Posts Previous Posts