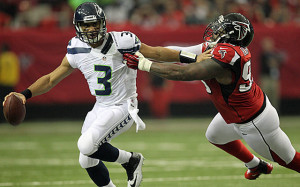
Just a quick data dump here for those inquiring minds. Here are the leaders in NY/A differential, which is simply Net Yards per Attempt (which incorporates sack data) for each team minus the Net Yards per Attempt allowed by that team. Seattle ranks #1 in NY/A differential, as Russell Wilson‘s offense has averaged 6.97 NY/A (which ranks 6th) and the defense has allowed just 4.85 NY/A (which ranks first), giving them a +2.13 NY/A differential.
A special bonus article this week at the New York Times, as I took a look at the incredible career of London Fletcher.
On Sunday, Fletcher, a Washington captain, will play in his 256th straight game, the third-longest streak in N.F.L. history for a player who was not a kicker, behind only Brett Favre’s 299 games and Jim Marshall’s 282.
Having somehow survived for 16 seasons without sustaining any kind of disabling injury, all while playing amid the chaos and attrition rates that are parts of an inside linebacker’s life, Fletcher has said he plans to call it quits after Sunday’s game while he is still ahead.
By the end of this week, though, he was hedging a bit, not quite sure he was truly ready to walk away.
Five weeks ago, Fletcher moved ahead of Eugene Robinson, a safety for 16 seasons, and became the career leader in games played by an undrafted defensive player. Earlier this season, he broke Derrick Brooks’s record of 208 consecutive starts at linebacker. On Sunday, Fletcher will start his 216th consecutive game. He has, in effect, dodged a million bullets in a game that is tough for any player to endure physically.
You can read the full article here. In addition, related readings on Fletcher can be found here and here.
This year, the NFL has eliminated the AFC/NFC distinction, and just selected Pro Bowlers at each position. The results:
Quarterback: Tom Brady, Patriots; Drew Brees, Saints; Peyton Manning, Broncos; Cam Newton, Panthers; Philip Rivers, Chargers; Russell Wilson, Seahawks.
No surprises here. With a full season, Nick Foles and Aaron Rodgers would have made this a more competitive race.
Running back: Jamaal Charles, Chiefs; Matt Forte, Bears; Frank Gore, 49ers; Marshawn Lynch, Seahawks; LeSean McCoy, Eagles; Adrian Peterson, Vikings.
Six of the seven rushing leaders, with Gore jumping ahead of Alfred Morris (fifth in rushing yards).
Fullback: Marcel Reece, Raiders; Mike Tolbert, Panthers.
Clear-cut picks if you read my Fullback Report.
Wide receiver: Antonio Brown, Steelers; Dez Bryant, Cowboys; Josh Gordon, Browns; A.J. Green, Bengals; Andre Johnson, Texans; Calvin Johnson, Lions; Brandon Marshall, Bears; Demaryius Thomas, Broncos.
Six of the top 7 leaders in receiving yards made it, with Alshon Jeffery missing out. Marshall is 11th in receiving yards but in the top seven in both receptions and receiving touchdowns, while Bryant ranks 15th in receiving yards but is tied for the lead among wide receivers in touchdowns.
Tight End: Jordan Cameron, Browns; Vernon Davis, 49ers; Jimmy Graham, Saints; Julius Thomas, Broncos.
If Cameron had 16 more receiving yards, these would be the top four tight ends in fantasy points. Instead it’s four of the top five, overlooking Tony Gonzalez. There’s a good chance Gonzalez makes his 14th Pro Bowl by the time the game comes around.
Tackle: Branden Albert, Chiefs; Jason Peters, Eagles; Tyron Smith, Cowboys; Joe Staley, 49ers; Joe Thomas, Browns; Trent Williams, Redskins.
[continue reading…]
If you look at the Patriots’ PFR page, you’ll see that the Patriots are a 10-3team that’s played like an 8-5 team that has a 6-7 record against the spread. I wondered how often a team with such a good record was below average against the spread. The answer: pretty frequently. Which I suppose isn’t too surprising, since Vegas doesn’t like to make it so easy to win money that all you need to do is pick winners.
New England has mirrored its ancestors from 35 years ago, who also started 10-3 but posted a 7-6 record against the spread. The table below shows all teams from 1978 to 2012, excluding the strike years, to win at least 3 more games outright through 13 weeks than against the spread. In an expected turn of events, the top 4 teams on the list all made the Super Bowl in the prior year. That leads to being favored frequently, and if you win enough close games, you’ll make this list.
[continue reading…]

I don’t know if any of us have ever seen a game quite like the end of Baltimore-Minnesota. With 2:05 left in the game, Baltimore faced 4th-and-goal from the Vikings 1-yard line. The Ravens trailed 12-7.
In what looked to be the game-winner, Joe Flacco hit Dennis Pitta for a touchdown pass. A two-point conversion to Torrey Smith put the Ravens up, 15-12.
On the next play from scrimmage, Matt Cassel hit Jerome Simpson for 27 yards. With 1:27 left, Toby Gerhart rushed up the middle for a 41-yard touchdown, which looked to be the game winner. The Vikings now led 19-15.
But Jacoby Jones returned the ensuing kickoff for what looked to be a game-winning, 77-yard touchdown, to put Baltimore back on top, 22-19.
Matt Cassel then threw a couple of incompletions, before throwing a screen pass to Cordarrelle Patterson…. that the rookie to the house for a 79-yard touchdown. That looked to be the game-winner, as Minnesota now lead 26-22.
But then Joe Flacco drove the Ravens down the field, and hit Marlon Brown for a nine-yard touchdown with four seconds left, in what was actually the game-winner. Baltimore left with a very unlikely 29-26 victory.
Add in the Cassel-to-Simpson touchdown on the second play of the fourth quarter, and that means there were six touchdowns in the final quarter that were lead-changing scores. That’s an NFL record.
Prior to this game, only four games saw five lead-changing touchdowns in the fourth quarter. A Bills-Raiders Ryan Fitzpatrick/Jason Campbell shootout from 2011, a Bruce Gradkowski-fueled comeback win over Ben Roethlisberger and the Steelers in 2009, a Monday Night thriller between the great Mark Sanchez and Chad Henne earlier that same season, and a Giants-Cardinals shootout from 1962. Hat/tip to the great Scott Hanson for alerting me to the record.
Cleveland’s Josh Gordon caught 14 passes for 237 yards and a touchdown against the Steelers last week. Against the Jaguars this afternoon, Gordon caught 10 passes for 261 yards and two scores. In the process, he became the first player to ever record back-to-back 200+ yard receiving games, and set an NFL record with 498 receiving yards in two games.
The table below shows the 53 players to record 350 receiving yards in back-to-back games from 1960 to 2012. Until this year, Houston’s Andre Johnson had the modern record for receiving yards in consecutive games, set just last season. Then Calvin Johnson had 484 yards in two straight games, setting a record that stood for all of five weeks.
Presented below, without comment, is a table of every matchup featuring Tom Brady & Peyton Manning as the starting quarterbacks. Enjoy:
(I originally posted this at the S-R Blog, but I thought it would be very appropriate here as well.)
Just a quick hit of a post to let you know that tonight’s MNF matchup between the 0-6 Giants and the 1-4 Vikings is, in fact, the worst ever this late in the season by combined winning percentage:
It is not, however, the worst by combined PPG margin. That honor belongs to this 1972 game between the 2-5 Patriots and the 1-6 Colts (Baltimore ended up winning 24-17):
Anyway, today’s post is basically a data dump to let everyone know we’ve extended TRY data back to 1950 (before, it was only computed for post-merger seasons). Here are the new all-time career leaders among players who debuted in 1950 or later (see below for a key to the column abbreviations):
[continue reading…]
An interesting tweet from Adam Schefter today: Matt Ryan has 56 regular season wins in his first five seasons, the most in NFL history. Ryan has started 78 games, one of only three quarterbacks (Peyton Manning, Joe Flacco) to start at least 75 games in their first five seasons.
I thought it would be interesting to take a look at not just quarterback wins, but quarterback winning percentage (minimum: 15 wins) and wins minus losses (as a compromise between winning percentage and wins). As it turns out, Ryan ranks 1st in wins, 7th in winning percentage, and 1st in wins over losses (or wins over .500) among all quarterbacks to enter the league since 1960.
Of course, having a good (or bad) winning percentage early in a quarterback’s career doesn’t tell us how much of a “winner” that quarterback will be in the future.
(I originally posted this at the S-R Blog, but I thought it would be very appropriate here as well.)
Here is a google doc containing every team-season in our database since 1957, including the Head Coach and offensive & defensive coordinators. It also specifies those coaches’ preferred offensive or defensive schemes (depending on which side of the ball they specialize in), and attempts to figure out the general offensive family (i.e. Air Coryell, Erhardt-Perkins, etc) each team-season fell into.
THIS IS BY NO MEANS COMPLETE. In fact, it’s very much incomplete at this stage — and that’s where you come in. In the comments of this post, or in an email, we’d love to hear corrections and/or additions to the data, if you see an entry about which you know more than we do (and it’s a good bet you do). Thanks in advance for your help, and hopefully we can assemble a more complete listing of teams’ systems/schemes, which will let us do things like compute splits vs. a certain type of offense or defense, analyze whether 4-3 or 3-4 defenses were better in a given season, etc.
So let those corrections/additions pour in!
Long-time commenter Richie has been kind enough to create an Elo Ranking System where users can rank each of the 32 teams in the NFL. He’s hosting it on his site, but has come up with a Football Perspective-sounding url for us:
http://footballperspective.tooshay.us/teamrate.php
You can read more about how Elo Rankings work here, but the beauty is in its simplicity. All you need to do is answer one question: is Team A or Team B going to be better in 2013?
Vote early and often. The more results, the better. And please share with your friends. It will be fun to see what the wisdom of crowds tells us about team strength as we gear up for the 2013 season.
And a big thanks again to Richie for doing all the legwork!
On September 13, 2008, Doug Drinen wrote this post, which I reproduce in full below.
With the combination arrest/release of Aaron Hernandez stacked upon five surgeries in seven months for Rob Gronkowski and the departure of Wes Welker to Denver, it’s fair to say that many are wondering about the fate of the New England passing game. In addition to those three, Tom Brady is without Brandon Lloyd (free agent) and Danny Woodhead (San Diego), the fourth and fifth leading receivers on the 2012 Patriots. As Jason Lisk pointed out, that puts Brady in historically bad territory when it comes to roster turnover.I’m hearing and reading a lot of crazy stuff this week.
So I just want to document my predictions that (a) the Patriots will win at least 11 games this year, (b) the Patriots will clinch the East before week 17, and (c) Matt Cassel will be a top-12 fantasy quarterback from here out.
That is all.
So today’s post doubles as a temperature check and a contest entry. Please predict the following for Tom Brady in 2013, based on the assumption that he is responsible for 99.4% of all Patriots pass attempts by quarterbacks for the second year in a row. To the extent he is not, I will pro-rate his numbers for purposes of judging the contest. To enter, simply copy and paste this table below in the comments and fill out each line.
Your name:
Brady’s number of pass attempts:
Brady’s number of passing yards:
Brady’s number of passing touchdowns:
Brady’s number of interceptions:
Brady’s number of sacks:
Brady’s number of sack yards lost:
Commentary:
[continue reading…]
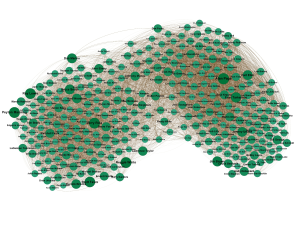 Last week Chase announced this contest in honor of Football Perspective’s first birthday. Here’s the backstory…
A couple of years ago, I moved. The house I was moving into, like many houses, had walls. The walls did not have artwork pre-installed, so I spent a good six months of my life obsessed with finding good wall-art. Somewhere in there, I stumbled on the open-source visualization program called Gephi. It looked super-cool, so I decided to play around with it.
The bug/bean/Australia/peanut/hairball Chase posted last week is the result. In addition to framing one for my own wall, I framed one each for Chase and Lisk, and I mailed them off. I don’t use the word “hero” very often, but really, what other word is there for someone who is talented enough to create world-class art and generous enough to send it to his friends? This was a good thing I had done. So what’s a hero to do when he is told, tactfully of course, by both Chase and Lisk, that his art kinda sucks? I thought the bean’s worth was self-evident.
The mechanics are straightforward. I don’t even remember the specifics but, as you all figured out, this is a roster of the best players in modern-ish NFL/AFL history. The size of a player’s dot represents his quality, as measured by career AV or 100-95-90-… AV — I can’t remember which. The strength of a connection between two players is the number of games they played with and against each other. So Peyton Manning is strongly connected to Marvin Harrison, less connected to Tom Brady, still less connected to Brian Urlacher, and not at all connected to Dan Fouts or Bill George. The layout was determined by Gephi’s “force atlas” algorithm. My understanding is that it pretends the connections are elastic bands — the stronger the connection the tauter the band — and then lets the physics take over. Manning and Harrison naturally end up close together because they are connected by a tight band. Urlacher sort of wants to be close to Manning, but there are tighter bands pulling him in other directions so he doesn’t get too close. He does get closer than Dan Fouts does, though.
[continue reading…]
On June 15, 2012, I launched Football Perspective. Since that day, Football Perspective has posted a new article every single day. This the site’s 445th post, so I won’t blame you if you’ve missed an article here or there. At the top of every page is a link to the Historical Archive, a page that is updated after each post is published. To get in on the celebration, you can enter the Football Perspective Birthday Contest.
A couple of weeks ago, I thanked many of my friends and colleagues who helped mold me into the writer and person I am today. All of those people are responsible for this site getting to see its first birthday, so I thank them again right now. I also want to give an added thank you to Neil, who occasionally adds another voice to this site and is a wonderful sounding board. And I want to thank you, the reader: without you, there wouldn’t be a site. It means a lot to me that you’ve chosen to come here and stop by every day, once or week, or whenever you like.
I checked the stats, and the five most viewed posts in Football Perspective history were:
- What are the odds of that? – July 23rd
- The youngest and oldest NFL teams in 2012 – March 19th
- The best drafting teams from 2000 to 2007 – March 26th
- Chip Kelly is as likely to be the next great coach as anyone else – November 15th
- The History of Black Quarterbacks in the NFL – February 13th
If you’ve been to this site, there’s a good chance you’ve read at least one of those posts. But to the newer readers, I thought I’d take a quick a stroll through the Historical Archive and point out some of my more memorable (at least, for me) articles.
- Before last season, I looked at running back records in the context of Steven Jackson‘s adjusted sub-.300 career winning percentage. And now he’s on a Super Bowl contender in Atlanta.
- I projected Peyton Manning to help the 2012 Broncos set the record for the largest increase in pass completions in a post-Tim Tebow world. That’s one prediction that came true.
- I enjoyed researching this post from before the 2012 season that seems even more true today: unlike for most of NFL history, the best quarterbacks are now passing most frequently. That’s one of the reasons the league average passing averages are rising.
- Does it get any worse than predicting Jacksonville Jaguars coach Mike Mularkey to win Coach of the Year?
- One of my favorite posts ever breaks down what percentage of each receiver’s yards came from which quarterback.
- Before the season, I highlighted how impressive it was for Ray Lewis and London Fletcher to still compete at high levels. Fletcher is back for 2013, which is mind-boggling for an inside linebacker.
- Neil wrote a really interesting article last October: how to estimate NFL win probabilities for matchups between teams of various records – Neil is a very smart dude.
- I argued against taking a left tackle high in the draft a few months before three teams took right tackles with the first four picks. Nice.
- In November, I said Joe Flacco had the 9th most ‘it’ of any quarterback in the NFL. You might think that rating was off, but I’d argue that my low ranking of his “it” caused him to have even more ‘it’ going forward, which ended up in a Super Bowl victory.
- On December 1st, I noticed that the Buccaneers were in the midst of one of the greatest statistical turnarounds ever. As it turned out, Tampa Bay jumped from 32nd and 31st in rushing yards allowed and yards per carry allowed in 2011 to 1st in both categories in 2012.
- In December, Larry Fitzgerald caused me to look at other great receivers who had terrible years in their primes. The two most promising examples were Randy Moss and Steve Smith, who rebounded with new quarterbacks (Tom Brady, Cam Newton) in Year N+1. Will Carson Palmer be enough of an upgrade for Fitzgerald?
- We’ve done a lot of data dumps here at Football Perspective, but Neil’s post of SOS-adjusted Pythagorean Records for every team since 1970 may set the record for packing the most information into one post.
- I know I’m a sucker for graphs, but I loved how this graph on passing turned out.
- My playoff predictions: Denver 31, Baltimore 13 based on stats; Baltimore 23, New England 21 based on gut; San Francisco 27, Baltimore 21 based on Xs and Os. I am sure we can all learn a valuable lesson here. I just don’t know what it is.
- I had no idea that pick-sixes were steadily rising before shooting through the roof in 2012.
- My most time-consuming project might have been figuring out the salary cap values for veteran players.
- I think the discovery that scoring is 60% of the game has a lot of applications.
If you had a favorite post or two from this year, let me know in the comments. One of my goals for Year Two is to get comments section to become a little more active.
Brandon Jackson rushed for 115 yards in an overtime loss against the Redskins on October 10, 2010. How long ago was that? Washington’s quarterback that day was Donovan McNabb. Two months later, Jackson rushed for 99 yards in a loss in Foxboro, and Ryan Grant had 92 rushing yards in a September victory in Chicago in 2011, but no Packer has hit the century mark in a regular season game since October 10th, 2010. (It’s worth noting that James Starks rushed for 123 yards in a playoff victory against the Eagles in the 2010 playoffs, but NFL game streaks routinely exclude postseason performances.)
The table below lists all teams since 1960 to go at least 32 games without a 100-yard rusher. Here’s how the second row of the table reads: The Washington Redskins went 72 games without a 100-yard rusher. The team’s last 100-yard rusher came in a game on December 17, 1961, and the streak finally ended on September 24, 1967. The player to break the streak was Bobby Mitchell, and you can see the boxscore from that game in the final column.
[continue reading…]
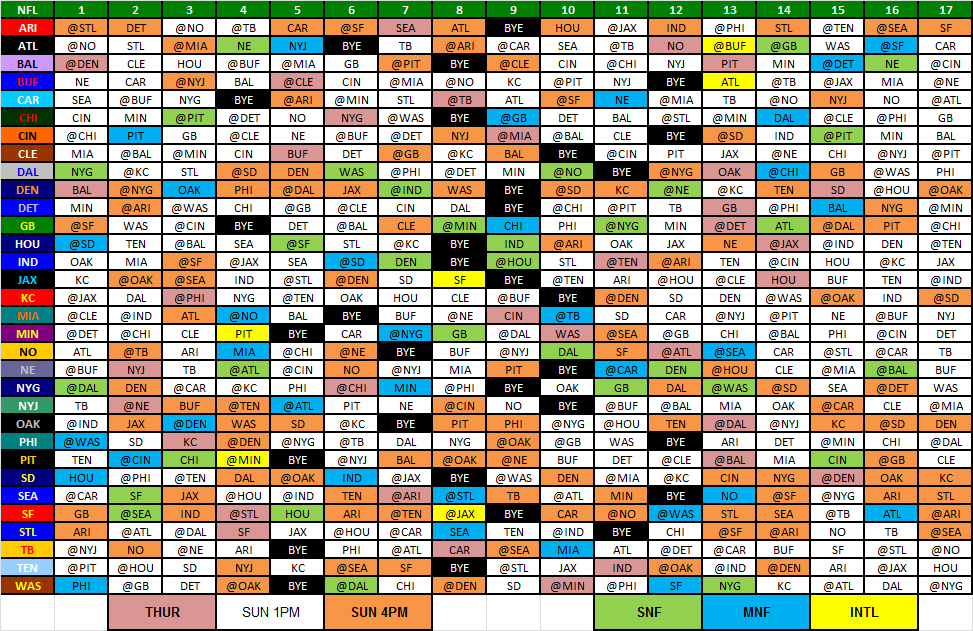
I have created a wallet-sized color copy of the 2013 NFL Schedule, which you can download here:
That Excel file also contains a full page color copy of the schedule, along with black and white wallet-sized and full page size schedules. On the wallet-sized photos, the line between weeks 8 and 9 has been enlarged — that is where you want to fold the paper in half.
If you don’t like downloading Excel files, you can just bookmark this page. If you have an iPhone, point your web browser to that page, and then hit your power and home button at the same time to take a photo. It’s been formatted to fit that screen will enable you have always carry the schedule on your phone.
As a reminder: tracking things like game-winning touchdowns is only interesting in a trivial sort way. I looked at all games, regular and postseason, in all leagues, from 1940 to 2012, and counted all touchdowns scored that put the player’s team ahead for good (with one exception: I did not count touchdowns scored when down by 7 and the team successfully went for two afterwards). The table below shows all players with at least 4 such game-winning touchdown passes. It won’t do much to settle the Brady/Manning debate.
[continue reading…]
Yesterday, I talked about how optimistic I was about nearly every team in the NFC. On the other hand, most of the teams in the AFC are rebuilding, whether they know it or not. In fact, figuring out which team is the 3rd best team in the conference is much more challenging than it should be. Let’s break the AFC into tiers.
The “Going to Meet in the AFC Championship Game” Tier
Denver Broncos
New England Patriots
[continue reading…]
It’s April, so most of these points will probably look silly in 9 months, but the NFC should be the class of the NFL in 2013. I think you can make a convincing case for practically every team in the NFC as a possible playoff contender, which means a lot of coaches in that conference are going to be wondering what went wrong by December. Here’s my quick thoughts on each team:
San Francisco 49ers – returning NFC Champions lost Dashon Goldson, Isaac Sopoaga, and Delanie Walker, but added Anquan Boldin, Nnamdi Asomugha, Glenn Dorsey, and Phil Dawson. With Colin Kaepernick entering his second season as starter and a roster full of first round talent, it’s hard to imagine anything shy of another double-digit win season and a Super Bowl run for the 49ers. And they have 13 picks in April’s draft. I still see them as having a chance to become this generation’s version of the Lombardi Packers.
Seattle Seahawks – maybe the best team in the NFL by the end of last year, the Seahawks solved their two biggest problems in the first week of free agency. The Percy Harvin trade adds another dimension to one of the toughest offenses in the NFL to stop, while signing Cliff Avril and Michael Bennett significantly improves the pass rush. Seattle could challenge for the league lead in sacks. Having Bruce Irvin, Avril, and Bennett on the field on third downs — especially at CenturyLink Field — will be a nightmare for opposing offenses.St. Louis Rams – the Rams went 4-1-1 in the division last year and Jeff Fisher did a fantastic job turning the culture around. There were some significant losses in the offseason — Steven Jackson, Danny Amendola, Bradley Fletcher and Brandon Gibson — but the two biggest moves were paying for Jake Long and Jared Cook. St. Louis has the 16th, 22nd, and 46th picks in the draft, so they should be better in a month. They have a brutal division, but it’s clear that they’re moving in the right direction. You could argue that three of the five best coaches in the NFL are in the NFC West, and that doesn’t include the reigning Coach of the Year.
[continue reading…]
The Rams finished with the best division record in the NFC West last year at 4-1-1, but St. Louis went only 3-7 in games against non-NFC West opponents. The Jaguars were 0-10 in non-division games last season, but beat both the Colts and Titans to finish 2-4 against the AFC South. Since the merger, three teams have won six more games against division rivals than against non-division opponents. Two of those teams did so in 1998, when the Cowboys went 10-6 thanks to a 8-0 record against the NFC East and a 2-6 mark against the rest of the league (in the playoffs that year, Dallas lost to an NFC East team, a choke that was presumably not Tony Romo’s fault). Over in the AFC, the Titans finished 7-1 against the AFC Central and 1-7 against the rest of the NFL. Technically, the ’82 Dolphins went 7-1 against the AFC East and 0-1 against Tampa Bay during the strike-shortened season, so they fit the criteria, too.
In the new eight-division, four-teams-per-division format, each team plays six games against division opponents and 10 games against non-division opponents. The table below shows all teams since 2002 that won more at least 1.5 more games against division rivals than non-division opponents:
[continue reading…]
On Thursday, I looked at the increase in pick sixes per interception in the NFL. Brian Fremeau asked if that was also going on at the college level, so let’s take a look.
In 2012, there were 159 pick sixes according to cfbstats.com, matching the number provided at Sports-Reference.com. That’s right in line with previous numbers. The table below shows the number of pass attempts, interceptions, and pick sixes in major college football games since 2006, courtesy of cfbstats.com.
It’s pretty interesting that the interception rates in college and the NFL are nearly identical. The interception rate in the NFL was 3.1% in 2007 and 2.9% in 2011, just about what it was in college football in those years. And with the exception of the crazy-high Pick Six rate in the NFL in 2012, both leagues see about 10% of all interceptions returned for touchdowns. Unfortunately, I don’t have the data to see if the Pick 6 rate was 5% in the ’50s in college football like it was in the NFL. But my guess is the trend would hold and that there’s an inverse relationship between interception rate and pick six rate.
With Anquan Boldin being traded to San Francisco, he’ll have the rare opportunity to win the Super Bowl in consecutive years with different teams. Here’s another bit of trivia: if Boldin makes it back to the Super Bowl, he’ll become just the 11th player to ever make Super Bowls with three different teams. (man, the Anquan Boldin tag at Football Perspective has gotten way more use than I ever expected).
If you’re a reader of this site and in college, chances are this opportunity might interest you.
An NFL team is looking for football research interns for the summer. There is a chance that the position could become full time after the summer if the candidate is outstanding.
All interested candidates should send a resume and cover letter to nflanalyticsintern [at] gmail [dot] com. In the cover letter, please detail any relevant analytics experience and describe one question you would like to study if you had access to an NFL team’s data. Special preference will be given to those with database and/or programming skills.
Best of luck to anyone who applies.
In some ways, it’s hard to find a comparable receiver to Welker. He’s been so productive for so long that it’s easy to be unimpressed with the 118 catches, 1,354 yards, and six touchdowns he had last year, but no receiver had ever switched teams after catching more than 101 catches in a season. Only two receivers — Muhsin Muhammad and Yancey Thigpen — gained more receiving yards in a season than Welker did in 2012 and then played for a new team the next year.
But Welker’s amazingly unique numbers are a product of playing in a very pass-friendly environment on a team that threw 641 passes last year. To compare players across systems and eras, I came up with a wide receiver ranking system last month. That will allow us to look at the best receivers to switch teams and not just the ones from the last couple of decades. For some perspective, Welker ranked 8th among wide receivers last season, although that’s without any Tom Brady-adjustment.
The table below contains a lot of information. It shows receivers who added over 200 yards of value over average in Year N and then played for a new team in Year N+1. For each player, I’ve listed his old team, his age in Year N, some traditional statistics, the amount of value added by the receiver, and his rank among wide receivers. Then starting in the “N+1 tm” category, we see his new team, his statistics in the new season, how much value he added in Year N+1 and his rank in that season.
[continue reading…]
In addition to Lewis, Matt Birk of the Ravens also joins the list, and for the heck of it, I’ve included Anquan Boldin, who has hinted that he might retire. Full disclosure: I defined a player as “retiring after winning the Super Bowl” if his last season came during a year in which he played for the eventual Super Bowl champ. So Wes Chandler, who played for the ’88 49ers but retired in mid-season, is included in this list even though he shouldn’t be. Ditto Michael Dean Perry, who was on the Broncos in 1997 but actually finished the season with the Chiefs. I could filter out all the Chandlers and Perrys of the world, but my time is better spent elsewhere (for that matter, just about every person’s time is better spent elsewhere), and therefore I’ll present the full, overinclusive list instead of spending an extra hour of time fixing it and possibly not presenting it at all.
The table is sorted by the Career AV column; the AV column shows the player’s AV in his final season.
[continue reading…]
As it turns out, 30 of 47 Super Bowl champions saw their quarterback made the Pro Bowl. That doesn’t include the 2012 Ravens, as Joe Flacco was not a Pro Bowl selection, but it does include the ’69 Chiefs, the only team with two quarterbacks to make the Pro Bowl (Len Dawson and Mike Livingston). The Ravens did have two Pro Bowl running backs, though (Ray Rice and Vonta Leach), joining the ’93 Cowboys (Emmitt Smith, Daryl Johnston) and the ’72 and ’73 Dolphins (Larry Csonka, Mercury Morris) as the only Super Bowl champs with multiple Pro Bowl running backs.
Arguably the least represented position is cornerback, which might be relevant to yesterday’s post: the average Super Bowl champion had just 0.45 Pro Bowl cornerbacks, the lowest average among positions that always have multiple starters (as opposed to defensive tackles or inside linebackers). Both Charles Woodson and Tramon Williams made the Pro Bowl for the 2010 Packers, but eight of the last nine Super Bowl champions failed to place a single cornerback in the Pro Bowl in that season. The full table, below:
[continue reading…]
All your NFL draft needs will not by satisfied by Football Perspective. I’ll be writing some meta draft articles, discussing draft pick value, historical expectations, and the like, but I won’t delve too deeply into the current crop of prospects for the 2013 draft. Fortunately, there are many excellent resources out there. I asked Sigmund Bloom and Matt Waldman for their thoughts on some of the best writers covering the 2013 draft. Listed below are their excellent recommendations (along with a few of my own) that should serve your draft needs well; I have also provided links to the twitter accounts of each writer (click on the person’s name for their twitter feed) for the more social media-friendly readers out there:
- Gil Brandt and Daniel Jeremiah both write at NFL.com (Brandt; Jeremiah)
- Josh Norris can be found at Rotoworld
- Rob Rang and Dane Brugler contribute at CBS Sports
- Eric Stoner and Ryan Lownes are both at Bleacher Report (Stoner’s profile; Lownes’ profile), and each does some work on the the side
- Ryan Riddle and Matt Miller can also be found at Bleacher Report
- Russ Lande is a must-read at the National Football Post, and he has his own site, RussLande.com
- Matt Bitonti writes at DraftDaddy
- Tom Melton has his own draft blog
- Eric Galko and Alex Brown can be found at Optimum Scouting
- Scott Wright and Shane Hallam are at Draft Countdown
- Walter Cherepinsky and Charlie Campbell publish a ton of material for Walter Football
- Chris Steuber is at Ourlads
- Josh Buchanan is your resource for small-school prospects
- Tony Pauline writes at Draft Insider
- Lance Zierlein can be found at The Sideline View
San Diego’s Danario Alexander caught 37 passes for 658 yards and 7 touchdowns in 10 games last year. Those might not look like great numbers, but when Philip Rivers looked his way, Alexander tended to produce. Alexander only saw 62 targets last season, but led the league with a 10.6 yards-per-target average (minimum 50 targets). Since 2000, there have been 21 receivers to average at least 11 yards per target on 50 targets.
I’ve blanked out the first two rows, because the same player has recorded the two highest yards/target seasons over the last thirteen years. Can you guess who it is?
[continue reading…]

