≡ Menu

ravIn 2009, Doug produced a Super Bowl Squares post, itself a revival of his old Sabernomics post eight years ago. In those posts, Doug derived the probability of winning a squares pool for each given square (or set of numbers). Unsurprisingly, he found that those lucky souls holding the ‘7/0’ squares were in good shape, while those left holding the ‘2/2’ ticket were screwed. You can download the Sports-Reference Super Bowl Squares app here, which is free, and should help you taunt your guests at your Super Bowl party.

Let’s say that this year, your Super Bowl squares pool allows you to either pick or trade squares: if that’s the case, this post is for you. I looked at every regular season and postseason game from the last ten years. The table below shows the likelihood of each score after each quarter, along with three final columns that show the expected value of a $100 prize pool under three different payout systems. The “10/” column shows the payout in a pool where 10% of the prize money is given out after each of the first three quarters and 70% after the end of the game; the next column is for pools that give out 12.5% of the pool after the first and third quarters, 25% at halftime, and 50% for the score at the end of the game. The final column is for pools that give out 25% of the pot after each quarter — since I think that is the most common pool structure, I’ve sorted the table by that column, but you can sort by any column you like.
[continue reading…]

{ 7 comments }

Ever wondered which Super Bowl teams were the oldest or youngest? I went and calculated the AV-adjusted age of every team to appear in the Super Bowl. (AV stands for Pro-Football-Reference’s Approximate Value system, which assigns an approximate value to each player in each season; you can read more about it here.) You can probably guess who the oldest team was, but the youngest might be a bit of a surprise. Baltimore and San Francisco both come in roughly in the middle of the pack, with the Ravens slightly older than the 49ers. This also jives with Football Outsiders’ snap-adjusted ages article.

Bill Barnwell wrote a good article yesterday summarizing the success of Ozzie Newsome, the Baltimore Ravens general manager. That made me curious to see what percentage (based on AV, not total players, naturally) of the players on each Super Bowl team had never before played for another team. Great general managers do more than build their teams through the draft (and Barnwell specifically praised Newsome for that, including the trade for Anquan Boldin), but the question of what percentage of the team is “homegrown” is still an interesting one.

For the Ravens, 73% of their players (as measured by AV) have never played for another team, with Boldin, Cary Williams, Jacoby Jones, Bryant McKinnie, Matt Birk, Bernard Pollard, Corey Graham, and Vontae Leach being some notable exceptions. On the other side, 75% of the 49ers have only worn the red and gold, although Justin Smith, Jonathan Goodwin, Randy Moss, Donte Whitner, Carlos Rogers, Mario Manningham (at least, in the regular season) were key contributors who are not home-grown 49ers.

When it comes to AV-adjusted age or measuring how ‘home-grown’ each team is, neither team really stands out from the pack. The ’78 and ’79 Steelers featured 22 starters that were all home-grown, although making placekicker Roy Gerela the lone outlier (and since AV does not include kickers, both Pittsburgh teams were at 100%).

In addition to the AV-adjusted ages and “home-grownness” of each Super Bowl participant, the table below includes where each team (since 1970) ranked in points for, points allowed, yards, and yards allowed, and whether or not the team won the game. The table is fully sortable and searchable, and the rows for San Francisco and Baltimore will remain highlighted after sorting.

[continue reading…]

{ 16 comments }

I was planning on ignoring the latest Randy Moss news, using that word liberally as it applies to things said on media day. In case you missed it, Moss said yesterday that he believes he is the greatest receiver of all time. Moss is an obvious future Hall of Famer, but Jason Lisk gave Moss’ comments the appropriate treatment yesterday.

Today, though, Moss upped the ante by noting that “Jerry Rice had two Hall of Fame QBs his whole career. Give me that and see where my numbers are.” Yes, Rice was fortunate to play with Joe Montana and Steve Young, , but there is a pretty simple response to that. I wrote that response when Rice was a finalist for the Hall of Fame three years ago. You can read the full HOF profile I wrote on Rice, but I’ve reprinted Part III below:
[continue reading…]

{ 19 comments }

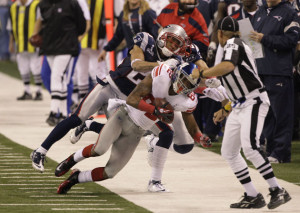
Manningham won't be a Super Bowl hero this year.

Manningham won't be a Super Bowl hero this year.

Last year, Mario Manningham was one of the stars of Super Bowl XLVI, as his great sidelines catch helped the Giants defeat the Patriots (although it wasn’t even his most meaningful catch in that game). As a member of the 49ers this season, Manningham has been placed on injured reserve, but that doesn’t make him ineligible to earn a second straight Super Bowl ring. Brandon Jacobs, who was waived by the 49ers in December, is in the same boat.

How rare is that? Believe it or not, only four players in NFL history have ever won back-to-back Super Bowls with different teams. Guard Russ Hochstein was drafted by Tampa Bay in 2001 and played in one game in 2002; he was waived in October and signed by the Patriots a week later. He stayed in New England through 2008, so Hochstein picked up a Super Bowl ring for his cup of coffee with the Bucs and then earned two more the next two seasons in New England. Hochstein was also a freshman with Nebraska in 1997, when the Cornhuskers were named national champions by USA Today and ESPN.

Defensive back Derrick Martin was drafted by Baltimore in 2006 and has already spent time with four distinguished franchises. He made the AFC Championship Game with the Ravens in 2008, won the Super Bowl with the Packers in 2010, won another super Bowl with the Giants in 2011, and nearly made it back there this year with New England.

Those are the two obscure names. The other two? Well, let’s see if you can guess.

Trivia hint 1 Show


Trivia hint 2 Show


Trivia hint 3 Show


Click 'Show' for the Answer Show

{ 6 comments }

Want to see how passing has changed in the NFL over the last 63 years? A picture is worth at least 1,000 words in this case. The graph below shows the number of interceptions per dropback (red), sacks per dropback (purple), non-INT incomplete passes per dropback (yellow) and completions per dropback (green). Of course, a dropback is simply a pass attempt or a sack. The information is stacked on top of each other for ease of viewing.

pdist2
[continue reading…]

{ 6 comments }

Super Bowl XLVII Prop Bets

I don’t advocate betting on football games and neither does Football Perspective. However, as a person who spends lot of time trying to measure events that are difficult to measure, as an academic exercise, I find this list of Super Bowl Prop bets pretty interesting.

MVP and First to Score a Touchdown Odds

SUPER BOWL XLVII – Odds to Win MVP?

Colin Kaepernick (SF) QB 7/4
Joe Flacco (BAL) QB 11/4
Frank Gore (SF) RB 7/1
Ray Lewis (BAL) LB 7/1
Ray Rice (BAL) RB 10/1
Michael Crabtree (SF) WR 14/1
Anquan Boldin (BAL) WR 16/1
Vernon Davis (SF) TE 18/1
Torrey Smith (BAL) WR 20/1
Ed Reed (BAL) FS 33/1
Aldon Smith (SF) LB 40/1
Dennis Pitta (BAL) TE 40/1
Randy Moss (SF) WR 40/1
Patrick Willis (SF) LB 50/1
Terrell Suggs (BAL) LB 50/1
Dashon Goldson (SF) FS 66/1
David Akers (SF) K 66/1
LaMichael James (SF) RB 66/1
NaVorro Bowman (SF) LB 66/1
Bernard Pierce (BAL) RB 75/1
Justin Tucker (BAL) K 75/1
Ted Ginn Jr. (SF) WR 75/1
Alex Smith (SF) QB 100/1
Delanie Walker (SF) TE 100/1
Field 22/1

Player to score the first TD in the game?

Frank Gore (SF) RB 13/2
Ray Rice (BAL) RB 15/2
Michael Crabtree (SF) WR 15/2
Anquan Boldin (BAL) WR 8/1
Colin Kaepernick (SF) QB 8/1
Vernon Davis (SF) TE 9/1
Torrey Smith (BAL) WR 10/1
Dennis Pitta (BAL) TE 12/1
Randy Moss (SF) WR 12/1
Delanie Walker (SF) TE 18/1
Bernard Pierce (BAL) RB 20/1
Ed Dickson (BAL) TE 25/1
Jacoby Jones (BAL) WR 25/1
Joe Flacco (BAL) QB 30/1
Vonta Leach (BAL) FB 33/1
Ed Reed (BAL) FS 33/1
Anthony Dixon (SF) RB 33/1
Ted Ginn Jr. (SF) WR 33/1
Ray Lewis (BAL) LB 50/1
Field 17/2
No TD scored in the game 75/1
[continue reading…]

{ 6 comments }

Presented without comment, the most current Simple Ratings, weighted for recency:

RkTeampfr_idMean (SRS)Std. ErrorUpperLower
1Seattle Seahawkssea13.573.2219.927.23
2New England Patriotsnwe12.393.3518.985.81
3San Francisco 49erssfo10.233.3316.803.66
4Denver Broncosden9.543.3416.122.96
5Green Bay Packersgnb7.083.2813.540.62
6Atlanta Falconsatl6.603.3113.110.08
7New York Giantsnyg5.943.4312.70-0.82
8Chicago Bearschi5.763.4312.50-0.99
9Baltimore Ravensrav4.053.2410.42-2.33
10Washington Redskinswas3.523.3310.08-3.04
11Minnesota Vikingsmin3.303.379.94-3.34
12Cincinnati Bengalscin2.833.319.36-3.69
13New Orleans Saintsnor2.063.428.80-4.68
14Carolina Pantherscar1.503.428.23-5.23
15Houston Texanshtx1.483.247.85-4.90
16St Louis Ramsram0.753.437.50-6.00
17Dallas Cowboysdal-0.243.436.51-6.99
18Pittsburgh Steelerspit-0.783.435.98-7.53
19Tampa Bay Buccaneerstam-1.053.415.67-7.78
20Miami Dolphinsmia-2.843.443.93-9.62
21San Diego Chargerssdg-2.913.423.82-9.64
22Detroit Lionsdet-3.513.423.22-10.24
23Arizona Cardinalscrd-4.473.442.30-11.23
24Indianapolis Coltsclt-5.063.301.45-11.56
25Cleveland Brownscle-5.403.441.37-12.17
26Buffalo Billsbuf-6.703.440.07-13.46
27New York Jetsnyj-7.353.43-0.60-14.09
28Philadelphia Eaglesphi-9.883.43-3.12-16.65
29Oakland Raidersrai-10.523.42-3.78-17.26
30Tennessee Titansoti-10.603.45-3.81-17.38
31Jacksonville Jaguarsjax-13.943.43-7.19-20.69
32Kansas City Chiefskan-14.403.43-7.65-21.16

“Upper” and “Lower” are the 95% confidence intervals around each estimate. Roughly speaking, this means we can be 95% confident that, say, the 49ers’ “true” SRS rating is between 3.66 and 16.80.

{ 1 comment }

Yesterday, I provided my preview of the NFC Championship Game, and I’ll do the same for the AFC tomorrow. But today, here’s a listing of every conference championship game the since the NFL merger. The table below shows each game from the perspective of the winning team and includes a linkable boxscore for each game. The table also includes the Offensive SRS and Defensive SRS grades for each team and each opponent, along with the total SRS difference between the two teams. The final column shows the Vegas spread. You can search for all AFC or NFC games, or all games with BUF or DAL, for example. If you type in “NYG” you will see the five NFC Championship Games the Giants were in: not only was New York 5-0, but they were underdogs in four of those games. As always, the table is also fully sortable.
[continue reading…]

{ 3 comments }

So I went to grab Harbaugh by the neck and...

Unlike Carroll, Kelly has no pro experience

Yesterday, the Philadelphia Eagles announced that Oregon’s Chip Kelly would be their new head coach. In November, I provided my thoughts on Kelly and Chris Brown wrote his definitive piece on Kelly’s offensive system, a must read.

One of the biggest knocks on Kelly is that he has no prior NFL experience, as either a player or assistant coach. The goal of this post is to compile a list — this is where you come in, please chime in using the comments feature — of all first-time NFL head coaches with no prior NFL experience.

Note that Steve Spurrier (former player), Nick Saban (former Browns defensive coordinator) and Bobby Petrino (former Jaguars offensive coordinator) don’t count. So who does? So far, here is the running list, which will be updated once new names are established.

Chip Kelly (Eagles 2013) – college player, assistant/HC for 23 years (last at Oregon)
Mike Riley (Chargers 1999) – college player, assistant/HC for 24 years (last at Oregon State)
Dennis Erickson (Seahawks 1995) – college player, college assistant/HC for 26 years (last at Miami)
Barry Switzer (Cowboys 1994) – college player, college assistant/HC for 28 years (last with Oklahoma)
Jimmy Johnson (Cowboys 1989) – college assistant/HC for 25 years (last at Miami)
Darryl Rogers (Lions 1985) – college player, college assistant/HC for 24 years (last at Arizona State)
Ron Meyer (Patriots 1982) — Dallas Cowboys scout (1971-2), college assistant/HC for 15 years (last at SMU)
Frank Kush (Colts 1982) – college player, college assistant/HC for 25 years (Arizona State), CFL HC for one year
Bud Wilkinson (Cardinals 1978) – college player, college assistant/HC for 26 years (last with Oklahoma but retired for 15 years)
Lou Holtz (Jets 1976) – college player, college assistant/HC for 16 years (last at NC State)
John McKay (Buccaneers 1976) – college player, college assistant/HC for 26 years (last with USC)
Chuck Fairbanks (Patriots 1973) – college player, college assistant/HC for 18 years (last with Oklahoma)
Bill Peterson (Oilers 1972) – high school coach, college HC for 12 years (last with Rice)
Dan Devine (Packers 1971) – college player, college assistant/HC for 21 years (last with Missouri)
Tommy Prothro (Rams 1971) – college QB, college assistant/HC for 29 years (last at UCLA)

I’ll also note that Lane Kiffin, John Robinson, Greg Schiano, Dick Vermeil, and Tom Coughlin did have some NFL coaching experience before becoming head coaches.

{ 11 comments }

The Packers could not stop the Pistol offense.

The Packers could not stop the Pistol offense.

I have not done a good job fulfilling my pledge to point you in the direction of good football articles. But here’s a great interview by Jerry McDonald of the San Jose Mercury News with former Nevada head coach Chris Ault. Ault is the pioneer of the Pistol Offense, and his prized pupil was last seen rushing for 181 yards against the Packers on Saturday night. The whole article is worth a read, but here are some good excerpts:

Q: How similar was the stuff the 49ers were running to what you ran for Kaepernick at Nevada?

Ault: The read plays that they’re running, that’s what we ran. That’s what we did and what we still do. The play-action passes, which I was really excited to see out of the pistol, are things that we did here in Kaep’s senior year. The routes, I can’t tell you the routes are the same, but I thought that was the one thing I had not seen the Niners do, that I saw the Redskins do, was throw the ball with play-action out of the pistol. I thought the play-action passing really helped with the read itself out of the pistol.
[continue reading…]

{ 5 comments }

It’s Christmas in January. Once the 2012 All-Pro teams were announced (my thoughts here), my buddies Mike Kania and Neil Paine worked through the weekend to provide us with Approximate Values for every player in the NFL this year. For the uninitiated, you can review how AV is calculated here. And if you’re so inclined, give a thanks to Neil or Mike or PFR on twitter.

Here’s a list of the top 100 players. AV is also listed for each player on each team’s roster page on PFR (for Dallas, it’s Tony Romo). You can use the PFR player finder for all sorts of AV-related fun, too. For example, you could see the player with the most AV on your favorite team (for the Jets, it’s Antonio Cromartie), or by position (among inside linebackers, it’s Patrick Willis), or by age (among those 35 or older, it’s Tom Brady, or Tony Gonzalez for non-quarterbacks), or by draft status (Wes Welker had the highest AV in 2012 among undrafted players).

Here’s a list of the top 20 players by AV.

RkPlayerAgeTmGAV
1Tom Brady35NWE1618
2Robert Griffin III22WAS1518
3Adrian Peterson27MIN1618
4Matt Ryan27ATL1618
5Aaron Rodgers29GNB1617
6Cam Newton23CAR1616
7Russell Wilson24SEA1616
8Drew Brees33NOR1615
9Marshawn Lynch26SEA1615
10Eli Manning31NYG1615
11Peyton Manning36DEN1615
12Alfred Morris24WAS1615
13Julius Peppers32CHI1615
14J.J. Watt23HOU1615
15Wes Welker31NWE1615
16Andre Johnson31HOU1614
17Calvin Johnson27DET1614
18Doug Martin23TAM1614
19Tony Romo32DAL1614
20Roddy White31ATL1614
{ 12 comments }

Moss makes turkeys out of the Cowboys

Moss was very good when his teams won.

Last weekend, I looked at career rushing stats in wins and losses, and yesterday, I did the same for quarterbacks. Today we will check out the splits for receivers.

I looked at all games, including playoffs, from 1960 to 2011, for all players with at least 4,000 receiving yards over that time period. The table below lists the following information for each player:

– His first year (or 1960, if he played before 1960) and his last year (or 2011, if still active)
– All the franchises he played for (which you can search for in the search box)
– His number of career wins, and his career receptions, receiving yards, yards per reception, and receiving yards per game in wins
– His number of career losses, and his career receptions, receiving yards, yards per reception, and receiving yards per game in losses

You might be surprised to see Andre Johnson at the top of the list, but his career average should decline the longer he plays; that said, 2012 didn’t drop his numbers. On the flip side, Calvin Johnson moves up into the #2 slot; part of that was due to a great season (although Detroit didn’t get many wins) and part of that was due to Randy Moss slipping. Larry Fitzgerald comes up high on the list for the same reason as both Johnsons, although it’s often easy to forget how great Fitzgerald can be thanks to his current situation.

The table is sorted by receiving yards per game in wins:

RkPlayerYearsTeamsPosWinRec_WYd_WYPR_WY/G_WLossRec_LYd_LYPR_LY/G_L
1Andre Johnson2003--2011htxWR52325473914.5891.172394511812.9971.1
2Randy Moss1998--2010min-rai-nwe-otiWR114597996016.6887.493404576314.2662
3Michael Irvin1988--1999dalWR106560913316.3186.262277408614.7565.9
4Larry Fitzgerald2004--2011crdWR59352502114.2685.171383529913.8474.6
5Calvin Johnson2007--2011detWR23113192917.0783.954265415415.6876.9
6Lance Alworth1962--1972sdg-dalFL-WR83360687219.0982.842172309417.9973.7
7Jerry Rice1985--2004sfo-rai-seaWR20710991690915.3981.7118598817313.6769.3
8Art Powell1960--1968nyj-rai-buf-minSE-WR51244416017.0581.645215347716.1777.3
9Jimmy Smith1995--2005jaxWR96512782915.2981.680390510513.0963.8
10Torry Holt1999--2009ram-jaxWR93486741615.2679.789481659613.7174.1
11Charley Hennigan1960--1966otiWR44209350116.7579.640201321315.9980.3
12Steve Smith2001--2011carWR75390589815.1278.684356516214.561.5
13Del Shofner1960--1967ram-nygE41165321319.4778.43186122414.2339.5
14Dwayne Bowe2007--2011kanWR25118194816.5177.949238297912.5260.8
15Don Maynard1960--1973nyj-crdWR-HB79298615020.6477.876305509116.6967
16Terrell Owens1996--2010sfo-phi-dal-buf-cinWR1316551012715.4677.395477655813.7569
17Marvin Harrison1996--2008cltWR125723964913.3577.281444581413.0971.8
18Sterling Sharpe1988--1994gnbWR52292393713.4875.762314442614.171.4
19DeSean Jackson2008--2011phiWR39149293419.6975.22593136414.6754.6
20Wesley Walker1977--1989nyjWR73272548520.1775.171185319517.2745
21Herman Moore1991--2001detWR63314471215.0174.877383493612.8964.1
22Charlie Brown1982--1987was-atlWR42177313417.7174.62171101414.2848.3
23Sonny Randle1960--1968crd-sfo-dalE-WR45178333018.717445155218714.1148.6
24Greg Jennings2006--2011gnbWR61279449316.173.734151224314.8566
25Reggie Wayne2001--2011cltWR122639893813.9973.363306389812.7461.9
26John Jefferson1978--1985sdg-gnb-cleWR54238395316.6173.244131209115.9647.5
27Terry Glenn1996--2007nwe-gnb-dalWR793795686157261246357414.5358.6
28Darnay Scott1994--2002cin-dalWR40171285216.6871.377237334114.143.4
29Buddy Dial1960--1966pit-dalSE-FL35112249422.2771.331110205018.6466.1
30Isaac Bruce1994--2009ram-sfoWR114529811915.3571.2110539784814.5671.3
31Gary Clark1985--1995was-crd-miaWR107484760915.7271.166273407314.9261.7
32Carl Pickens1992--2000cin-otiWR39212274612.9570.484328438313.3652.2
33Homer Jones1964--1970nyg-cleSE-WR3291224024.627047131257319.6454.7
34Marques Colston2006--2011norWR61313426013.6169.832181260814.4181.5
35Cris Carter1987--2002phi-min-miaWR132701918513.169.6101463558412.0655.3
36Al Toon1985--1992nyjWR48251333613.2969.558287355112.3761.2
37Anquan Boldin2003--2011crd-ravWR65332448213.56967405518812.8177.4
38Pete Retzlaff1960--1966phiWR-TE42155288918.6468.842181280715.5166.8
39Chad Ochocinco2001--2011cin-nweWR74350508414.5368.789419604914.4468
40Steve Largent1976--1989seaWR99419679716.2268.7106423672615.963.5
41Raymond Berry1960--1967cltE57263391114.8768.632149197813.2861.8
42Gary Garrison1966--1977sdg-otiWR-SE55192376419.668.463201355717.756.5
43Darrell Jackson2000--2008sea-sfo-denWR61282414714.716863258348813.5255.4
44Mike Quick1982--1990phiWR39142264518.6367.857216366416.9664.3
45James Lofton1978--1993gnb-rai-buf-ram-phiWR109395738718.767.8115402725418.0463.1
46Rob Moore1990--1999nyj-crdWR59269399814.8667.894374557214.959.3
47Fred Barnett1990--1997phi-miaWR59243397716.3767.438136166812.2643.9
48Kellen Winslow1979--1987sdgTE58320390812.2167.455249321312.958.4
49George Sauer1965--1970nyjSE-WR45172301917.5567.130137197714.4365.9
50Joe Horn1996--2007kan-nor-atlWR71319473914.8666.777285405514.2352.7
51Otis Taylor1965--1974kanWR-FL75265498518.8166.541146232315.9156.7
52Mark Duper1983--1992miaWR88324583918.0266.455219362516.5565.9
53Bob Hayes1965--1975dal-sfoSE-WR87268567921.1965.341126212816.8951.9
54Steve Watson1979--1987denWR63223411218.4465.339147231415.7459.3
55Roddy White2005--2011atlWR62296403213.626553256353513.8166.7
56Rod Smith1995--2006denWR121575786513.686564323438413.5768.5
57Flipper Anderson1988--1995ram-cltWR3499220422.2664.858175332318.9957.3
58Eddie Brown1985--1991cinWR53175343119.6164.751197280214.2254.9
59Wes Welker2004--2011sdg-mia-nweWR86509555410.9164.645194211010.8846.9
60Derrick Alexander1994--2002cle-rav-kan-minWR48167309218.5164.469251390915.5756.7
61Andre Reed1985--2000buf-wasWR134599862114.3964.3106437580613.2954.8
62Antonio Gates2003--2011sdgTE80375512413.6664.153257310812.0958.6
63Wes Chandler1978--1988nor-sdg-sfoWR61234389416.6463.884348541915.5764.5
64Anthony Miller1988--1997sdg-den-dalWR71272451216.5963.582332477314.3858.2
65Al Denson1964--1971den-minWR-TE2589158117.7663.24916326081653.2
66Antonio Freeman1995--2003gnb-phiWR95375597815.9462.941155209613.5251.1
67Lee Evans2004--2011buf-ravWR51174320318.4162.867211287413.6242.9
68Plaxico Burress2000--2011pit-nyg-nyjWR95385592315.3862.357202296914.752.1
69Santana Moss2001--2011nyj-wasWR74285460616.1662.288387496312.8256.4
70Brandon Marshall2006--2011den-miaWR43214267612.562.248280357112.7574.4
71Keyshawn Johnson1996--2006nyj-tam-dal-carWR92447569112.7361.982406544913.4266.5
72Joey Galloway1995--2010sea-dal-tam-nwe-wasWR85321520516.2161.2107393590415.0255.2
73Muhsin Muhammad1996--2009car-chiWR105477640713.436196413558913.5358.2
74Henry Ellard1983--1998ram-was-nweWR99343604017.6161125492807916.4264.6
75Tommy McDonald1960--1968phi-dal-ram-atl-cleWR-HB49166297917.9560.861222349315.7357.3
76Anthony Carter1985--1995min-detWR80293485316.5660.762233353515.1757
77Art Monk1980--1995was-nyj-phiWR142631860913.6460.695378517413.6954.5
78Red Phillips1960--1967ram-minE2494145515.4860.653214314714.7159.4
79Roger Carr1974--1983clt-sea-sdgWR40110242522.0560.660163268116.4544.7
80Paul Flatley1963--1970min-atlWR-FL34117206117.6260.655179274215.3249.9
81David Boston1999--2005crd-sdg-miaWR27109162614.9260.247206307314.9265.4
82Ernest Givins1986--1995oti-jaxWR75320451614.1160.280311447314.3855.9
83Dwight Clark1979--1987sfoWR81343487214.260.146216264812.2657.6
84Santonio Holmes2006--2011pit-nyjWR57211342516.2360.138152221214.5558.2
85Paul Warfield1964--1977cle-miaWR-SE115340689220.2759.947132249718.9253.1
86Laveranues Coles2000--2009nyj-was-cinWR71323425313.1759.981378463812.2757.3
87Jimmy Orr1960--1970pit-cltWR73219437219.9659.938119211917.8155.8
88Elbert Dubenion1960--1967bufWR-HB53159317219.9559.842127207516.3449.4
89Ken Burrough1970--1981nor-otiWR67222397717.9159.480204323015.8340.4
90Stephone Paige1983--1991kanWR57180336118.675963203308915.2249
91Todd Christensen1980--1988raiTE-FB66306388812.7158.941186234212.5957.1
92Louis Lipps1984--1992pit-norWR48169282716.7358.963204337616.5553.6
93Jeff Graham1991--2001pit-chi-nyj-phi-sdgWR57222334515.0758.785335506415.1259.6
94Harold Jackson1969--1983phi-ram-nwe-min-seaWR-FL100296586419.8158.684292483516.5657.6
95Tim Brown1988--2004rai-tamWR135562790714.0758.6127577760813.1959.9
96Tony Martin1990--2001mia-sdg-atlWR103369603116.3458.676267373213.9849.1
97John Stallworth1974--1987pitWR103361602316.6858.558230368716.0363.6
98Eric Martin1985--1994nor-kanWR85315496915.7758.568253339613.4249.9
99Stanley Morgan1977--1990nwe-cltWR99298578719.4258.586278525018.8861
100Alfred Jenkins1975--1983atlWR50170290317.0858.160196357118.2259.5
101Jason Witten2003--2011dalTE77381445711.757.967343374510.9255.9
102Kellen Winslow Jr.2004--2011cle-tamTE34153196712.8657.958284286910.149.5
103Braylon Edwards2005--2011cle-nyj-sfoWR48172275916.0457.557184288415.6750.6
104Cris Collinsworth1981--1988cinWR60216344615.9557.448222360616.2475.1
105Gene A. Washington1969--1979sfo-detWR-SE60178344519.3557.469210353516.8351.2
106John Gilliam1967--1977nor-crd-min-atlWR-FL69206394719.1657.270176301717.1443.1
107Chris Burford1960--1967kanSE-WR52205297114.4957.138157229214.660.3
108Max McGee1960--1967gnbE57177324418.3356.91956106719.0556.2
109Charlie Joiner1969--1986oti-cin-sdgWR114404647616.0356.8114375613216.3553.8
110Tony Hill1977--1986dalWR97335550816.4456.846190309816.3167.3
111Bernie Casey1961--1968sfo-ramFB-WR45162254715.7256.644160233114.5753
112Charley Taylor1964--1977wasWR-RB87341491814.4256.570297407113.7158.2
113Javon Walker2002--2009gnb-den-raiWR45157253716.1656.438123176014.3146.3
114Jerry Butler1979--1986bufWR38139213915.3956.347146228515.6548.6
115Carlos Carson1980--1989kan-phiWR50147280919.1156.263203344416.9754.7
116Webster Slaughter1986--1998cle-oti-kan-nyj-sdgWR76276426515.4556.184314424313.5150.5
117Hines Ward1998--2011pitWR145684812911.8856.183393499612.7160.2
118Gail Cogdill1960--1970det-atlSE-WR54172302317.585653164243114.8245.9
119Johnny Morris1960--1967chiFL-HB51189284715.0655.837141179412.7248.5
120Chris Chambers2001--2010mia-sdg-kanWR74273412715.1255.876291392813.551.7
121Cliff Branch1972--1984raiWR129401718417.9255.749170273916.1155.9
122Andre Rison1989--2000clt-atl-cle-jax-gnb-kan-raiWR92361512014.1855.792411550013.3859.8
123Reggie Rucker1970--1981dal-nyg-nwe-cleWR70235389016.5555.679215323415.0440.9
124Eddie Kennison1996--2007ram-nor-chi-den-kanWR75245416316.9955.5102306423213.8341.5
125Antonio Bryant2002--2009dal-cle-sfo-tamWR40148221714.9855.464225347215.4354.3
126Donald Driver1999--2011gnbWR115471636813.5255.476313436713.9557.5
127Marty Booker1999--2009chi-mia-atlWR57242315313.0355.385299356811.9342
128Yancey Thigpen1992--2000pit-otiWR67227370116.355.233121180014.8854.5
129Tony Gonzalez1997--2011kan-atlTE122562672311.9655.1116603677211.2358.4
130Vance Johnson1985--1995denWR70269385614.3355.151183252013.7749.4
131Curtis Conway1993--2004chi-sdg-nyj-sfoWR61232335914.4855.197369495213.4251.1
132Roy Jefferson1965--1976pit-clt-wasWR-SE78251426516.9954.772217349416.148.5
133Fred Biletnikoff1965--1978raiWR-FL136475742415.6354.646148213714.4446.5
134Lionel Taylor1960--1968den-otiWR31136169112.4354.571405515312.7272.6
135Vincent Jackson2005--2011sdgWR63194342917.6854.433107182817.0855.4
136Jim Colclough1960--1968nweE49148266618.0154.445112187416.7341.6
137Carroll Dale1960--1973ram-gnb-minWR-TE91245494920.254.473211366017.3550.1
138Dave Parks1964--1973sfo-nor-otiWR-TE31107168115.7154.267215342415.9351.1
139Shannon Sharpe1990--2003den-ravTE131534710013.354.26934337741154.7
140Ben Hawkins1966--1973phiWR2875151720.2354.257171294517.2251.7
141Eric Moulds1996--2007buf-htx-otiWR89344480313.9654100435551212.6755.1
142Isaac Curtis1973--1984cinWR79226426318.865475203302214.8940.3
143Brian Blades1988--1998seaWR66268355613.2753.978318414213.0353.1
144Lynn Swann1974--1982pitWR94302505416.7453.83280130016.2540.6
145Deion Branch2002--2011nwe-seaWR94367504813.7553.751197238312.146.7
146Sammy White1976--1985minWR68211364617.2853.661188289315.3947.4
147Kevin House1980--1987tam-ramWR3089160818.0753.670218369316.9452.8
148Haywood Jeffires1987--1996oti-norWR65272348312.8153.668304336411.0749.5
149Roy Green1979--1992crd-phiWR76239406617.0153.5104318482615.1846.4
150Ahmad Rashad1972--1982crd-buf-minWR71271376913.9153.167236329513.9649.2
151Amani Toomer1996--2008nygWR110403583114.475389307423213.7947.6
152Bobby Mitchell1960--1968cle-wasWR-HB52175275015.7152.962263419215.9467.6
153Bill Brooks1986--1996clt-buf-wasWR74278391014.0652.885332440313.2651.8
154Harold Carmichael1971--1984phi-dalWR-TE82279430615.4352.599333500115.0250.5
155Drew Pearson1973--1983dalWR121391635016.2452.550165257715.6251.5
156Lance Rentzel1965--1974min-dal-ramWR-FL66180345819.2152.44294154416.4336.8
157Irving Fryar1984--2000nwe-mia-phi-wasWR119398623015.6552.4135477684514.3550.7
158Bert Emanuel1994--2001atl-tam-mia-nwe-detWR44158230014.5652.352202268313.2851.6
159Keenan McCardell1992--2007cle-jax-tam-sdg-wasWR123495642812.9952.387443556712.5764
160Aaron Thomas1961--1970sfo-nygTE-SE3587182821.0152.255170266515.6848.5
161Mark Clayton1983--1993mia-gnbWR102336530315.785265278417815.0364.3
162Jake Reed1992--2002min-norWR72251374214.915262225366616.2959.1
163Roy E. Williams2004--2011det-dal-chiWR46161238814.8351.966237338614.2951.3
164Henry Marshall1976--1987kanWR58188298215.8651.484234363515.5343.3
165John Taylor1987--1995sfoWR94302482515.9851.33591150716.5643.1
166Ricky Sanders1986--1995was-atlWR80286410514.3551.357228288912.6750.7
167Alvin Harper1991--1997dal-tam-wasWR56139287120.6551.32976125716.5443.3
168Frank Clarke1960--1967dalE37112188716.855151149295919.8658
169Marcus Robinson1998--2006chi-rav-minWR47160239414.9650.955172244114.1944.4
170T.J. Houshmandzadeh2001--2011cin-sea-rav-raiWR57253289311.4350.881370428611.5852.9
171Drew Hill1979--1993ram-oti-atlWR103334522015.6350.7105339515215.249.1
172Michael Jackson1991--1998cle-ravWR39127196915.550.562234355615.257.4
173Willie Davis1992--1998kan-otiWR61183307316.7950.444119166914.0337.9
174Boyd Dowler1960--1971gnb-wasFL-SE102324511215.7850.140119160013.4540
175Derrick Mason1997--2011oti-rav-nyj-htxWR141542705313.015097450560912.4657.8
176Johnnie Morton1994--2005det-kan-sfoWR75267374614.0349.997368509213.8452.5
177Mark Carrier1987--1998tam-cle-carWR64212318815.0449.8102366566815.4955.6
178Danny Abramowicz1967--1974nor-sfoE3097149415.449.874255388415.2352.5
179Wayne Chrebet1995--2005nyjWR69263343513.0649.881336419912.551.8
180Dave Kocourek1960--1968sdg-mia-raiTE-FL55157272717.3749.63798150915.440.8
181Ed McCaffrey1991--2003nyg-sfo-denWR106380521213.7249.258227276412.1847.7
182Michael Westbrook1995--2002was-cinWR39135191414.1849.142144236116.456.2
183Lionel Manuel1984--1990nygWR50143244417.0948.933103174016.8952.7
184Gary Collins1962--1971cleWR80240387716.1548.54295149715.7635.6
185Robert Brooks1992--2000gnb-denWR67226324414.3548.436128168313.1546.8
186Frank Sanders1995--2003crd-ravWR48178232313.0548.480336452813.4856.6
187Jerry Porter2000--2008rai-jaxWR38116183915.8548.462197257313.0641.5
188Mel Gray1971--1982crdWR65167311318.6447.978188354518.8645.4
189Tim McGee1986--1994cin-wasWR53145252617.4247.769183273714.9639.7
190Frank Lewis1971--1983pit-bufWR86229409817.947.758190311416.3953.7
191Bernard Berrian2004--2011chi-minWR58178276115.5147.652143182712.7835.1
192Sean Dawkins1993--2001clt-nor-sea-jaxWR54173256614.8347.578290396013.6650.8
193Willie Gault1983--1993chi-raiWR98227465320.547.558127247919.5242.7
194Dallas Clark2003--2011cltTE88358417511.6647.436133155911.7243.3
195Jessie Hester1985--1995rai-atl-clt-ramWR49133231817.4347.373241354814.7248.6
196Michael Haynes1988--1997atl-norWR52155245915.8647.381280428815.3152.9
197Haven Moses1968--1981buf-denWR-SE82199385619.384790253442517.4949.2
198Jackie Smith1963--1978crd-dalTE84226395017.484777235369615.7348
199Mark Jackson1986--1994den-nyg-cltWR74205347216.9446.953159249115.6747
200Terance Mathis1990--2002nyj-atl-pitWR86299400213.3846.5114419520612.4245.7
201Bob Chandler1971--1981buf-raiWR48145223315.446.567229305813.3545.6
202Milt Morin1966--1975cleTE56165259915.7546.446117171014.6237.2
203Reggie Langhorne1985--1993cle-cltWR63205292314.2646.459229287412.5548.7
204Pat Tilley1976--1986crdWR61189283014.9746.474280418614.9556.6
205John Mackey1963--1972clt-sdgTE89253412816.3246.43377113314.7134.3
206Michael Timpson1989--1997nwe-chi-phiWR41137190013.8746.361164215413.1335.3
207Bill Schroeder1997--2004gnb-det-tamWR50150231115.4146.247159234214.7349.8
208Chris Cooley2004--2011wasTE48187221111.8246.160252263510.4643.9
209Brett Perriman1988--1997nor-det-kan-miaWR74258339013.1445.872294352211.9848.9
210Dave Casper1974--1984rai-oti-minTE70230320213.9245.744175237713.5854
211Dave Logan1976--1984cle-denWR47133214716.1445.747133216616.2946.1
212Bobby Joe Conrad1960--1969crd-dalWR-HB62191283014.8245.655192256313.3546.6
213Koren Robinson2001--2008sea-min-gnbWR51159232514.6245.646150206313.7544.8
214Bobby Engram1996--2009chi-sea-kanWR80301364112.145.5101384458611.9445.4
215Gary Ballman1962--1973pit-phi-nyg-minWR-TE3589156517.5844.768212345116.2850.8
216Nat Moore1974--1986miaWR-RB119363531514.6444.755163231214.1842
217Duriel Harris1976--1985mia-cle-dalWR68185303716.4244.744133228417.1751.9
218Jack Snow1965--1975ramWR-SE85214377317.6344.442115197817.247.1
219Freddie Scott1974--1983clt-detWR3695159216.7644.258173276615.9947.7
220Ray Butler1980--1988clt-seaWR3490150316.744.264152254316.7339.7
221Devery Henderson2005--2011norWR64150282818.8544.247104169716.3236.1
222J.J. Stokes1995--2003sfo-jax-nweWR66238291312.2444.149141181212.8537
223Charlie Sanders1968--1977detTE60174264315.1944.150151199513.2139.9
224Kevin Johnson1999--2005cle-jax-rav-detWR38133167212.574463255306312.0148.6
225Donte Stallworth2002--2011nor-phi-nwe-cle-rav-wasWR61164265616.243.555170237213.9543.1
226Freddie Solomon1975--1985mia-sfoWR83214359516.843.363191278814.644.3
227Ben Coates1991--2000nwe-ravTE70276301910.9443.170249279411.2239.9
228Vernon Davis2006--2011sfoTE42150181112.0743.145164228413.9350.8
229Rocket Ismail1993--2001rai-car-dalWR61168261715.5842.965204286514.0444.1
230Qadry Ismail1993--2002min-mia-nor-rav-cltWR83228354415.5442.758143188013.1532.4
231O.J. McDuffie1993--2000miaWR71248300512.1242.352217267212.3151.4
232Mark Bavaro1985--1994nyg-cle-phiTE77239325413.6242.340142184512.9946.1
233James Jett1993--2001raiWR55127232218.2842.253142226915.9842.8
234Brent Jones1987--1997sfoTE113366476913.0342.233111116610.535.3
235Jeremy Shockey2002--2011nyg-nor-carTE82309345011.1742.161260291811.2247.8
236Chris Calloway1990--2000pit-nyg-atl-nweWR64170269115.834272223289112.9640.2
237David Patten1997--2008nyg-cle-nwe-was-norWR77200323616.184263144173912.0827.6
238J.T. Smith1978--1990was-kan-crdWR64211267112.6641.791323417212.9245.8
239Brandon Stokley1999--2011rav-clt-den-sea-nygWR80226329514.5841.249156200512.8540.9
240Calvin Williams1990--1996phi-ravWR58184238112.9441.141141174412.3742.5
241Nate Burleson2003--2011min-sea-detWR64210262612.54160204257612.6342.9
242Ron Jessie1971--1981det-ram-bufWR74181303116.75414396143114.9133.3
243Keith Jackson1988--1996phi-mia-gnbTE87288356012.3640.947204255712.5354.4
244Jeff Chadwick1983--1992det-sea-ramWR44103179917.4740.962191275014.444.4
245Curtis Duncan1987--1993otiWR58210236811.2840.842146184112.6143.8
246Mike Sherrard1986--1996dal-sfo-nyg-denWR62162252815.640.832104147614.1946.1
247Shawn Jefferson1991--2003sdg-nwe-atl-detWR96253391415.4740.888244339013.8938.5
248Marshall Faulk1994--2005clt-ramRB9942240229.5340.68939733728.4937.9
249Jabar Gaffney2002--2011htx-nwe-den-wasWR66199268113.4740.682269322311.9839.3
250Willie Green1991--1998det-tam-car-denWR55147223315.1940.635117184415.7652.7
251Todd Heap2001--2011rav-crdTE83273336912.3440.663250279111.1644.3
252Mike Ditka1961--1972chi-phi-dalTE80239324013.5640.554184241613.1344.7
253Torrance Small1992--2001nor-ram-clt-phi-nweWR51141205314.5640.371213262412.3237
254Peerless Price1999--2007buf-atl-dalWR54159215813.574067254324412.7748.4
255Mike Renfro1978--1987oti-dalWR53140211715.1239.960190275914.5246
256Quinn Early1988--1999sdg-nor-buf-nyjWR73203291414.3539.976278379013.6349.9
257Chris Burkett1985--1993buf-nyjWR41110163514.8639.966185277214.9842
258Ike Hilliard1997--2008nyg-tamWR79258314812.239.885312353411.3341.6
259Drew Bennett2001--2008oti-ramWR44116175215.139.853205286813.9954.1
260Jerricho Cotchery2004--2011nyj-pitWR62206246111.9539.758199276113.8747.6
261Mike Pritchard1991--1999atl-den-seaWR58172229713.3539.667263304311.5745.4
262Nate Washington2005--2011pit-otiWR55139217515.6539.545137189213.8142
263Riley Odoms1972--1983denTE83220327914.939.561176237913.5239
264Sam McCullum1974--1983min-seaWR51131200315.2939.363150212814.1933.8
265Jay Novacek1985--1995crd-dalTE84298328111.0139.152186199410.7238.3
266Ozzie Newsome1978--1990cleTE102324397712.273998365437611.9944.7
267Bob Trumpy1968--1977cinTE-WR60147233115.8638.958147210314.3136.3
268Raymond Chester1970--1981rai-cltTE80199309915.5738.763172214612.4834.1
269Travis Taylor2000--2007rav-min-rai-ramWR52153201313.1638.750172216212.5743.2
270Joe Jurevicius1998--2007nyg-tam-sea-cleWR68195262913.4838.751145183212.6335.9
271Wesley Walls1989--2003sfo-nor-car-gnbTE68206260412.6438.381253276610.9334.1
272Ricky Proehl1990--2006crd-sea-chi-ram-car-cltWR112299427914.3138.2117393496212.6342.4
273Bob Tucker1970--1980nyg-minTE56161212913.223882255318712.538.9
274Steve Jordan1982--1994minTE86255326912.823881269338112.5741.7
275Leonard Thompson1975--1986detWR-HB52116197617.033880169286816.9735.9
276Charles Johnson1994--2002pit-phi-nwe-bufWR69204261612.8237.949173228313.246.6
277Jerry Smith1965--1977wasTE-WR75206284113.7937.960190234412.3439.1
278Rich Caster1970--1981nyj-oti-nor-wasTE-WR58123219717.8637.976207338516.3544.5
279Michael Jenkins2004--2011atl-minWR52144195413.5737.654184216811.7840.1
280Alge Crumpler2001--2010atl-oti-nweTE73196274013.9837.568191216811.3531.9
281Paul Coffman1979--1987gnb-kanTE49145183812.6837.562196248912.740.1
282Courtney Hawkins1992--2000tam-pitWR55170205912.1137.470204257212.6136.7
283Russ Francis1975--1988nwe-sfoTE96277358712.9537.455151214914.2339.1
284Billy Cannon1960--1970oti-rai-kanTE-RB80174298617.1637.3318194511.6730.5
285Jimmie Giles1977--1989oti-tam-det-phiTE50122186115.2537.288232330614.2537.6
286Brian Brennan1984--1992cle-cin-sdgWR61172226713.1837.262184237812.9238.4
287Eric Green1990--1999pit-mia-rav-nyjTE55167201712.0836.757200248812.4443.6
288Troy Brown1993--2007nweWR120392439211.236.681223266811.9632.9
289Gino Cappelletti1960--1970nweFL-SE63132230517.4636.670139203714.6529.1
290Justin McCareins2001--2008oti-nyjWR61145223015.3836.653118180615.3134.1
291Rick Upchurch1975--1983denWR67151243916.1536.453117193916.5736.6
292Frank Wycheck1993--2003was-otiTE86299312910.4636.46724323109.5134.5
293Heath Miller2005--2011pitTE80239286311.9835.839138149810.8638.4
294Floyd Turner1989--1998nor-clt-ravWR46129163812.735.654167238214.2644.1
295Mark Ingram1987--1996nyg-mia-gnb-phiWR65153230115.0435.447128181514.1838.6
296Ken Dilger1995--2004clt-tamTE69192243912.735.375180181910.1124.3
297Rodney Holman1982--1995cin-detTE81210281613.4134.879173220012.7227.8
298Dennis Northcutt2000--2009cle-jax-detWR49132170212.8934.797278339012.1934.9
299Pete Holohan1981--1992sdg-ram-kan-cleTE62190214911.3134.763189199510.5631.7
300Mickey Shuler1978--1991nyj-phiTE68222235210.5934.671248284511.4740.1
301Jerome Barkum1972--1983nyjTE-WR54129185514.3834.472201299014.8841.5
302Az-Zahir Hakim1998--2006ram-det-norWR57145191713.2233.655192255813.3246.5
303Brian Westbrook2002--2010phi-sfoRB8026926589.8833.24920316057.9132.8
304Larry Centers1990--2003crd-was-buf-nweFB8434127828.1633.111950741778.2435.1
305John L. Williams1986--1995sea-pitFB8129026779.23337528722227.7429.6
306Brandon Lloyd2003--2011sfo-was-chi-den-ramWR3281104912.9532.873230373516.2451.2
307Billy Johnson1974--1988oti-atl-wasWR65159211013.2732.571176207711.829.3
308Randy McMichael2002--2011mia-ram-sdgTE53160168610.5431.888257280210.931.8
309Roger Craig1983--1993sfo-rai-minRB12743140059.2931.55319515007.6928.3
310Ricky Watters1992--2001sfo-phi-seaRB9128928519.8731.36321518158.4428.8
311Ronnie Harmon1986--1997buf-sdg-oti-chiRB-WR94283293410.3731.289350361210.3240.6
312Tiki Barber1997--2006nygRB8026724979.3531.28033828178.3335.2
313Eric Metcalf1989--2002cle-atl-sdg-crd-car-was-gnbRB-WR83238256410.7730.9102317318510.0531.2
314Jim R. Mitchell1969--1979atlTE57139175912.6530.966160237514.8436
315Keith Byars1986--1998phi-mia-nwe-nyjFB-TE11939036659.430.87927224398.9730.9
316Freddie Jones1997--2004sdg-crdTE37109113110.3830.679295310110.5139.3
317Tony Nathan1979--1987miaRB8929027059.3330.44515815369.7234.1
318Tony McGee1993--2002cin-dalTE3992117812.830.289230291112.6632.7
319Jackie Harris1990--2001gnb-tam-oti-dalTE63157188111.9829.979251265010.5633.5
320Joe Morrison1960--1972nygRB-WR66147195813.3229.779224274712.2634.8
321Charle Young1973--1985phi-ram-sfo-seaTE76190225311.8629.671241300212.4642.3
322David Hill1976--1987det-ramTE71182209111.4929.576187221111.8229.1
323Billy Joe DuPree1973--1983dalTE101213293313.77294293107911.625.7
324Antwaan Randle El2002--2010pit-wasWR88184247313.4428.166220240210.9236.4
325Kelvin Martin1987--1996dal-sea-phiWR68138183913.332774238302312.740.9
326Thurman Thomas1988--2000buf-miaRB13034634119.8626.27120217198.5124.2
327Marcus Pollard1996--2008clt-det-sea-atlTE81183211311.5526.181185240212.9829.7
328LaDainian Tomlinson2001--2011sdg-nyjRB10434126837.8725.87630822657.3529.8
329Walter Payton1975--1987chiRB11327826459.5123.48623620718.7824.1
330Herschel Walker1986--1997dal-min-phi-nygRB8421119579.2723.310631129629.5227.9
331Kevin Faulk1999--2011nweRB12532828858.823.15415412287.9722.7
332Marcus Allen1982--1997rai-kanRB14534131869.34229129927559.2130.3
333Warrick Dunn1997--2008tam-atlRB9824421418.7721.89230124548.1526.7
334Earnest Byner1984--1997cle-was-ravRB11127123998.8521.610227825849.2925.3
335Tony Galbreath1976--1987nor-min-nygRB7917514708.418.69032626678.1829.6

[continue reading…]

{ 2 comments }

Is this a thinly-veiled Brady/Manning post?

Is this a thinly-veiled Brady/Manning post?

Last weekend, I looked at career rushing stats in wins and losses; today I will do the same but for quarterbacks.

I looked at all games, including playoffs, from 1960 to 2011, for all quarterbacks with at least 5,000 career passing yards over that time period. The table below lists the following information for each passer:

– His first year (or 1960, if he played before 1960) and his last year (or 2011, if still active)
– All the franchises he played for (which you can search for in the search box)
– His number of career wins, and his touchdown rate, interception rate, yards per attempt and Adjusted Yards per Attempt (which includes a 20-yard bonus for touchdown passes and a 45-yard penalty for interceptions) in wins [1]Unfortunately, I excluded sack data from this study due to its general unavailability for most of the covered time period.
– His number of career losses, and his touchdown rate, interception rate, yards per attempt and Adjusted Yards per Attempt in losses

The table is sorted by AY/A in wins; unsurprisingly, Aaron Rodgers — who is the career leader in that metric — tops this table, too. In fact, Rodgers is also the leader in AY/A in losses. Note that this table includes all games played by the quarterback, not just his starts.

RkPlayerYearsTeamsPYDWinTD%_WINT%_WY/A_WAY/A_WLossTD%_LINT%_LY/A_LAY/A_L
1Aaron Rodgers2005--2011gnb19147497.6%1.3%8.78.3274.3%2.5%7.46.4
2Matt Schaub2004--2011atl-htx17936485.3%1.7%8.78.1533.5%3.3%7.25.8
3Tony Romo2005--2011dal21666606.6%2.1%8.77.9434.3%3.4%75.5
4Kurt Warner1998--2009ram-nyg-crd36296816.8%2.2%8.77.8573.3%4.4%7.25.3
5Daunte Culpepper1999--2009min-mia-rai-det25133457.1%2.2%8.77.8643.3%4%6.95.1
6Bob Berry1965--1975min-atl9197327.4%2.3%8.67.7364.2%7.4%7.13.8
7Steve Young1985--1999tam-sfo364501256.8%1.7%8.37.6602.9%4.2%7.25.3
8Philip Rivers2004--2011sdg26105696.2%2.3%8.57.6394%3.1%7.36
9Ben Roethlisberger2004--2011pit29729905.7%2.2%8.47.6383.7%4.9%7.25
10John Friesz1990--2000sdg-was-sea-nwe8699195%1%7.87.5382.6%4%5.84
11Bart Starr1960--1971gnb22810996.6%2.9%8.67.5412.4%5.9%6.74.1
12Don Meredith1960--1968dal17750518.5%3.3%8.87.5503.5%6%6.23.6
13Drew Brees2001--2011sdg-nor43722976.5%1.7%87.4663.4%3.7%6.75.1
14Ken O'Brien1984--1993nyj-phi25598565.8%1.7%87.4722.1%3.6%6.34.7
15J.P. Losman2004--2011buf-rai-mia6271175.8%1.5%7.97.4282.5%4.4%6.14.1
16Trent Green1997--2008was-ram-kan-mia28794595.3%2.1%8.27.3633.6%3.8%7.15.5
17Rob Johnson1995--2003jax-buf-tam-was-rai5947204.8%1.5%7.97.3252.8%3.6%6.75.1
18Chad Pennington2000--2010nyj-mia19241465.1%1.2%7.77.3493.2%4.1%6.64.9
19Boomer Esiason1984--1997cin-nyj-crd38520896.6%2.4%8.27.31033.3%4.4%6.54.6
20Neil Lomax1981--1988crd23156486.4%2.1%8.17.3593%3.3%6.65.2
21David Garrard2002--2010jax16489455.3%1.4%7.87.3442.7%3.4%6.44.9
22Matthew Stafford2009--2011det8220138.1%1.8%7.97.2173.4%4.4%6.34.4
23Joe Montana1979--1994sfo-kan463231406.4%2.2%8.17.2602.7%3.4%6.34.9
24Eddie LeBaron1960--1963dal53311112.5%5.5%9.47.2314.7%8.7%7.13.3
25Peyton Manning1998--2010clt602171506.3%1.9%87.2773.9%4.1%6.95.2
26Ed Brown1960--1965chi-pit-clt7723357.7%5.8%9.77.2332.9%8.8%6.52.6
27Wade Wilson1981--1998min-atl-nor-dal-rai18605666.1%2.6%8.37.2632.4%5.3%6.23.9
28Jay Cutler2006--2011den-chi18637426.6%2.2%8.17.2382.7%4.6%6.54.5
29Josh Freeman2009--2011tam8898175.6%1.8%7.97.2242.8%4.6%6.14.1
30Tom Brady2000--2011nwe452641406.1%1.6%7.87.2433.6%4.2%6.34.5
31Matt Moore2007--2011car-mia5137176.2%1.8%7.87.1192.8%5%6.24
32Chris Chandler1988--2004clt-tam-crd-ram-oti-atl-chi29212725.9%2.6%8.27.11053.1%4.4%6.44.4
33Len Dawson1960--1975cle-kan301121058.7%3.6%8.67.1643.2%6.3%6.63.8
34Joe Flacco2008--2011rav15348494.6%1.2%7.67.1243%4.4%5.94
35Trent Edwards2007--2010buf-jax6019144%1.6%7.77.1222%4.3%5.73.8
36Jeff Garcia1999--2009sfo-cle-det-phi-tam26894635.4%1.3%7.57.1683.4%3.1%6.45.1
37Ken Anderson1971--1986cin341591006.2%2.4%87.1922.7%4.7%6.74.7
38Rudy Bukich1960--1968pit-chi7865307.5%3.5%8.57353.5%8.6%62.3
39Troy Aikman1989--2000dal367911054.8%2.1%7.97762.1%4.1%64.2
40Damon Huard1998--2008mia-nwe-kan6349204.9%1.1%7.47242%4.3%5.84
41Jim Everett1986--1997ram-nor-sdg35957665.7%2.6%8.17973.2%4.2%6.54.6
42Roger Staubach1969--1979dal254911066.1%2.5%87443.5%6.3%6.73.9
43Bert Jones1973--1982clt-ram18589476.4%3.1%8.27583.6%4.6%6.34.3
44Frank Reich1985--1998buf-car-nyj-det6858398.8%2.1%7.77393.3%4.3%6.34.4
45Jeff Hostetler1986--1997nyg-rai-was17464705.5%1.9%7.77402.3%4.1%6.34.5
46Dan Fouts1973--1987sdg45165915.9%3.2%8.36.9953.1%5.5%7.14.7
47Bill Kenney1980--1988kan17374375.9%2.5%86.9493.2%4.2%6.54.6
48Y.A. Tittle1960--1964sfo-nyg11542408.9%4.3%8.76.9232.5%6.9%5.72.7
49Mark Brunell1994--2011gnb-jax-was-nor-nyj33905994.8%1.8%7.66.9913.2%2.9%6.24.9
50Aaron Brooks2000--2006nor-rai20822415.8%1.6%7.56.9543.3%4.1%6.44.7
51Patrick Ramsey2002--2008was-nyj-den5929165.2%2.3%7.86.9243.1%3.8%5.84.2
52Scott Mitchell1992--2001mia-det-rav-cin15925406%2.1%7.76.9452.6%4.6%5.93.9
53Randy Wright1984--1988gnb7106125.4%3.4%8.36.9332.2%5.5%5.93.5
54Rich Gannon1987--2004min-was-kan-rai30434915.5%1.5%7.46.9713%3.6%6.24.6
55Earl Morrall1960--1976det-nyg-clt-mia17529927.9%4.8%8.96.9444.2%6.9%6.63.6
56Sonny Jurgensen1960--1974phi-was31546747.7%3.9%8.46.9794.5%4.9%6.84.7
57Steve DeBerg1978--1998sfo-den-tam-kan-mia-atl34752725.4%2.3%7.86.91143.2%4.9%6.44.2
58Steve Beuerlein1988--2003rai-dal-crd-jax-car-den24317645.6%2.3%7.86.8663.4%4.2%6.85
59Fran Tarkenton1961--1978min-nyg488061316.8%2.8%86.81173.6%5.5%6.54.1
60John Brodie1960--1973sfo30783786.7%3.3%8.26.8793.3%6%6.13.5
61Doug Flutie1986--2005chi-nwe-buf-sdg15209485.2%2.4%7.86.8452.9%3.9%64.3
62Johnny Unitas1960--1973clt-sdg323351076.3%3.8%8.46.8592.7%7.3%6.53.2
63Joe Namath1965--1977nyj-ram28299686.4%4%8.56.8713.3%6.8%6.53.5
64Matt Ryan2008--2011atl14832436.1%1.9%7.56.8222.4%3%6.14.8
65Craig Erickson1992--1997tam-clt-mia7625184.8%2.7%7.96.8343.2%3.9%6.54.8
66Marc Bulger2002--2009ram23758424.9%2.6%7.86.8573.1%3.3%6.85.4
67Matt Cassel2005--2011nwe-kan11769425.1%2%7.66.8303.5%3.3%5.74.3
68Tom Flores1960--1969rai-buf-kan11960408.3%3.8%8.36.8442.8%6.7%5.72.8
69Phil Simms1979--1993nyg351411025.3%2.5%7.76.7723%4.3%6.44.6
70Derek Anderson2006--2011cle-crd-car9148215.5%2.4%7.76.7322.7%4.6%5.73.6
71Michael Vick2001--2011atl-phi18889655.8%2.4%7.76.7512.8%3.4%6.34.9
72Brett Favre1991--2010atl-gnb-nyj-min776932016.3%2.2%7.66.71253.2%4.9%6.44.3
73Craig Morton1965--1982dal-nyg-den291431186.7%3.7%8.26.7822.6%6.5%6.23.4
74Steve Pelluer1985--1990dal-kan6870173.3%2.2%7.66.7262.9%4.7%6.94.8
75Dan Marino1983--1999mia658711555.7%2.4%7.76.71054.1%3.9%6.85.1
76Donovan McNabb1999--2011phi-was-min408591065.4%2%7.46.7742.9%2.6%6.15
77Dave Krieg1980--1998sea-kan-det-crd-chi-oti400421136.7%3%7.96.7983%4.4%6.54.5
78Warren Moon1984--2000oti-min-sea-kan521951085.5%2.6%7.76.61103.1%4.2%6.84.9
79Jim Kelly1986--1996buf393301106.1%3.2%86.6673.1%4.6%6.64.6
80John Hadl1962--1977sdg-ram-gnb-oti339411037%3.7%8.26.6923.3%7.8%6.12.7
81Bernie Kosar1985--1996cle-dal-mia25254674.8%1.9%7.46.6663.1%3.4%6.65.1
82Jake Delhomme1999--2011nor-car-cle-htx22822655.5%2.9%7.86.6453.1%4.2%6.64.8
83Vince Evans1977--1995chi-rai9511377.1%3.8%8.26.6572.4%6%6.33.6
84John Elway1983--1998den564391635%2.6%7.76.6922.8%3.9%6.34.6
85Drew Bledsoe1993--2006nwe-buf-dal459461025.1%1.9%7.46.6992.4%4.2%5.94
86Jason Campbell2006--2011was-rai14417323.8%1.7%7.36.6393.3%2.7%6.45.3
87Pete Liske1964--1972nyj-den-phi5170167%2.6%7.66.6232.2%8.2%5.92.3
88Jeff George1990--2001clt-atl-rai-min-was28603485.5%2.7%7.76.6853.2%2.9%6.65.4
89Alex Smith2005--2011sfo13038334.4%1.1%76.6392.9%4.3%64.1
90Jim Zorn1976--1987sea-gnb-tam21249524.9%2.9%7.86.6682.8%5.4%6.13.7
91Lynn Dickey1971--1985oti-gnb23914526.5%4.4%8.46.6763.5%6.6%74.1
92Jon Kitna1997--2011sea-cin-det-dal30104565.7%2%7.46.6862.8%4.7%6.34.3
93Eric Hipple1981--1989det11009306.3%3%7.86.6361.8%5.5%6.44
94Bob Griese1967--1980mia265591087.4%3.9%8.16.5623.5%6.4%6.43.5
95Chris Miller1987--1999atl-ram-den19789375.7%2.4%7.56.5633.6%4.2%6.34.5
96Gus Frerotte1994--2008was-det-den-cin-min-mia-ram21666585.1%2.7%7.66.5602.5%4.1%6.24.4
97Matt Hasselbeck1999--2011gnb-sea-oti35891915.1%2.4%7.56.5803%3.4%6.34.8
98Tarvaris Jackson2006--2011min-sea7239274.5%3.1%7.86.5232.8%3.4%5.84.3
99Jeff Blake1992--2005nyj-cin-nor-rav-crd-phi-chi21711425.1%2.1%7.46.5773.6%3.6%6.34.7
100Tony Eason1983--1990nwe-nyj11703355.1%2.8%7.76.5313.3%3.4%6.75.2
101Jim Harbaugh1987--2000chi-clt-rav-sdg27194784.8%2.1%7.36.5932.3%3.6%6.24.6
102Don Majkowski1987--1996gnb-clt-det12906344.8%2.8%7.76.5432.6%4.2%64.2
103Gary Hogeboom1982--1989dal-clt-crd9598315.1%2.6%7.56.5282.7%6.1%6.74
104Joe Theismann1974--1985was26988956%2.8%7.66.5592.4%5.1%6.34.1
105Randall Cunningham1985--2001phi-min-dal-rav32405986.1%2.6%7.66.5733.1%3.6%6.34.7
106Byron Leftwich2003--2010jax-atl-pit-tam10439305%1.6%7.16.5312.6%3.5%6.24.7
107Tony Banks1996--2005ram-rav-was-htx15315435.2%2.2%7.46.5522%3.7%5.94.3
108Bobby Hebert1985--1996nor-atl22331635.2%3%7.76.5553.5%5%6.24.1
109Greg Landry1968--1984det-clt-chi16100556.7%3.9%8.16.5652.5%4.7%6.34.2
110Eli Manning2004--2011nyg30095775.5%2.2%7.36.4543.7%4.5%6.74.7
111Jay Fiedler1998--2005min-jax-mia-nyj12499505%2.6%7.56.4292.5%5.9%63.4
112Stan Humphries1989--1997was-sdg18538554.4%2.3%7.46.4392.2%5.1%5.93.7
113Jim Plunkett1971--1986nwe-sfo-rai28175855.6%3.4%7.96.4823.2%7.1%6.43.2
114Elvis Grbac1994--2001sfo-kan-rav17492614.8%2.4%7.46.4393.1%4.4%6.24.3
115Richard Todd1976--1985nyj-nor21636515.2%3.6%7.96.4703.2%7%6.23.1
116Steve Grogan1975--1990nwe27457806.7%4.3%8.26.4713.5%7.2%6.83.6
117Frank Ryan1960--1970ram-cle-was15833669.3%4.4%8.26.4424%6.1%6.63.9
118Carson Palmer2004--2011cin-rai25659505.9%2.9%7.66.4593.8%3.5%6.95.3
119Shaun Hill2005--2011min-sfo-det6209185.5%1.8%7.16.4163.2%2.8%6.35.1
120Mark Rypien1988--2001was-cle-ram-phi-clt20249585.7%3.3%7.76.4472.9%3.6%6.54.9
121Bubby Brister1986--2000pit-phi-nyj-den-min14801475.7%2.3%7.36.4511.9%4.3%5.93.9
122Kerry Collins1995--2011car-nor-nyg-rai-oti-clt42478924.4%2.1%7.26.41132.7%4%6.14.3
123Steve McNair1995--2007oti-rav330681004.6%2.1%7.26.4722.6%3.4%6.44.9
124Charlie Batch1998--2011det-pit10610405.2%2.8%7.56.3373.1%3.4%6.65.1
125Bill Nelsen1963--1972pit-cle15004466.5%4.1%86.3433%7.2%6.53.4
126Charley Johnson1961--1975crd-oti-den24410687.3%4.7%8.36.3703%5.9%6.33.6
127Steve Bartkowski1975--1986atl-ram24916605.9%3.1%7.66.3733.5%5.2%6.54.3
128Sam Bradford2010--2011ram567684.1%1.5%6.96.3181.9%2.5%5.64.5
129Gary Danielson1977--1988det-cle14000424.9%2.9%7.56.3433.5%5.3%6.74.4
130Brian Sipe1974--1983cle23896606%3.2%7.66.3623%5.4%6.23.8
131Jay Schroeder1985--1994was-rai-cin-crd20854715.2%2.7%7.46.3502.7%5.3%6.64.3
132Virgil Carter1968--1976chi-cin-sdg5127215.7%3%7.56.3242.1%4.7%5.63.5
133Tommy Kramer1977--1990min-nor25651645.9%2.8%7.46.3662.9%5.7%6.23.7
134Brad Johnson1994--2008min-was-tam-dal304571024.6%2.1%7.16.2702.9%3.9%6.24.5
135Kelly Holcomb1995--2007tam-clt-cle-buf-min645395.5%3.4%7.76.2294%4.5%6.54.6
136Quincy Carter2001--2004dal-nyj6491204.7%2.2%7.16.2181.8%5.3%5.93.5
137Ryan Fitzpatrick2005--2011ram-cin-buf10936226.2%2.4%7.26.2342.9%4.5%5.93.9
138Neil O'Donnell1991--2003pit-nyj-cin-oti23399725%2%76.2582.5%2.3%6.35.4
139James Harris1969--1979buf-ram-sdg8479445.8%4.2%86.2341.8%6.6%63.1
140Brian Griese1998--2008den-mia-tam-chi19440535.2%2.8%7.46.2403.3%4.2%6.64.7
141Terry Bradshaw1970--1983pit318221257%4.3%86.2623%7.3%6.12.9
142Bill Munson1964--1979ram-det-sea-sdg-buf12940416.4%2.6%7.26.2582.8%5%6.13.9
143Steve Tensi1966--1970sdg-den5558158.5%4.4%86.1293.5%5.7%5.83.3
144Jeff Kemp1981--1991ram-sfo-sea-phi6403286.7%2.9%7.36.1261.9%5.5%6.33.8
145Ty Detmer1993--2001gnb-phi-sfo-cle-det6499184.9%2.5%7.16.1242.7%4.6%6.54.4
146Billy Wade1960--1966ram-chi11390346.1%3.5%7.66.1333.8%6.3%6.43.7
147Dave M. Brown1992--2000nyg-crd10304294.1%2.5%7.26.1421.9%4.2%5.84
148Mark Sanchez2009--2011nyj10364305.1%2%6.96.1222.9%5%6.24
149Joe Ferguson1973--1990buf-det-tam-clt30631836.4%3.1%7.46.11073%5.8%6.13.5
150Norm Snead1961--1976was-phi-min-nyg-sfo30797576.9%4.3%7.96.11143.5%6.7%6.73.7
151Dennis Shaw1970--1975buf-crd6347125.9%5.3%8.46.1342.8%8.1%6.52.9
152Vince Ferragamo1977--1986ram-buf-gnb12564357.1%3.7%7.66.1422.9%7.1%6.53.4
153Jake Plummer1997--2006crd-den30593744.7%2.5%7.16.1752.9%4.8%6.44.3
154Tommy Maddox1992--2005den-ram-nyg-pit8754275.9%3.2%7.46.1282.6%5.3%6.13.7
155Daryle Lamonica1963--1974buf-rai210821047.8%4.6%86.1373%7.3%62.8
156Kyle Orton2005--2011chi-den-kan14532364.5%1.9%6.86.1353%3.1%6.45
157Roman Gabriel1962--1977ram-phi29780875.7%2.6%7.16.1793.2%4%5.84.1
158Bob Lee1969--1980min-atl-ram5416605.9%4.8%8.16.1241.2%6.2%52.3
159David Carr2002--2010htx-car-nyg-sfo14433323.4%2.2%76.1612.7%3.4%6.24.7
160Jack Trudeau1986--1995clt-nyj-car10494253.2%2.4%7.16432.3%5.2%5.83.5
161Steve Fuller1979--1986kan-chi7454334%3.5%7.56291.9%4%6.24.5
162Danny White1976--1988dal242431245.8%4%7.76594%5.3%6.74.4
163Archie Manning1971--1984nor-oti-min23911374.4%3.2%7.461103.1%5.1%6.34.1
164Ken Stabler1970--1984rai-oti-nor305791106.6%4.6%7.96643%7.3%6.53.3
165Doug Williams1978--1989tam-was18108495.4%2.8%7.26453.1%4.8%6.54.4
166Joe Pisarcik1977--1984nyg-phi5552254.6%4.1%7.86322.1%5.7%5.73.1
167Jim McMahon1982--1996chi-sdg-phi-min-crd-gnb19260864.5%3.3%7.46402.6%3.8%6.44.8
168Milt Plum1960--1969cle-det-ram-nyg13335466.9%4.9%8.16403.1%6%6.33.7
169Ron Jaworski1974--1989ram-phi-mia-kan29859895.4%2.9%7.26793.4%4.8%6.54.4
170Rodney Peete1989--2004det-dal-phi-was-car16636554.3%3.4%7.56482.2%4.3%6.54.6
171Vinny Testaverde1987--2007tam-cle-rav-nyj-dal-nwe-car475531025.3%3.1%7.361373.3%4.5%6.74.7
172Billy Kilmer1961--1978sfo-nor-was21555886.7%3.7%7.56813.3%5.9%6.13.5
173Tim Couch1999--2003cle11131225.5%3.2%7.36402.7%4.3%64.1
174Erik Kramer1987--1999atl-det-chi-sdg16336384.9%2.4%76483.4%4.1%6.54.7
175Trent Dilfer1994--2007tam-rav-sea-cle-sfo21489685.3%2.7%7.16652%5.1%63.7
176Mike Pagel1982--1993clt-cle-ram9593224.5%2.6%7.16532.9%4.9%63.8
177Kordell Stewart1995--2005pit-chi-rav15490763.5%2.1%6.85.9542.7%5.6%5.53
178Chad Henne2008--2011mia7114143.6%1.7%6.65.9202.4%4.6%6.74.7
179Jim Hart1966--1984crd-was35156935.7%4%7.65.91032.9%5.5%6.23.8
180Vince Young2006--2011oti-phi9102354.5%3%7.15.9272.2%4.9%6.54.3
181Josh McCown2002--2011crd-det-rai-car-chi6998154.2%1.6%6.55.9362.9%5.2%6.23.9
182Mark Malone1981--1989pit-sdg-nyj10733296.3%3%7.15.8442.3%5.9%5.83.2
183Babe Parilli1960--1969rai-nwe-nyj18778647.1%4.1%7.55.8473.2%7.5%5.92.5
184Don Strock1974--1988mia-cle5913377.1%3.6%7.35.8304.5%7.3%6.63.3
185Dick Wood1962--1966sdg-nyj-rai-mia7153177.1%3.4%7.25.8282.6%7.3%5.32.1
186Shaun King1999--2004tam-crd5057195.9%2.3%6.75.8161.1%4.1%5.53.7
187Pat Haden1976--1981ram10024414.4%2.9%75.8263.1%7.1%6.43.3
188Bobby Douglass1969--1978chi-sdg-nor-gnb6493166.2%3.5%7.25.8572.1%5.8%5.12.5
189Cotton Davidson1960--1968kan-rai11451306.5%4.1%7.55.7402.9%7.2%6.33.1
190Steve Bono1985--1999min-pit-sfo-kan-gnb-ram-car10576494.6%1.8%6.45.7262.5%3.7%5.74.1
191Marc Wilson1980--1990rai-nwe14526395.8%4%7.45.7422.8%5.8%6.53.9
192Billy Joe Tolliver1989--1999sdg-atl-oti-kan-nor10760245%2.6%6.85.7533%4.1%6.14.4
193Rick Mirer1993--2003sea-chi-nyj-sfo-rai11969273.9%2.4%6.65.6521.8%4.4%5.53.5
194Steve Ramsey1970--1976nor-den6437235.4%5.9%8.15.6282.4%6.5%6.33.4
195Jacky Lee1960--1969oti-den-kan6191309%7%8.55.5294%6.9%6.63.6
196Hugh Millen1987--1995ram-atl-nwe-den644082.3%4.2%7.45.5302.4%3.6%6.85.2
197Jim Ninowski1960--1969det-cle-was-nor6953334.3%4.5%7.55.5272.6%7.4%6.22.9
198Dave Wilson1981--1988nor7007164.2%5.2%7.85.5373.1%5.5%6.23.8
199Kyle Boller2003--2011rav-ram-rai8931304.1%1.7%6.25.5362.6%4.7%5.73.6
200Joey Harrington2002--2007det-mia-atl14693274.4%2.2%6.45.5552.5%3.8%5.53.9
201Todd Blackledge1983--1989kan-pit5366225.2%3.4%6.95.5221.7%5.2%5.32.9
202Mike Tomczak1985--1999chi-gnb-cle-pit16963793.8%3.9%7.15.5593.4%5.3%6.64.2
203Mike Livingston1968--1979kan11295374.4%3.2%6.85.5522.4%5.7%6.23.7
204Danny Kanell1996--2003nyg-atl-den5328145.3%2.5%6.55.5252.2%4%4.93.2
205Steve Dils1980--1988min-ram-atl5816183.5%2.6%6.55.4292.4%3.6%5.74.1
206Jack Thompson1979--1984cin-tam5329155.3%1.8%6.15.4303.5%6.2%6.33.6
207Kent Graham1992--2001nyg-crd-pit-was7801274.4%1.6%65.4331.8%3.1%5.74.3
208David Woodley1980--1985mia-pit9203384.4%3.5%6.95.4243%7.4%6.33.1
209Randy Johnson1966--1976atl-nyg-was-gnb8329147.8%4.4%7.25.4583.2%7.6%6.33
210Rex Grossman2003--2011chi-htx-was11015304.7%3.3%6.85.4272.3%4.3%6.24.3
211Jim Miller1995--2002pit-chi6410203.9%2.9%6.65.3183%3.2%5.64.3
212Dan Pastorini1971--1983oti-rai-ram-phi19469624.6%4.2%7.15.3812.5%6.1%5.42.7
213Paul McDonald1980--1984cle5550123.8%3.4%6.85.3232.8%5.1%74.7
214George Blanda1960--1975oti-rai220291428.4%6%7.85.3793.9%8%6.12.5
215Jack Kemp1960--1969sdg-buf22256714.6%5.2%7.55.2462.2%7.1%6.23
216David Whitehurst1977--1983gnb6205216.1%5.3%7.45.1301.1%5.4%5.73.3
217Zeke Bratkowski1960--1971chi-ram-gnb8005304.7%5.5%7.55.1453.5%8.9%6.62.7
218Steve Spurrier1967--1976sfo-tam6878486.4%4.9%7.15.1532.2%5.2%5.43.1
219Joe Kapp1967--1970min-nwe6746266.6%6.2%7.75.1262.2%8.1%5.72.1
220Bob Avellini1975--1984chi7288304.2%5.9%7.55362.3%6.8%5.72.7
221Frank Tripucka1960--1963den7676135.1%5.9%7.55293.3%6.7%5.22.3
222Pete Beathard1964--1973kan-oti-crd-ram8544404.5%5.3%7.24.9342.5%7.3%5.62.4
223Gary Cuozzo1963--1972clt-nor-min-crd7688474.6%3.9%6.54.9352.9%5.7%63.5
224Al Dorow1960--1962nyj-buf5732145.7%5%6.94.8184.7%8.5%5.82.1
225Steve Walsh1989--1999dal-nor-chi-ram-tam-clt8248273.9%3.2%6.24.8342.4%4.5%5.93.9
226Mike Phipps1970--1981cle-chi10806504.5%3.7%6.44.8511.7%8.4%5.31.6
227Scott Brunner1980--1985nyg-crd6843163.7%3.7%6.34.7293%5.8%6.23.6
228Jack Concannon1964--1975phi-chi-gnb-det6270274.6%4.3%6.54.6322.5%6.8%5.12.1
229Mike Taliaferro1964--1972nyj-nwe-buf5241198.2%4.7%6.34.4412.2%7.2%5.11.9

[continue reading…]

References

References
1 Unfortunately, I excluded sack data from this study due to its general unavailability for most of the covered time period.
{ 0 comments }

NYT Fifth Down: Post-week 17

At the New York Times Fifth Down Blog this week, I explain my choices for the major awards this season.

Offensive Player of the Year: Adrian Peterson, Minnesota Vikings

Generally, the Most Valuable Player award is given to the best quarterback, while the Offensive Player of the Year is usually the player with the most impressive statistics. In the last five years, Tom Brady — first in 2007, and then again in 2010 — is the only player to take home both awards in the same season. Last year, Drew Brees won the award while Aaron Rodgers took home the M.V.P., but running backs Priest Holmes (2002), Jamal Lewis (2003), Shaun Alexander (2005), LaDainian Tomlinson (2006), and Chris Johnson (2009) have all won the award in the last decade. While Calvin Johnson will probably get some support for breaking Jerry Rice’s single-season record for receiving yards, Adrian Peterson has had this award locked up for a month, and finishing the season with 2,097 yards was the icing on the cake.

I don’t think you’ll find too many people arguing about this one. Peterson’s story is outstanding, and it’s hard to argue that he didn’t provide the single most impressive performance by an offensive player this year. Quarterbacks may be more valuable, but it’s hard not to just sit back and admire what Peterson’s done. Johnson’s also had a magnificent season, but he was greatly aided by the Lions also breaking the record for pass attempts in a season.

Defensive Player of the Year: J.J. Watt, Houston Texans

The shine is off the Texans, but there’s no denying that their star lineman has been outstanding this year. If the stars were aligned slightly differently — say, the Texans were streaking towards the end of the year, and Watt had a monster primetime game late — he’d have a legitimate chance at the M.V.P. award. Last month, I talked about how this award was a three-man race with the stars all coming from the 2011 Draft. In that article I also mentioned Geno Atkins as a possible darkhorse, and he’s been ever better since. But Watt has 20.5 sacks and the national reputation as the Sultan of Swatt, so this award is pretty easy to predict.

And well justified. Watt’s production as a 3-4 defensive end is remarkable. He now owns the single-season record for sacks by a player at that position, but he’s far from one dimensional. We know that he is fantastic at tipping passes at the line of scrimmage and is excellent in run support. He’s a complete player in every respect, a dominant force at a position that rarely receives media attention.

I’d select Von Miller as my runner-up and give Atkins the bronze. While Aldon Smith gets more attention because of his lofty sack totals, he’s a one-dimensional player. While he’s outstanding at that one dimension, just being a dominant pass rusher only makes him the fourth best defensive player this year. He also disappeared down the stretch, which not coincidentally began when star defensive end Justin Smith went down with a triceps injury.

Comeback Player of the Year: Peyton Manning, Denver Broncos

Peyton Manning missed the entire 2011 season, but as soon as he took the field in 2012 he became the favorite to win Comeback Player of the Year. A quarterback has won this award each of the last four years — Chad Pennington (2008), Tom Brady (2009), Michael Vick (2010), and Matthew Stafford (2011) — and the trend should continue in 2012. Comeback Player of the Year is a two-man race, and there’s no wrong answer when choosing between Manning and Peterson. If the voters could, surely the majority would pick that Manning and Peterson split the award. If ever an award called for a split, this was it.

Peyton Manning’s neck injury was considered career-threatening this time last year. Many questioned his arm strength in the pre-season and in September, but by the end of the year he was once again the best quarterback in the league. It’s simply splitting hairs picking between Manning and Peterson, who tore two ligaments in his knee just over a year ago and rebounded to rush for 2,000 yards. And let’s at least recognize Jamaal Charles, who in any other year would likely take home the award. The Kansas City running back tore the anterior cruciate ligament in his left knee last season, and rebounded to rush for over 1,500 yards in 2012. My guess is that those voters looking for a tiebreaker focus on the fact that Manning missed the entire 2011 season while Peterson ran for 970 yards and 12 touchdowns last year, making Manning more of a “comeback” story.

You can view the full post here.

{ 3 comments }

I’ve been on a major QB kick lately, and there’s no reason to stop now. Today, I want to look at a method that might tease out a quarterback’s “true talent” better than if we simply use his raw stats from the season.

Three years ago, our colleague Jason Lisk had a post on the old PFR Blog about which rate stats stay consistent when a QB changes teams. Basically, he grabbed QBs who were still in their primes and changed teams, looking at how their key rate stats correlated from one year to the next. Here’s what Jason found:

[…]I looked at the correlation coefficient for our group of 48 passers, for the year N advanced passing score compared to the year N+1 advanced passing score in each category. This should tell us whether the passers who were good in a performance area (or bad) tended to be the ones who remained good in that performance area the following season, even with the uncertainty of team changes (some positive, some negative for the quarterback).

Sack Percentage:  0.31
Completion Percentage: 0.25
Yards Per Attempt:  0.20
Touchdown Percentage: 0.12
Interception Percentage: 0.10

What do those correlations mean, exactly? Well, take sack percentage as an example. In general, a correlation of 0.31 means you can expect 31% of a QB’s difference from the mean to be repeated next year when he changes teams. In other words, you have to regress the QB’s sack rate 69% towards the mean to get the true rate that “belongs” to him. If the average sack rate is 6.1%, and a QB has a rate of 4.0% (like, say, Drew Brees this year), his “true” sack rate is probably something like 5.4% — 31% of the distance between .061 and .040.

The same concept applies to the other stats listed above. Tony Romo’s observed 66.7% completion percentage is really more like 62.5% after regressing to the mean, and so forth. Do that for every QB who had a reasonable number of attempts this year, and you get these rate stats:

PlayerTmGGSAttA-Sk%A-Cmp%A-YPAA-TD%A-INT%R-Sk%R-Cmp%R-YPAR-TD%R-INT%
Matthew StaffordDET14146294.359.56.82.72.45.560.77.04.02.6
Drew BreesNOR14145744.062.07.66.33.15.461.47.24.52.7
Tony RomoDAL14145685.366.77.53.92.85.962.57.24.22.7
Andrew LuckIND14135646.254.67.13.53.26.159.57.14.12.7
Carson PalmerOAK14145624.460.97.13.92.55.661.17.14.22.6
Tom BradyNWE14145603.963.47.65.41.15.461.77.24.42.5
Matt RyanATL14145394.468.57.85.02.65.663.07.24.32.7
Peyton ManningDEN14145113.967.97.96.12.05.462.87.24.42.6
Brandon WeedenCLE14144985.057.26.62.83.45.760.27.04.02.7
Philip RiversSDG14144888.164.36.74.53.16.762.07.04.22.7
Joe FlaccoBAL14144876.559.17.14.12.16.260.77.14.22.6
Eli ManningNYG14144873.060.47.44.13.15.161.07.14.22.7
Sam BradfordSTL14144826.860.26.83.72.36.360.97.04.22.6
Matt SchaubHOU14134764.064.77.54.62.15.562.07.24.32.6
Aaron RodgersGNB14144748.766.77.66.81.76.962.57.24.52.6
Andy DaltonCIN14144727.562.57.05.53.06.561.57.14.42.7
Josh FreemanTAM14144694.354.87.45.32.65.559.67.14.32.7
Ryan FitzpatrickBUF14134445.961.76.65.03.46.061.37.04.32.7
Christian PonderMIN14144256.663.15.93.32.86.261.66.94.12.7
Ryan TannehillMIA14144245.858.76.92.42.86.060.57.04.02.7
Cam NewtonCAR14144237.258.28.24.32.46.460.47.34.22.6
Mark SanchezNYJ14144187.354.86.43.14.16.559.66.94.12.8
Ben RoethlisbergerPIT11113985.764.17.35.51.56.061.97.14.42.6
Jay CutlerCHI13133778.559.77.04.53.76.860.87.14.22.8
Russell WilsonSEA14143536.962.97.65.92.56.361.67.24.42.7
Robert Griffin IIIWAS13133517.466.48.35.11.16.562.57.34.32.5
Michael VickPHI993167.958.56.93.52.86.660.57.04.12.7
Blaine GabbertJAX10102787.358.36.03.22.26.560.46.94.12.6
Matt CasselKAN982776.458.16.52.24.36.260.47.04.02.8
Jake LockerTEN992695.657.67.03.33.35.960.37.14.12.7
Matt HasselbeckTEN852216.062.46.23.22.36.161.56.94.12.6
Nick FolesPHI652176.559.46.22.31.86.260.76.94.02.6
Alex SmithSFO9921710.070.08.06.02.37.363.47.34.42.6
Chad HenneJAX842168.551.96.73.72.36.858.87.04.22.6
John SkeltonARI762016.954.25.61.04.56.459.46.83.82.8
Kevin KolbARI6518312.959.66.44.41.68.260.86.94.22.6
Brady QuinnKAN861599.159.75.81.33.87.060.86.83.92.8
Colin KaepernickSFO1151548.365.68.44.51.36.862.37.34.32.5
Ryan LindleyARI631416.651.14.30.04.36.358.66.53.72.8

(“A-” before a stat means the actual observed rate; “R-” means the regressed rate.)

Now we just need to reconstruct the player’s raw passing line as though he posted those rate stats instead of his actual rates. Cmp%, YPA, TD%, and INT% are easy (just multiply by attempts), and Sack% can be derived via simple algebra:

Sacks_new = (-reg_sk% * Attempts) / (reg_sk% – 1)

(Sack yards can be assumed by multiplying raw sack yards per sack by the new sack total.)

Finally, we plug the new totals into the Adjusted Net Yards Per Attempt formula, and we have a QB stat that is sort of like baseball’s Fielding Independent Pitching (FIP), which also seeks to reduce the noise and teammate interactions in a pitcher’s ERA by reducing his performance to only those elements he has control over — strikeouts, walks, and home runs.

Here are the 2012 leaders in QB-FIP (along with their regressed totals):

RkPlayerAgeTmGGSCmpAttYdsTDIntSkSkYdsQB-FIP
1Peyton Manning36DEN141432151136972313291916.22
2Tom Brady35NWE141434656040272414322146.20
3Robert Griffin III22WAS13132193512568159241666.15
4Colin Kaepernick25SFO1159615411307411766.11
5Ben Roethlisberger30PIT111124639828361710251416.11
6Matt Ryan27ATL141433953938932314322256.11
7Eli Manning31NYG141429748734762013261656.09
8Drew Brees33NOR141435257441182616332376.08
9Josh Freeman24TAM141427946933502012271816.08
10Aaron Rodgers29GNB141429647434022112351976.06
11Cam Newton23CAR141425642330861811292036.05
12Russell Wilson24SEA14142173532539169241486.05
13Alex Smith28SFO99138217157510617976.04
14Matt Schaub31HOU141329547634072012272286.01
15Tony Romo32DAL141435556840712415352555.97
16Andy Dalton25CIN141429047233362113331765.94
17Joe Flacco27BAL141429548734532013322095.93
18Carson Palmer33OAK141434356239802315332545.92
19Ryan Fitzpatrick30BUF141327244431011912291515.89
20Andrew Luck23IND141333656439902315372305.89
21Matthew Stafford24DET141438262944132517372565.88
22Jake Locker24TEN991622691900117171085.88
23Michael Vick32PHI991913162223138221245.84
24Sam Bradford25STL141429448233802013322165.82
25Brandon Weeden29CLE141430049834772014301985.80
26Ryan Tannehill24MIA141425742429871711272055.78
27Chad Henne27JAX8412721615119616945.78
28Philip Rivers31SDG141430248834222113352215.77
29Matt Cassel30KAN98167277192811818975.75
30Jay Cutler29CHI131322937726611610281875.74
31Christian Ponder24MIN141426242529121711281645.70
32Nick Foles23PHI65132217150096141025.70
33Matt Hasselbeck37TEN85136221152596141055.70
34Mark Sanchez26NYJ141424941829031712291785.68
35Blaine Gabbert23JAX10101682781907117191385.61
36Kevin Kolb28ARI6511118312708516965.61
37Brady Quinn28KAN869715910866412705.50
38John Skelton24ARI7611920113658614895.46
39Ryan Lindley23ARI6383141921549725.15
Lg Average5.92
{ 3 comments }

These guys are pretty good.

These guys are pretty good.

After posting about SRS-style quarterback ratings on Monday, I was thinking about other things we can do with game-by-game data like that. In his QBGOAT series, Chase likes to compare QBs to the league average, which makes a lot of sense for all-time ratings — you want to reward guys who are at least above-average in a ranking like that. However, if we want seasonal value, perhaps average is too high a baseline.

Over at Football Outsiders, Aaron Schatz has always compared to “replacement level”, borrowing a concept from baseball. I like that approach, but replacement level can be hard to empirically determine. So for the purposes of this post, I wanted to come up with a quick-and-dirty baseline to which we can compare QBs.

To that end, I looked at all players who were not their team’s primary passer in each game since 2010. Weighted by recency and the number of dropbacks by each passer, they performed at roughly a 4.4 Adjusted Net Yards Per Attempt level. This is not necessarily the replacement level, but it does seem to be the “bench level” — i.e., the ANYPA you could expect from a backup-caliber QB across the league.

Using 4.4 ANYPA as the baseline, we get the following values for 2012:

QuarterbackQBYAB
Tom Brady1888.1
Peyton Manning1708.2
Matt Ryan1453.4
Drew Brees1441.8
Aaron Rodgers1337.4
Robert Griffin III1226.6
Matt Schaub1205.1
Josh Freeman1140.1
Cam Newton1128.2
Tony Romo1120.2
Ben Roethlisberger1082.8
Carson Palmer1011.9
Eli Manning1002.9
Joe Flacco914.8
Russell Wilson890.5
Matthew Stafford834.1
Andy Dalton756.9
Andrew Luck691.6
Sam Bradford616.3
Alex Smith558.5
Colin Kaepernick506.5
Ryan Fitzpatrick481.1
Philip Rivers447.7
Ryan Tannehill409.6
Brandon Weeden320.4
Michael Vick317.5
Jake Locker316.9
Jay Cutler293.8
Chad Henne217.4
Kirk Cousins156.8
Nick Foles152.5
Shaun Hill151.9
Matt Hasselbeck134.0
Kevin Kolb121.4
Blaine Gabbert92.2
Christian Ponder91.0
Mohamed Sanu87.7
Kyle Orton62.8
Matt Moore52.5
Derek Anderson30.1
Matt Flynn23.7
Dan Orlovsky17.6
Greg McElroy11.4
Tyrod Taylor9.2
Rusty Smith9.1
Chase Daniel5.6
Tyler Thigpen2.7
Graham Harrell-1.6
Terrelle Pryor-4.4
Matt Leinart-5.1
David Carr-5.9
Tim Tebow-6.3
Mark Sanchez-13.3
Charlie Batch-17.8
Kellen Clemens-22.4
Ryan Mallett-45.9
Byron Leftwich-46.6
Matt Cassel-47.7
Brad Smith-50.0
T.J. Yates-55.1
Jason Campbell-88.4
Brady Quinn-146.4
John Skelton-309.2
Ryan Lindley-382.0

If we weigh each game by how recent the results took place, we get this list:

QuarterbackWgtd QBYAB
Tom Brady1527.6
Drew Brees1205.4
Peyton Manning1202.0
Matt Ryan1129.8
Aaron Rodgers1109.4
Tony Romo961.1
Cam Newton936.6
Matt Schaub900.3
Robert Griffin III869.5
Eli Manning795.5
Ben Roethlisberger793.9
Josh Freeman790.3
Carson Palmer760.4
Russell Wilson722.9
Matthew Stafford687.5
Joe Flacco666.3
Andy Dalton520.4
Andrew Luck479.9
Sam Bradford459.9
Colin Kaepernick443.0
Alex Smith399.3
Philip Rivers384.9
Ryan Fitzpatrick324.0
Ryan Tannehill313.1
Brandon Weeden266.5
Michael Vick249.9
Jay Cutler236.8
Jake Locker192.4
Chad Henne178.7
Kirk Cousins158.7
Nick Foles150.5
Matt Hasselbeck133.1
Shaun Hill84.4
Kevin Kolb70.6
Matt Moore64.8
Kyle Orton59.8
Mohamed Sanu47.4
Matt Flynn47.4
Blaine Gabbert39.9
Dan Orlovsky26.3
Tim Tebow16.3
Derek Anderson16.3
Greg McElroy10.3
Chase Daniel5.1
Rusty Smith4.8
Tyrod Taylor4.0
Tyler Thigpen-0.8
Graham Harrell-1.4
Matt Leinart-2.8
David Carr-3.3
Terrelle Pryor-4.4
Charlie Batch-7.6
Kellen Clemens-14.0
Matt Cassel-24.2
T.J. Yates-29.7
Brad Smith-33.2
Byron Leftwich-38.3
Christian Ponder-39.4
Ryan Mallett-44.6
Jason Campbell-51.1
Mark Sanchez-91.0
Brady Quinn-113.4
John Skelton-263.6
Ryan Lindley-340.5

This kind of thing isn’t exactly the most advanced stat in the world, but it’s pretty good if you want to sort QBs into general groups based on how good they are (the assumption being that a player who never plays is implicitly a bench-level player by definition).

{ 2 comments }

Checkdowns: Biggest failed comebacks

Brady joins Marino on the failed comebacks list

Brady joins Marino on the failed comebacks list.

[UPDATE: There was an error earlier in this post. I believe it is fixed now.]

On Sunday Night, the Patriots trailed 31-3 halfway through the third quarter. But that’s when Tom Brady got hot, and New England tied the game with 6:43 left in the 4th quarter. At that moment, many fans probably had visions of the Oilers-Bills playoff game, where Buffalo came back from a 32-point deficit to win.

And while there are a lot of famous comebacks, the failed comeback is much less memorable. But in fact, this was the 4th time a team trailed by 28 points in the game only to tie or take the lead in the 4th quarter… but ultimately lose.

The table below shows all games prior to 2012 where a team trailed by at least 21 points, was trailing entering the 4th quarter, came back to tie or take the lead in the 4th quarter, but then still lost. The table is listed from the perspective of the eventual winner and shows the final points for and points allowed in the game, along with the biggest lead and the largest fourth-quarter deficit the winning team faced despite the large early lead.

YearDateBoxscoreTmOppPFPABgLdDef
199409/25/1994BoxscoreMINMIA3835280
194409/24/1944BoxscoreGNBCHI4228280
200710/21/2007BoxscoreTENHOU383625-1
200412/12/2004BoxscoreSFOARI3128250
198012/07/1980BoxscoreCINBAL343325-2
198710/25/1987BoxscoreGNBDET343324-2
198101/02/1982BoxscoreSDGMIA413824-7
199609/22/1996BoxscoreNWEJAX2825220
201012/13/2010BoxscoreBALHOU3428210
200910/11/2009BoxscoreARIHOU2821210
200901/10/2010BoxscoreARIGNB5145210
200809/14/2008BoxscoreGNBDET482521-1
200612/17/2006BoxscoreCHITAM3431210
200410/10/2004BoxscoreMINHOU3428210
200311/30/2003BoxscoreNWEIND3834210
199912/12/1999BoxscoreKANMIN3128210
199812/06/1998BoxscoreSFOCAR3128210
199511/19/1995BoxscoreDENSDG3027210
199309/12/1993BoxscoreNORATL3431210
199301/03/1994BoxscorePHISFO3734210
199111/17/1991BoxscoreNYJNWE2821210
199010/07/1990BoxscoreCINRAM3431210
198909/10/1989BoxscoreNWENYJ272421-3
198611/20/1986BoxscoreRAISDG3731210
198301/08/1984BoxscoreWASSFO2421210
198011/23/1980BoxscoreNYJHOU3128210
197909/09/1979BoxscoreWASDET2724210
197511/30/1975BoxscoreWASMIN313021-6
196011/06/1960BoxscoreBALGNB3824210
194910/23/1949BoxscoreNYGCHI3528210
194511/04/1945BoxscoreWASCRD2421210

Note that this excludes games this game between Green Bay and Pittsburgh from 1951, where the Packers held a 28-point lead and won, but actually trailed entering the 4th quarter.

{ 1 comment }

Here’s a quick set of quarterback ratings I was messing around with, based on Doug’s Simple Rating System. The basic setup: I took every passer-game (Att > 0) since the 2010 season, weighting for recency according to Wayne Winston’s method. I ran the data through the SRS to adjust for the quality of opponent pass defenses, creating a predicted Net YPA rate for each passer in each game via the following formula:

Predicted NYPA = League Constant + Home-Field Advantage + Passer Rating – Opponent Pass D Rating

The league constant in this case was a Net YPA of 6.24; the homefield component (which was positive while at home, negative on the road, and 0 in Super Bowls) was 0.05. Minimize the sum of squared errors between predicted and actual NYPA for each passer-game (weighted by recency and how many dropbacks the passer had in the game), and you’ve got a set of opponent-adjusted, recency-weighted QB ratings.

Throwing out the Brett Favres and Curtis Painters of the world who haven’t been active this year, here are the full ratings:

PlayerWgtd DrpbksNYPA Rating
Mohamed Sanu0.660.94
Brian Hoyer0.29.80
Shaun Hill8.85.13
Derek Anderson2.93.96
Kirk Cousins47.22.37
Chase Daniel1.22.02
Matt Flynn13.21.74
Tom Brady467.01.23
Kyle Orton20.71.16
Russell Wilson266.00.95
Robert Griffin III257.70.92
Peyton Manning382.90.78
Drew Brees472.30.75
Matt Ryan440.80.73
Colin Kaepernick147.40.72
Eli Manning399.10.64
Cam Newton359.50.64
Tony Romo468.30.54
Aaron Rodgers394.90.50
Kellen Clemens9.70.45
Matt Schaub376.30.39
Alex Smith176.10.39
Charlie Batch66.10.37
Josh Freeman395.00.28
Ben Roethlisberger324.60.23
Carson Palmer445.60.15
Matthew Stafford521.20.10
Joe Flacco410.40.00
Rusty Smith3.3-0.03
Tyrod Taylor2.5-0.10
Andrew Luck433.0-0.11
Jake Locker192.4-0.11
Sam Bradford399.1-0.15
Josh McCown4.7-0.17
Matt Moore36.9-0.18
Tarvaris Jackson26.4-0.20
Ryan Tannehill320.8-0.20
Rex Grossman27.3-0.21
Jordan Palmer0.0-0.27
Michael Vick231.4-0.30
Brandon Weeden367.1-0.40
Andy Dalton395.9-0.40
Dennis Dixon0.1-0.41
Ryan Fitzpatrick374.6-0.43
Jay Cutler307.5-0.43
Philip Rivers419.2-0.49
Drew Stanton0.5-0.56
Matt Hasselbeck181.8-0.58
Chad Henne212.4-0.59
Matt Cassel196.9-0.62
Mark Sanchez318.0-0.69
Dan Orlovsky21.3-0.76
Joe Webb5.3-0.77
Tyler Thigpen6.2-0.88
Colt McCoy24.7-0.90
Tim Tebow28.3-0.96
John Skelton172.9-1.04
Bruce Gradkowski1.4-1.09
Nick Foles205.3-1.16
Blaine Gabbert213.0-1.23
Christian Ponder334.1-1.23
T.J. Yates22.1-1.24
Kevin Kolb132.1-1.38
Jason Campbell55.1-1.46
Brady Quinn147.2-1.49
Charlie Whitehurst3.3-1.91
Byron Leftwich45.4-2.13
Trent Edwards0.4-2.13
Luke McCown2.5-2.14
Jimmy Clausen1.3-2.17
Ryan Mallett3.1-2.26
Caleb Hanie7.9-2.30
Ryan Lindley133.6-2.37
Greg McElroy7.0-2.51
Graham Harrell2.0-2.79
David Carr1.2-4.09
Matt Leinart1.6-4.71
Brad Smith0.7-6.04
Terrelle Pryor1.0-7.09

[continue reading…]

{ 1 comment }

Checkdowns: Elo-Ratings for NFL teams

So we're going to pretend all my losses were by 1 point?

So we're going to pretend all my losses were by 1 point?

Just a quick Friday night checkdown post. By now, you’re very familiar with the Simple Rating System. I used the SRS to create college football ratings every week this season and used the SRS to grade NFL teams earlier this year. Pro-Football-Reference.com calculates SRS ratings every week and they are always available on their Standings page.

The first S in SRS stands for Simple because the SRS is simply the sum of two variables: a team’s average margin of victory (or points differential) and a team’s strength of schedule.

But what if we only care about wins and losses? Even in that case, we still care about strength of schedule. The BCS mandates that the computer systems used to provide the official BCS ratings ignore margin of victory. Essentially, that’s what I’m doing here. To provide Elo-style ratings for NFL teams, I made each win a one-point win, each loss a one-point loss, and each tie worth 0 points. Therefore, a team’s MOV perfectly matches its record, leaving just the SOS to shuffle the deck.

Is this useful for anything? No. That’s why it’s a Friday night checkdown.

RkTeamGMOVSOSSRSRecord
1Houston Texans130.6920.0110.70411-2-0
2New England Patriots130.5380.1160.65410-3-0
3San Francisco 49ers130.4620.0810.5439-3-1
4Green Bay Packers130.3850.1070.4929-4-0
5Atlanta Falcons130.692-0.2730.4211-2-0
6Denver Broncos130.538-0.1660.37310-3-0
7Chicago Bears130.2310.1210.3528-5-0
8Seattle Seahawks130.2310.1140.3458-5-0
9Indianapolis Colts130.385-0.0530.3329-4-0
10Baltimore Ravens130.385-0.1350.2499-4-0
11New York Giants130.231-0.040.1918-5-0
12St. Louis Rams1300.1750.1756-6-1
13Minnesota Vikings130.0770.0670.1447-6-0
14New York Jets13-0.0770.1720.0956-7-0
15Washington Redskins130.077-0.0030.0747-6-0
16Dallas Cowboys130.077-0.0120.0657-6-0
17Cincinnati Bengals140.143-0.203-0.068-6-0
18Pittsburgh Steelers130.077-0.138-0.0617-6-0
19Miami Dolphins13-0.2310.126-0.1055-8-0
20Buffalo Bills13-0.2310.067-0.1645-8-0
21Arizona Cardinals13-0.3850.203-0.1814-9-0
22Detroit Lions13-0.3850.188-0.1974-9-0
23Tampa Bay Buccaneers13-0.077-0.162-0.2396-7-0
24Tennessee Titans13-0.3850.134-0.254-9-0
25New Orleans Saints13-0.231-0.035-0.2665-8-0
26Cleveland Browns13-0.231-0.125-0.3565-8-0
27Carolina Panthers13-0.3850.014-0.3714-9-0
28San Diego Chargers13-0.231-0.165-0.3965-8-0
29Philadelphia Eagles14-0.429-0.048-0.4764-10-0
30Jacksonville Jaguars13-0.6920.141-0.5512-11-0
31Oakland Raiders13-0.538-0.112-0.6513-10-0
32Kansas City Chiefs13-0.692-0.148-0.842-11-0
{ 2 comments }

I’ve noted a few times this year that Calvin Johnson, in his pursuit of Jerry Rice’s single-season receiving record, has quite an advantage on his side. The Lions have attempted more passes through 13 games of any team ever, and seem likely to break the pass attempts record.

Obviously it’s easier to gain more receiving yards when your team is throwing the ball nearly every play. That’s why when I came up with my Greatest WR Ever series, I looked at receiver performance per pass attempt.

I don’t have time for a nuanced analysis of wide receiver, but let’s just look at a simple statistic: receiving yards per team pass attempt. That’s what the table below shows, along with each player’s rank in receiving yards (the far left column). Brandon Marshall has 1,342 receiving yards while the Bears have only attempted 444 passes this year (including sacks). That means he’s averaging more than three yards per team pass attempt, which is incredible. Of course, it also speaks to the lack of other weapons in Chicago.

Ryds RkPlayerTmRecRydsTDTMATTYds/AttY/A Rk
2Brandon MarshallCHI101134294443.021
7Vincent JacksonTAM56114584422.592
4Andre JohnsonHOU82120934712.573
1Calvin JohnsonDET96154656182.54
6A.J. GreenCIN791151104782.415
5Demaryius ThomasDEN74119785032.386
12Steve SmithCAR6099924252.357
9Wes WelkerNWE95111645192.158
3Reggie WayneIND94122045692.149
8Roddy WhiteATL77114055352.1310
11Victor CruzNYG76100494792.111
14Brian HartlineMIA6292514422.0912
28Michael CrabtreeSFO6676153831.9913
13Julio JonesATL6399775351.8614
22Dwayne BoweKAN5980134361.8415
10Dez BryantDAL75102895671.8116
45Sidney RiceSEA4565873651.817
26Steve JohnsonBUF6177654321.818
24Davone BessMIA6177814421.7619
19Anquan BoldinBAL5882844821.7220
35Jeremy KerleyNYJ5272824351.6721
31Mike WilliamsTAM4673674421.6722
20Cecil ShortsJAX4382475001.6523
39Greg OlsenCAR5469154251.6324
25Randall CobbGNB7177774841.6125
15Marques ColstonNOR6588985591.5926
42Percy HarvinMIN6267734291.5827
23Eric DeckerDEN6479085031.5728
29Torrey SmithBAL4375374821.5629
18Tony GonzalezATL8183175351.5530
16Jason WittenDAL9288015671.5531
27Malcom FloydSDG5477555031.5432
17Lance MooreNOR5384845591.5233
32Josh GordonCLE4273254871.534
21Miles AustinDAL5581955671.4435
30Rob GronkowskiNWE53748105191.4436
34Mike WallacePIT5972885091.4337
47Hakeem NicksNYG5065234791.3638
44Jordy NelsonGNB4665864841.3639
59Brandon LaFellCAR3457744251.3640
72Golden TateSEA3749273651.3541
40Heath MillerPIT6167975091.3342
52Jermaine GreshamCIN5563654781.3343
70Vernon DavisSFO3850653831.3244
53Owen DanielsHOU5262264711.3245
49Nate WashingtonTEN3964844991.346
33Brandon MyersOAK7072845611.347
38DeSean JacksonPHI4570025411.2948
36Jimmy GrahamNOR6471085591.2749
58Chris GivensSTL3658434641.2650
{ 13 comments }

Checkdowns: My very first football article

Because I am an enormous narcissist, I wondered if I could find the very first article I ever wrote. And I did. While I doubt anyone visiting the site today wants to read an article by a first-time writer from the summer of 2002, if you do, here is my article discussing the fantasy relevance of a defense when ranking running backs. Here is the intro:

Being the most important position in fantasy football, running backs are analyzed and examined from just about every angle. Most fantasy footballers can tell you who slumped in the 2nd half, who had a great ypc, and who had a ton of “fluky” TDs last year that won’t likely happen again. One factor a lot of owners look into is the defense of a RB. Logic dictates that the RBs on good defenses are like gold mines: see Eddie George the past few years, Jamal Lewis and A-Train when their teams Ds had breakout seasons, and the original superstar of modern fantasy football, Emmitt Smith. 4 straight years as the number 1 RB, and his team’s D was in the top 5 all 4 years. Teams with great Ds are notorious for pounding the ball late in game, running a lot early in games(so as to not throw interceptions, and win the battle of field position and win it with your defense), and basically pad your RBs stats. While some put more weight than others on the importance of a strong D(some view it as very important, others as a deciding factor between 2 backs they rate similarly), it appears the correct weight to put on a defense when evaluating a RB is 0. Zilch. Nothing. Meaningless. Let’s take a look at last year:

RBYardsDPADPYADRYATDsYearDTR
Holmes15552313278200121
Martin15131252810200115
S. Davis1432133205200112
Green1387515169200112
Faulk138271031220017
Alexander131818231514200119
Dillon131514141110200113
Williams12452720146200120
Tomlinson123616191910200118
Hearst120691894200112
Avg1359141416915


Yards is the rushing yards, DPA is the POINTS ALLOWED RANK by that RBs defense, DPYA and DRYA are the rank that RBs team fared in Passing and Rushing yards allowed respectively, and TDs are rushing TDs for that RB. DTR is the average of the 3 defensive categories. The top 2 RBs last year were on teams with defenses who were in the bottom 5 of the league against the run. Using “common theory’, one would figure that teams that can’t stop the run, can’t control the clock, get behind early, and have to pass more. Those who backed off on Holmes and Martin due to their poor Ds(and Stephen Davis included) missed out. On average, the top 10 rushers in the league had well, average defenses. Middle of the pack in terms of points allowed, rushing yards allowed and passing yards allowed. Is this a one year trend?

I think it was Doug Drinen who once said if you don’t look at something you wrote five years ago and cringe, then you aren’t improving as a writer. For ten years old, this article seems to hold up okay although it could certainly use some editing. Fortunately, the conclusion is cringe-inducing enough for me to be convinced that I have improved from my first piece to my last.

{ 0 comments }

Scott Kacsmar has been keeping track of 4th quarter comebacks and game-winning drives for some time. As a technical matter, Greg McElroy earned both a 4th quarter comeback and led a game-winning drive in his first game ever yesterday. How rare is that?

The table below shows all the quarterbacks to lead 4th quarter comebacks and game-winning drives. Some of these, like Brian St. Pierre’scomeback win” — and to a large extent, McElroy’s 4QC/GWD — are far from laudable. Still, here is the list:

YearNameTmOppWeekFinal Score
2012Greg McElroyNYJARI137-6
2005Ryan FitzpatrickSTLHOU1233-27
2004Brian St. PierrePITBUF1729-24
2001A.J. FeeleyPHITAM1717-13
1998Ryan LeafSDGBUF116-14
1997Jim DruckenmillerSFOSTL215-12
1987Mike KelleySDGCIN310-9
1987Brian McClureBUFNYG56-3
1985Dieter BrockRAMDEN120-16
1985Bernie KosarCLENWE524-20
1985Steve YoungTAMDET1219-16
1981Turk SchonertCINSEA127-21
1977Jerry GolsteynNYGWAS120-17
1974Clint LongleyDALWAS1224-23
1971Archie ManningNORRAM124-20
1961Sam EtcheverrySTLNYG121-10
1961Warren RabbBUFHOU522-12
1960Bob WatersSFOBAL930-22
{ 1 comment }

McKayla Maroney is not impressed.

Lane Kiffin is not a very good coach, and that’s putting it mildly. He’s one of the most hated men in college football and he’s the face of a USC team that has had the worst season of any preseason favorite since at least 1964. With a 7-5 record, no one is defending Lane Kiffin. And given the various ways he mismanaged the clock against Notre Dame, nobody can defend his performance in that game.

But let’s puts everything aside — Kiffin for being Kiffin, the fact that USC had 1st and goal from the Notre Dame 2 with over 5 minutes remaining and then proceeded to waste over 150 seconds of clock — and look at one particular decision. Facing 4th and goal from the Notre Dame 1-yard line, trailing by 9 points with 2:33 left, Kiffin decided to go for it.

This clearly defies conventional wisdom, and when the move failed, it opened him up to even more criticism. But was it the right call? According to Brian Burke, if this had been an NFL game, the correct call would have been to kick the field goal.

That may not surprise traditionalists, but readers of this blog and Advanced NFL Stats may be surprised to find that, according to the 4th Down Calculator, when trailing by 9 with 2:33 remaining, you need an 87% chance of converting to make going for it the correct call. (I will note that if you are trailing by 10, things change dramatically and going for it is the correct play.)

But this was not an NFL game. Burke’s model is based on two assumptions that are relevant here: one, the team has an average number of timeouts remaining, and two, that the clock will stop with 2:00 to go. USC had one timeout left (which is probably below average for this situation) and there is no two-minute warning in college football. So it’s likely that using 2:33 is not the correct number to use the 4th down calculator for college.

If you use 2:33 remaining, you need an 87% chance of converting to make going for it the correct call.

But, according to the same model, if you use 2:03, it drops to 64%.

If you use 1:33, it drops to 13%.

Obviously figuring out which input to use is very important. However, let’s think about it in a different context.

If USC scores a touchdown and does not onside kick (which I don’t think they do), ND gets the ball at roughly the 25-yard line with 2:25 left. On 1st and 10, they run, USC calls timeout, and there is 2:20 left. On second down, Notre Dame runs, 40 seconds tick off, and there is 1:35 left. Rinse, repeat, and Notre Dame punts with 50 seconds left. This means USC gets the ball with roughly 40 seconds left at say, their own 45.

Here college football’s rules benefit the Trojans because the clock stops momentarily on first downs. At this point, it comes down to this:
[continue reading…]

{ 5 comments }

Checkdowns: FCS ratings and the FCS playoffs

In connection with calculating my college football SRS ratings at the FBS level, I also calculate them at the FCS level but rarely publish them. But with the FCS playoffs underway, I figured, why not? Here are the FCS ratings as of November 25th, 2012:

RkTeamGMOVSOSSRSRECTeam
1North Dakota St1118.923.542.410-1North Dakota St
2Sam Houston St111919.838.88-3Sam Houston St
3NW Missouri St1322.115.93810-3NW Missouri St
4Montana St1114.521.736.210-1Montana St
5Minn St-Mankato1217.418.335.712-0Minn St-Mankato
6Minnesota-Duluth1220.315.435.610-2Minnesota-Duluth
7South Dakota St129.325.7359-3South Dakota St
8Georgia Southern1111.522.834.28-3Georgia Southern
9Missouri Western1318.614.833.312-1Missouri Western
10Cal Poly SLO1113.22033.29-2Cal Poly SLO
11Eastern Washington118.124.732.99-2Eastern Washington
12Northern Iowa116.226.432.75-6Northern Iowa
13Central Arkansas1112.419.431.89-2Central Arkansas
14Indiana St117.422.6307-4Indiana St
15Illinois St115.724.129.88-3Illinois St
16Towson116.323.529.87-4Towson
17Wofford1110.41929.48-3Wofford
18Ashland12227.329.211-1Ashland
19Eastern Kentucky1110.11929.28-3Eastern Kentucky
20Southern Illinois112.526.629.16-5Southern Illinois
21Youngstown St114.224.528.77-4Youngstown St
22Henderson St1123.74.528.210-1Henderson St
23Appalachian St11424.128.18-3Appalachian St
24Old Dominion1113.814.328.110-1Old Dominion
25McNeese St118.91927.97-4McNeese St
26Sioux Falls1110.717.227.99-2Sioux Falls
27Winona St119.91827.99-2Winona St
28Chattanooga115.622.227.86-5Chattanooga
29Stony Brook1217.79.827.410-2Stony Brook
30Villanova128.518.927.48-4Villanova
31Northern Arizona117.119.9278-3Northern Arizona
32Harvard1017.39.126.48-2Harvard
33Samford114.221.425.67-4Samford
34Southern Utah11-2.127.725.65-6Southern Utah
35Richmond1110.415.125.48-3Richmond
36Tennessee-Martin114.42125.48-3Tennessee-Martin
37West Texas A&M1318.36.524.811-2West Texas A&M
38Michigan Tech1013.111.724.87-3Michigan Tech
39Montana112.921.624.55-6Montana
40Eastern Illinois121.123.224.37-5Eastern Illinois
41Missouri St11-7.531.624.23-8Missouri St
42St Cloud St117.416.6247-4St Cloud St
43Coastal Carolina128.215.8248-4Coastal Carolina
44The Citadel112.820.623.47-4The Citadel
45James Madison115.817.523.37-4James Madison
46New Hampshire116.916.323.28-3New Hampshire
47Albany NY1111.411.723.19-2Albany NY
48Stephen F. Austin110.821.722.65-6Stephen F. Austin
49Murray St11-123.522.55-6Murray St
50North Dakota11-123.522.55-6North Dakota
51Bemidji St104.417.822.26-4Bemidji St
52Wayne St NE114.517.722.26-5Wayne St NE
53Jacksonville St11-2.924.922.16-5Jacksonville St
54Harding1114.97.222.19-2Harding
55Tennessee St11616228-3Tennessee St
56UC-Davis11-224224-7UC-Davis
57Sacramento St11-0.222.2226-5Sacramento St
58Bethune-Cookman129.812.121.89-3Bethune-Cookman
59Portland St11-2.32421.73-8Portland St
60Central Missouri106.514.921.46-4Central Missouri
61Pittsburg St10813.321.27-3Pittsburg St
62Maine113.917.321.15-6Maine
63Grand Valley St111011.121.18-3Grand Valley St
64Valdosta St1117.33.7219-2Valdosta St
65Colgate128.712.120.88-4Colgate
66Emporia St119.311.320.79-2Emporia St
67Augustana SD111.918.720.55-6Augustana SD
68Shippensburg1317.3320.311-2Shippensburg
69Ohio Dominican1115.24.619.88-3Ohio Dominican
70Colorado St-Pueblo1218.7119.712-0Colorado St-Pueblo
71Northern St SD114.215.219.46-5Northern St SD
72Hillsdale117.611.619.27-4Hillsdale
73Midwestern St1112.96.219.19-2Midwestern St
74Winston-Salem St1224.4-5.41912-0Winston-Salem St
75Indiana PA1319.7-0.71912-1Indiana PA
76Lehigh118.79.718.410-1Lehigh
77Saginaw Valley St116.511.918.48-3Saginaw Valley St
78Furman11-624.218.23-8Furman
79Lindenwood MO1199.118.18-3Lindenwood MO
80Trinity CT819.1-0.918.18-0Trinity CT
81Delaware110.417.6185-6Delaware
82Northern Colorado11-3.721.8185-6Northern Colorado
83Princeton106.511.117.65-5Princeton
84William & Mary11-3.120.217.12-9William & Mary
85Weber St11-10.327.417.12-9Weber St
86South Dakota11-12.429.4171-10South Dakota
87Ferris St114.511.916.47-4Ferris St
88Wagner125.810.616.49-3Wagner
89Southern Arkansas1014.81.316.18-2Southern Arkansas
90Liberty113.711.615.36-5Liberty
91Brown105.8914.87-3Brown
92Fordham112.811.714.56-5Fordham
93Chadron St129.4514.49-3Chadron St
94SE Louisiana St11-10.925.314.45-6SE Louisiana St
95Elon11-6.620.914.33-8Elon
96New Haven1120.2-614.210-1New Haven
97Indianapolis1314.8-0.714.210-3Indianapolis
98West Alabama129.34.914.28-4West Alabama
99North Carolina A&T118.25.8147-4North Carolina A&T
100Mary Hardin-Baylor1227.2-13.313.912-0Mary Hardin-Baylor
101Dartmouth104.29.713.86-4Dartmouth
102Findlay105.5813.57-3Findlay
103Pennsylvania10-0.213.613.46-4Pennsylvania
104Northwestern St11-6.819.913.24-7Northwestern St
105Drake117.55.212.88-3Drake
106New Mexico Highlands1111.41.312.78-3New Mexico Highlands
107Middlebury814.6-212.67-1Middlebury
108SW Minnesota St11-6.819.412.64-7SW Minnesota St
109Washburn110.512.112.57-4Washburn
110Southern Oregon1216.8-4.212.59-3Southern Oregon
111Tennessee Tech11-719.612.53-8Tennessee Tech
112Lenoir-Rhyne1215.6-3.312.39-3Lenoir-Rhyne
113Delaware St111.211.112.36-5Delaware St
114SE Missouri St11-7.419.612.23-8SE Missouri St
115Shepherd1113-1128-3Shepherd
116Florida A&M11-1.913.511.74-7Florida A&M
117Abilene Christian1165.511.57-4Abilene Christian
118Western Carolina11-15.626.911.31-10Western Carolina
119Alabama St119.41.911.37-4Alabama St
120Mount Union1235.5-24.211.312-0Mount Union
121Northwood112.3911.25-6Northwood
122Concordia-St Paul11-8.319.511.22-9Concordia-St Paul
123West Chester11101.211.27-4West Chester
124California PA118.42.811.28-3California PA
125Monmouth NJ1029.111.15-5Monmouth NJ
126San Diego107.53.6117-3San Diego
127Carson-Newman1113-2.110.99-2Carson-Newman
128South Carolina St11-5.816.610.85-6South Carolina St
129Wayne St MI10-2.613.410.85-5Wayne St MI
130St Francis PA11-0.911.610.75-6St Francis PA
131Tuskegee1116.5-610.510-1Tuskegee
132Tarleton St104.65.810.46-4Tarleton St
133Missouri Southern11-0.410.810.46-5Missouri Southern
134Bloomsburg1291.410.410-2Bloomsburg
135Western Illinois11-16.426.4103-8Western Illinois
136North Carolina Central110.59.19.76-5North Carolina Central
137Morningside1227-17.59.512-0Morningside
138Kutztown119.6-0.19.57-4Kutztown
139Lamar12-7.216.69.44-8Lamar
140Duquesne111.18.19.25-6Duquesne
141Mary11-7.216.294-7Mary
142Ouachita Baptist106396-4Ouachita Baptist
143Jackson St113.55.38.77-4Jackson St
144Lafayette11-2.611.38.75-6Lafayette
145Arkansas-Pine Bluff118.40.18.59-2Arkansas-Pine Bluff
146Northeastern St OK10-7.315.78.44-6Northeastern St OK
147TAMU-Kingsville110.488.46-5TAMU-Kingsville
148North Alabama101.96.48.35-5North Alabama
149Linfield1120.3-12.47.911-0Linfield
150Holy Cross11-7.415.17.72-9Holy Cross
151Howard11-310.67.77-4Howard
152Central Washington119.3-1.97.47-4Central Washington
153Amherst88.7-1.47.36-2Amherst
154Dayton1125.37.36-5Dayton
155Cornell NY10-4.611.77.24-6Cornell NY
156Missouri S&T1119-11.97.210-1Missouri S&T
157UW-Oshkosh1222-15712-0UW-Oshkosh
158Mercyhurst119.9-2.979-2Mercyhurst
159Northern Michigan11-8.915.974-7Northern Michigan
160Jacksonville FL114.926.87-4Jacksonville FL
161Colorado Mines1110.6-3.96.76-5Colorado Mines
162Upper Iowa10-12.618.96.32-8Upper Iowa
163Alabama A&M112.93.56.37-4Alabama A&M
164UW-Platteville1018.4-12.16.38-2UW-Platteville
165Adams St1110.7-4.46.38-3Adams St
166Charleston WV1112.1-5.96.29-2Charleston WV
167St Xavier1219.1-12.96.211-1St Xavier
168Nicholls St10-14.120.26.11-9Nicholls St
169Slippery Rock113.32.86.16-5Slippery Rock
170East Central OK11-0.56.45.96-5East Central OK
171Minot St11-12.318.35.93-8Minot St
172Cumberlands KY1218.5-12.65.910-2Cumberlands KY
173Georgetown KY1123.8-17.95.910-1Georgetown KY
174Georgetown DC11-4.2105.85-6Georgetown DC
175Fort Hays St11-5.411.25.85-6Fort Hays St
176Robert Morris PA11-6.412.25.74-7Robert Morris PA
177Miles1112.9-7.35.68-3Miles
178Montana Tech118.5-3.15.48-3Montana Tech
179Nebraska-Kearney11-611.25.23-8Nebraska-Kearney
180Marian IN1117-12.24.710-1Marian IN
181Carroll MT119.2-4.54.77-4Carroll MT
182Butler115.2-0.64.78-3Butler
183Wesley1117.9-13.24.710-1Wesley
184Glenville St113.31.34.66-5Glenville St
185North Central1218-13.44.69-3North Central
186Central Oklahoma10-11.516.14.62-8Central Oklahoma
187Angelo St11-2.574.55-6Angelo St
188Marist105.5-1.24.34-6Marist
189Norfolk St11-4.58.74.34-7Norfolk St
190Morehead St1140.14.14-7Morehead St
191Concord113.50.547-4Concord
192Truman St11-4.78.53.94-7Truman St
193Bates85.3-1.43.95-3Bates
194Wesleyan85.4-23.45-3Wesleyan
195Bucknell11-912.23.23-8Bucknell
196Williams82.20.93.14-4Williams
197Walsh11-3633-8Walsh
198Humboldt St115.3-2.337-4Humboldt St
199Hampton10-7.310.12.93-7Hampton
200Sacred Heart11-7.710.52.82-9Sacred Heart
201Western Oregon112.70.12.86-5Western Oregon
202Gardner-Webb11-13.716.42.83-8Gardner-Webb
203SW Baptist11-6.99.42.53-8SW Baptist
204Columbia10-10.713.12.43-7Columbia
205Bryant11-7.59.82.34-7Bryant
206SE Oklahoma St10-24.22.24-6SE Oklahoma St
207Morgan St11-7.910.12.23-8Morgan St
208Edinboro10-0.932.14-6Edinboro
209Charleston Southern11-6.68.41.85-6Charleston Southern
210Mars Hill102.5-0.81.76-4Mars Hill
211Georgia St11-19.921.51.61-10Georgia St
212Austin Peay11-16.918.31.42-9Austin Peay
213UW-Whitewater1012.8-11.31.47-3UW-Whitewater
214Bentley109.6-8.41.18-2Bentley
215Missouri Valley1222.6-21.51.112-0Missouri Valley
216St Thomas1219.4-18.31.112-0St Thomas
217Minn St-Moorhead11-17.818.70.91-10Minn St-Moorhead
218Delta St10-5.96.70.93-7Delta St
219East Stroudsburg101.5-0.90.65-5East Stroudsburg
220St Francis IN1213.6-13.20.49-3St Francis IN
221Yale10-12.913.10.22-8Yale
222UNC-Pembroke103-2.80.26-4UNC-Pembroke
223Urbana1110.7-10.50.17-4Urbana
224Central Conn St10-14.113.9-0.12-8Central Conn St
225West Georgia10-4.44.2-0.23-7West Georgia
226Wingate113.4-3.8-0.46-5Wingate
227Hobart1221-21.4-0.412-0Hobart
228American Int'l103.4-4-0.77-3American Int'l
229Prairie View A&M11-5.54.7-0.83-8Prairie View A&M
230Fort Valley St123.8-4.7-0.98-4Fort Valley St
231Southern U.11-4.53.5-14-7Southern U.
232MidAmerica Nazarene1116-17.5-1.58-3MidAmerica Nazarene
233Mississippi Valley St11-1.5-0.1-1.65-6Mississippi Valley St
234SW Oklahoma St10-9.77.9-1.83-7SW Oklahoma St
235Pacific Lutheran1010.7-12.8-2.17-3Pacific Lutheran
236St Ambrose1111.8-14-2.19-2St Ambrose
237Idaho St11-25.623.5-2.11-10Idaho St
238Salisbury1213.3-15.4-2.29-3Salisbury
239Widener1125.2-27.4-2.211-0Widener
240Wheaton1018.8-21.1-2.38-2Wheaton
241VMI11-16.614.3-2.42-9VMI
242Minnesota-Crookston11-19.817.2-2.62-9Minnesota-Crookston
243Hardin-Simmons109.7-12.5-2.86-4Hardin-Simmons
244St Augustine's102.5-5.3-2.86-4St Augustine's
245Merrimack106.4-9.2-2.86-4Merrimack
246Louisiana College117.4-10.4-38-3Louisiana College
247Presbyterian11-16.313.1-3.22-9Presbyterian
248McMurry104.8-8-3.37-3McMurry
249Arkansas Tech11-7.94.5-3.35-6Arkansas Tech
250Simon Fraser11-1.1-2.5-3.65-6Simon Fraser
251Western New Mexico11-5.21.2-44-7Western New Mexico
252Newberry11-0.7-3.3-45-6Newberry
253Tiffin11-12.78.6-4.13-8Tiffin
254Gannon11-7.33-4.33-8Gannon
255Notre Dame OH11-149.7-4.33-8Notre Dame OH
256Johns Hopkins1216.9-21.3-4.410-2Johns Hopkins
257Willamette1012.3-16.7-4.58-2Willamette
258Rocky Mountain112.8-7.3-4.56-5Rocky Mountain
259Lake Erie11-12.98.1-4.73-8Lake Erie
260Belhaven1111.4-16.3-4.96-5Belhaven
261Rhode Island11-25.720.8-4.90-11Rhode Island
262West Liberty11-0.3-4.8-56-5West Liberty
263Colorado Mesa11-8.23.2-5.14-7Colorado Mesa
264C.W. Post10-5.50.3-5.23-7C.W. Post
265Elizabeth City St112-7.2-5.37-4Elizabeth City St
266Incarnate Word11-12.16.8-5.32-9Incarnate Word
267Coe1121.7-27.1-5.410-1Coe
268Stonehill101.2-6.6-5.45-5Stonehill
269Northwestern IA1216.5-22.4-5.89-3Northwestern IA
270Azusa Pacific11-7.61.7-5.94-7Azusa Pacific
271Shorter11-1-5-66-5Shorter
272Concordia-Moorhead1013.5-19.8-6.38-2Concordia-Moorhead
273Cal Lutheran1014.5-20.9-6.48-2Cal Lutheran
274Johnson C. Smith103.6-10.2-6.66-4Johnson C. Smith
275TAMU-Commerce10-169.3-6.71-9TAMU-Commerce
276Black Hills St11-5.7-1-6.84-7Black Hills St
277Eastern New Mexico10-13.96.9-73-7Eastern New Mexico
278Morehouse100.7-7.7-7.13-7Morehouse
279Chowan105.3-12.5-7.26-4Chowan
280Assumption10-0.4-6.8-7.23-7Assumption
281St John Fisher1110.2-17.5-7.38-3St John Fisher
282William Penn1212.8-20.3-7.59-3William Penn
283Catawba11-2.7-4.9-7.64-7Catawba
284Lincoln MO11-1810.3-7.71-10Lincoln MO
285Grand View116.9-14.6-7.77-4Grand View
286Virginia Union104.7-12.7-8.15-5Virginia Union
287Bethel MN128.7-16.8-8.19-3Bethel MN
288Birmingham-Southern1012.2-20.3-8.27-3Birmingham-Southern
289Montana St-Northern10-3.7-4.6-8.23-7Montana St-Northern
290Alcorn St11-14.76.4-8.24-7Alcorn St
291Elmhurst1210-18.3-8.310-2Elmhurst
292Rowan1012.7-21.1-8.47-3Rowan
293Shaw10-3.4-5.1-8.44-6Shaw
294Clarion11-10.52-8.44-7Clarion
295Montana-Western10-7.1-1.6-8.74-6Montana-Western
296Bethel TN134.7-13.4-8.79-4Bethel TN
297St Francis IL115.8-14.6-8.86-5St Francis IL
298Baker1110.2-19.2-98-3Baker
299Malone10-19.110.1-91-9Malone
300Savannah St11-23.514.4-9.11-10Savannah St
301Trinity TX108.5-17.6-9.27-3Trinity TX
302Heidelberg1116.3-25.5-9.29-2Heidelberg
303Faulkner116.5-15.7-9.26-5Faulkner
304WV Wesleyan11-5.4-3.8-9.23-8WV Wesleyan
305Augsburg1010-19.5-9.67-3Augsburg
306UW-Eau Claire10-4.2-5.4-9.64-6UW-Eau Claire
307Albany St GA100.7-10.4-9.76-4Albany St GA
308Bowie St10-1-8.7-9.75-5Bowie St
309Fairmont St10-5.2-4.6-9.84-6Fairmont St
310UW-La Crosse10-6.9-3-9.84-6UW-La Crosse
311Grambling St11-13.23.3-9.91-10Grambling St
312Alfred106.7-16.7-106-4Alfred
313McKendree10-6.2-3.9-10.13-7McKendree
314Utica105-15.1-10.16-4Utica
315Redlands913.4-23.7-10.26-3Redlands
316Bowdoin8-11.40.9-10.51-7Bowdoin
317Eastern Oregon10-9.3-1.2-10.54-6Eastern Oregon
318Cortland St118.8-19.3-10.59-2Cortland St
319Colby8-9.7-0.9-10.63-5Colby
320Sul Ross St100.6-11.5-10.95-5Sul Ross St
321Springfield1112.5-23.5-118-3Springfield
322Dixie St11-12.21.2-113-8Dixie St
323Huntingdon AL99.4-20.5-11.16-3Huntingdon AL
324Central St OH11-5.1-6-11.14-7Central St OH
325Arkansas-Monticello10-18.87.5-11.30-10Arkansas-Monticello
326Bacone107-18.6-11.66-4Bacone
327Endicott1117.5-29.2-11.79-2Endicott
328Hamilton8-15.13.4-11.71-7Hamilton
329Stillman11-3.2-8.5-11.86-5Stillman
330Ithaca104.3-16.1-11.86-4Ithaca
331Delaware Valley1115.1-26.9-11.88-3Delaware Valley
332Langston100.7-12.6-11.96-4Langston
333Union NY106.7-18.5-11.96-4Union NY
334Millikin109.1-21-11.95-5Millikin
335Davidson11-13.31.3-122-9Davidson
336Washington and Lee1110.2-22.3-12.18-3Washington and Lee
337North Greenville11-9-3.1-12.15-6North Greenville
338Virginia St10-2.3-10-12.34-6Virginia St
339Benedictine KS1110.1-22.6-12.57-4Benedictine KS
340Southern Nazarene10-10.8-1.8-12.61-9Southern Nazarene
341Buffalo St10-0.1-12.5-12.66-4Buffalo St
342Muhlenberg1112.1-24.7-12.68-3Muhlenberg
343Kentucky Christian111.6-14.4-12.77-4Kentucky Christian
344Cumberland TN116.1-19.2-13.18-3Cumberland TN
345St Joseph's IN11-5.2-7.9-13.16-5St Joseph's IN
346Tusculum11-11.7-1.5-13.22-9Tusculum
347St John's MN104.5-17.7-13.25-5St John's MN
348Quincy11-11.7-1.9-13.63-8Quincy
349Doane109-22.5-13.67-3Doane
350Gettysburg1013.9-27.6-13.77-3Gettysburg
351Texas Southern11-20.97.2-13.72-9Texas Southern
352Framingham St1216.9-30.8-13.910-2Framingham St
353Wittenberg1217-30.9-13.910-2Wittenberg
354Thomas More1013.8-27.7-13.97-3Thomas More
355Western St CO11-18.74.7-13.91-10Western St CO
356Salve Regina1115.9-29.9-149-2Salve Regina
357Fayetteville St10-10.6-3.6-14.22-8Fayetteville St
358Millsaps108.3-22.6-14.37-3Millsaps
359Franklin1214.8-29.1-14.39-3Franklin
360Illinois Wesleyan106.8-21.3-14.56-4Illinois Wesleyan
361Brockport St108.7-23.3-14.66-4Brockport St
362Southern Conn St11-10.9-3.8-14.63-8Southern Conn St
363Lycoming1014-28.7-14.78-2Lycoming
364Robert Morris IL1116.8-31.5-14.88-3Robert Morris IL
365Menlo9-0.1-14.9-153-6Menlo
366Millersville11-19.74.6-152-9Millersville
367Concordia AL8-0.5-14.7-15.24-4Concordia AL
368UW-Stevens Point10-9.4-5.9-15.22-8UW-Stevens Point
369Hampden-Sydney1010.8-26-15.26-4Hampden-Sydney
370Wabash1015.5-31-15.58-2Wabash
371Tufts8-18.93.4-15.50-8Tufts
372Lock Haven11-19.64-15.51-10Lock Haven
373Whitworth104.8-20.4-15.67-3Whitworth
374St Olaf104.8-20.6-15.87-3St Olaf
375Lane10-2.7-13.3-165-5Lane
376Otterbein108.1-24.1-168-2Otterbein
377NW Oklahoma St10-17.81.6-16.23-7NW Oklahoma St
378Tabor1019.4-35.6-16.28-2Tabor
379Texas Lutheran100.4-16.7-16.34-6Texas Lutheran
380UW-Stout10-7.9-8.6-16.53-7UW-Stout
381John Carroll107.9-24.7-16.86-4John Carroll
382RPI93.6-20.5-16.95-4RPI
383Baldwin-Wallace108.6-25.6-177-3Baldwin-Wallace
384Brevard11-12.3-4.9-17.22-9Brevard
385Dubuque103.1-20.6-17.55-5Dubuque
386Nebraska Wesleyan103.2-20.7-17.56-4Nebraska Wesleyan
387Ottawa1111.3-28.9-17.78-3Ottawa
388Evangel111-18.7-17.87-4Evangel
389Bridgewater St MA1110.2-28-17.89-2Bridgewater St MA
390Franklin & Marshall114.2-22.1-17.87-4Franklin & Marshall
391Wartburg109.4-27.2-17.96-4Wartburg
392Kean93.9-22.1-18.25-4Kean
393Albright119.4-27.7-18.38-3Albright
394Valparaiso11-21.73.3-18.41-10Valparaiso
395Siena Heights10-2.4-16.3-18.75-5Siena Heights
396Augustana IL10-0.1-18.7-18.75-5Augustana IL
397Trinity Int'l112.1-21.1-194-7Trinity Int'l
398St Anselm11-13.7-5.5-19.22-9St Anselm
399East Texas Baptist10-7.3-12-19.33-7East Texas Baptist
400Waynesburg118.5-27.9-19.310-1Waynesburg
401Ursinus104.5-23.8-19.36-4Ursinus
402Concordia NE111.5-21.1-19.55-6Concordia NE
403Pacific OR9-4.4-15.2-19.63-6Pacific OR
404Taylor10-0.7-19.2-19.94-6Taylor
405Lindsey Wilson11-5.9-13.9-19.93-8Lindsey Wilson
406Seton Hill11-17.1-2.8-19.90-11Seton Hill
407Virginia U-Lynchburg9-14.6-5.5-201-8Virginia U-Lynchburg
408Valley City St106.2-26.2-207-3Valley City St
409Chapman99.3-29.4-20.16-3Chapman
410Centre102.8-23-20.26-4Centre
411William Jewell11-16.8-3.5-20.32-9William Jewell
412Wash & Jeff113.7-24-20.38-3Wash & Jeff
413Clark Atlanta10-15.2-5.2-20.42-8Clark Atlanta
414West Virginia St11-20.90.4-20.52-9West Virginia St
415Edward Waters11-4-16.4-20.55-6Edward Waters
416Gustavus Adolphus10-3.5-17-20.53-7Gustavus Adolphus
417Campbell11-21.40.7-20.61-10Campbell
418Randolph-Macon104.1-24.8-20.77-3Randolph-Macon
419Bridgewater VA109-30-217-3Bridgewater VA
420Fort Lewis10-26.95.7-21.20-10Fort Lewis
421Rochester9-1.4-19.9-21.24-5Rochester
422Adrian118.9-30.7-21.89-2Adrian
423OK Panhandle St9-2.9-18.9-21.83-6OK Panhandle St
424Western New England109.9-31.7-21.86-4Western New England
425UW-River Falls10-14.4-7.5-21.82-8UW-River Falls
426Benedict10-13-9-221-9Benedict
427Concordia IL1113.7-36-22.310-1Concordia IL
428Dickinson St11-18.3-4-22.42-9Dickinson St
429Susquehanna101.3-23.7-22.56-4Susquehanna
430Central IA10-1.6-20.9-22.55-5Central IA
431Trine106.9-29.6-22.77-3Trine
432Simpson103.3-26.4-23.16-4Simpson
433Rhodes90.1-23.3-23.36-3Rhodes
434Sewanee10-3.9-19.5-23.43-7Sewanee
435Hastings10-2-21.5-23.56-4Hastings
436Cheyney11-24.50.9-23.51-10Cheyney
437Norwich1010.5-34-23.57-3Norwich
438Campbellsville11-10.1-13.6-23.73-8Campbellsville
439Dakota Wesleyan10-2.4-21.5-23.96-4Dakota Wesleyan
440Lebanon Valley105-28.9-23.96-4Lebanon Valley
441Olivet Nazarene11-11.4-12.6-243-8Olivet Nazarene
442Ferrum108.7-33-24.37-3Ferrum
443Gallaudet1012-36.5-24.57-3Gallaudet
444South Dakota Tech11-18.2-6.7-24.92-9South Dakota Tech
445Emory & Henry100.2-25.1-24.96-4Emory & Henry
446Albion105.8-30.8-256-4Albion
447Pikeville11-9.9-15.1-25.13-8Pikeville
448Kentucky St10-15.2-9.9-25.12-8Kentucky St
449Midland U.10-3.9-21.5-25.34-6Midland U.
450Maryville104.4-29.8-25.46-4Maryville
451Ohio Wesleyan109.8-35.3-25.59-1Ohio Wesleyan
452Montclair St10-2.3-23.3-25.65-5Montclair St
453Grove City104.8-30.4-25.66-4Grove City
454Texas College11-13.8-11.8-25.63-8Texas College
455Carroll WI1016.5-42.2-25.88-2Carroll WI
456Washington U.10-1.3-24.6-25.85-5Washington U.
457Webber Int'l10-3.1-22.7-25.84-6Webber Int'l
458Ohio Northern10-1.3-24.6-25.94-6Ohio Northern
459Union KY11-9.1-17-26.14-7Union KY
460St Mary KS113.6-29.7-26.16-5St Mary KS
461Carnegie Mellon113.2-29.3-26.16-5Carnegie Mellon
462Livingstone10-17.9-8.8-26.62-8Livingstone
463Kentucky Wesleyan11-17.4-9.3-26.72-9Kentucky Wesleyan
464Muskingum10-4.3-22.5-26.83-7Muskingum
465New Jersey10-1.3-25.8-27.14-6New Jersey
466Friends113-30.1-27.16-5Friends
467Jamestown10-3.4-23.8-27.24-6Jamestown
468Mount Ida115.7-33-27.38-3Mount Ida
469Virginia-Wise11-14-13.7-27.63-8Virginia-Wise
470McPherson93.8-31.5-27.65-4McPherson
471Illinois College1013.1-40.9-27.88-2Illinois College
472Mass Maritime96.9-34.8-27.95-4Mass Maritime
473Mississippi College10-17.6-10.3-27.92-8Mississippi College
474Wisconsin Lutheran1011.8-39.7-287-3Wisconsin Lutheran
475Bethany WV10-2.5-25.5-283-7Bethany WV
476Concordia WI106.7-34.8-28.17-3Concordia WI
477Central Methodist10-7.3-20.9-28.22-8Central Methodist
478Christopher Newport11-3-25.2-28.26-5Christopher Newport
479Case Western Reserve105.2-33.5-28.36-4Case Western Reserve
480Geneva10-4-24.5-28.53-7Geneva
481Whittier9-0.4-28.4-28.84-5Whittier
482Hartwick10-6-22.9-28.93-7Hartwick
483Macalester1010.8-39.8-296-4Macalester
484Hope10-0.6-28.7-29.35-5Hope
485Buena Vista10-11.9-17.4-29.34-6Buena Vista
486Peru St11-4-25.4-29.45-6Peru St
487Lewis & Clark9-8.1-21.3-29.44-5Lewis & Clark
488Merchant Marine10-7.6-22.1-29.75-5Merchant Marine
489Lake Forest107.3-37-29.78-2Lake Forest
490Coast Guard92.6-32.6-305-4Coast Guard
491Carthage10-12.6-17.7-30.33-7Carthage
492Southern Virginia10-6.6-23.7-30.34-6Southern Virginia
493Kansas Wesleyan11-1-29.4-30.46-5Kansas Wesleyan
494Castleton St111-31.5-30.47-4Castleton St
495Methodist100.5-31.2-30.75-5Methodist
496Juniata10-7.6-23.1-30.73-7Juniata
497Frostburg St10-15.2-15.9-31.13-7Frostburg St
498Curry102-33.1-31.16-4Curry
499St Scholastica119.5-40.7-31.28-3St Scholastica
500St Norbert114.5-35.7-31.38-3St Norbert
501William Paterson10-1.3-30.1-31.45-5William Paterson
502Thiel10-5.1-26.3-31.43-7Thiel
503Westminster PA9-1.7-29.8-31.53-6Westminster PA
504Lincoln PA10-22.1-9.5-31.61-9Lincoln PA
505Hanover106.6-38.3-31.76-4Hanover
506Dickinson10-12-19.9-31.84-6Dickinson
507Graceland11-12.5-19.6-32.15-6Graceland
508Iowa Wesleyan11-12.5-19.7-32.23-8Iowa Wesleyan
509Pace9-31.6-0.8-32.30-9Pace
510Avila11-10-22.5-32.52-9Avila
511Point U.10-14.5-18.2-32.62-8Point U.
512Point U.10-14.5-18.2-32.62-8Point U.
513Carleton10-13.8-19-32.73-7Carleton
514La Verne9-7.9-24.8-32.84-5La Verne
515Northwestern MN1111.6-44.4-32.88-3Northwestern MN
516Worcester St100.8-33.6-32.86-4Worcester St
517Benedictine IL102-34.9-32.95-5Benedictine IL
518Guilford10-5.7-27.4-33.15-5Guilford
519Catholic10-8.3-25.4-33.63-7Catholic
520Waldorf11-8-25.8-33.74-7Waldorf
521Lindenwood-Belleville10-6.3-27.7-344-6Lindenwood-Belleville
522Manchester105.7-39.7-346-4Manchester
523Aurora100.9-35.1-34.25-5Aurora
524Austin10-13.7-20.9-34.62-8Austin
525Oberlin100.4-35-34.64-6Oberlin
526St Lawrence10-17.7-17-34.70-10St Lawrence
527Monmouth IL103.4-38.1-34.75-5Monmouth IL
528SW Assem of God10-4.5-30.4-34.93-7SW Assem of God
529Shenandoah10-10-25-351-9Shenandoah
530Westfield St10-2.9-32.2-353-7Westfield St
531Luther10-16.5-18.6-35.10-10Luther
532Denison10-3.6-31.6-35.24-6Denison
533WPI10-14.1-21.3-35.42-8WPI
534LaGrange10-9.4-26.2-35.63-7LaGrange
535Wilkes10-6.5-29.5-365-5Wilkes
536Chicago10-4.5-31.5-364-6Chicago
537MIT9-4-32.1-36.15-4MIT
538Ave Maria8-17.5-18.7-36.21-7Ave Maria
539Moravian10-15.7-20.6-36.32-8Moravian
540Stevenson10-8.1-28.5-36.62-8Stevenson
541Capital10-15.8-21-36.72-8Capital
542Kalamazoo10-3.7-33.2-36.95-5Kalamazoo
543SUNY-Maritime9-1.1-36.1-37.23-6SUNY-Maritime
544Greenville104.4-42-37.78-2Greenville
545Briar Cliff11-16.5-21.2-37.71-10Briar Cliff
546Kenyon101.4-39.7-38.36-4Kenyon
547Sterling10-8.4-30.2-38.62-8Sterling
548Allegheny10-6.2-32.6-38.85-5Allegheny
549Howard Payne10-23.9-15-38.91-9Howard Payne
550DePauw10-11.6-27.4-392-8DePauw
551Ripon10-0.6-38.6-39.25-5Ripon
552Cornell IA10-2.9-36.3-39.24-6Cornell IA
553North Park10-20-19.3-39.31-9North Park
554North Carolina Wesleyan10-11.1-28.3-39.43-7North Carolina Wesleyan
555Wooster10-6-33.6-39.52-8Wooster
556King's PA10-11.7-27.9-39.62-8King's PA
557Greensboro10-7.7-32.1-39.85-5Greensboro
558Rose-Hulman9-3.4-36.4-39.84-5Rose-Hulman
559Southwestern KS11-7.7-32.2-39.94-7Southwestern KS
560Wayland Baptist9-20.6-19.6-40.12-7Wayland Baptist
561Pomona-Pitzer9-14.6-25.6-40.21-8Pomona-Pitzer
562Dakota St11-14.5-25.8-40.32-9Dakota St
563Bluffton10-2-38.6-40.66-4Bluffton
564Averett10-11.5-29.2-40.71-9Averett
565Culver-Stockton11-23.3-17.7-411-10Culver-Stockton
566McDaniel10-18.8-22.3-41.10-10McDaniel
567Dordt11-20.1-21-41.21-10Dordt
568Mt St Joseph10-1.9-39.4-41.34-6Mt St Joseph
569Western Conn St9-21.3-20.2-41.41-8Western Conn St
570Mayville St9-7-34.6-41.63-6Mayville St
571Bluefield11-26.6-15-41.60-11Bluefield
572Bluefield11-26.6-15-41.60-11Bluefield
573Concordia MI9-30.6-11.3-41.90-9Concordia MI
574Occidental9-17.8-24.3-422-7Occidental
575Hamline10-24.2-18.1-42.31-9Hamline
576Apprentice8-19.8-22.8-42.60-8Apprentice
577Bethany KS11-10.8-32.1-42.93-8Bethany KS
578UMass-Dartmouth10-16.8-26.3-43.11-9UMass-Dartmouth
579Alma10-19.6-23.6-43.21-9Alma
580Puget Sound9-28.3-15.1-43.30-9Puget Sound
581Morrisville St10-19.3-24.2-43.51-9Morrisville St
582St Vincent10-17.6-25.9-43.50-10St Vincent
583Plymouth St10-12-31.8-43.72-8Plymouth St
584Fitchburg St9-15.4-28.8-44.22-7Fitchburg St
585Loras10-21.1-23.5-44.52-8Loras
586Marietta10-23.4-21.6-44.90-10Marietta
587FDU-Florham10-15.2-29.8-452-8FDU-Florham
588Claremont-Mudd-Scripps9-19.3-25.9-45.20-9Claremont-Mudd-Scripps
589Nichols10-18.2-27.8-461-9Nichols
590Grinnell10-9-37.2-46.22-8Grinnell
591Lakeland10-10.4-36.2-46.62-8Lakeland
592Minnesota-Morris10-0.4-46.6-46.96-4Minnesota-Morris
593Defiance10-10.1-37.1-47.12-8Defiance
594Becker9-12.6-34.9-47.62-7Becker
595Westminster MO10-1.5-47.7-49.24-6Westminster MO
596Olivet10-17.6-31.8-49.40-10Olivet
597Eureka10-6.2-43.7-49.94-6Eureka
598Martin Luther10-1.8-48.6-50.44-6Martin Luther
599Wilmington10-28.1-22.3-50.41-9Wilmington
600Knox10-11.6-39-50.52-8Knox
601Lawrence10-14.6-38.3-52.92-8Lawrence
602Husson10-19.2-33.8-52.92-8Husson
603Anna Maria10-15.1-38.5-53.62-8Anna Maria
604Maine Maritime9-23-33.2-56.20-9Maine Maritime
605MacMurray10-14.2-42.4-56.52-8MacMurray
606Rockford10-16.6-40.1-56.72-8Rockford
607Presentation10-12.3-44.6-56.92-8Presentation
608Hiram10-25.5-32.2-57.60-10Hiram
609Crown10-14.8-44-58.82-8Crown
610Misericordia10-34.8-24.2-590-10Misericordia
611Beloit10-20.7-38.4-59.10-10Beloit
612Haskell9-28.4-32-60.41-8Haskell
613Earlham9-22.6-38.2-60.81-8Earlham
614Bethel KS10-34.2-27.4-61.60-10Bethel KS
615Anderson10-26.1-35.5-61.60-10Anderson
616Trinity Bible8-23.4-42-65.41-7Trinity Bible
617Maranatha Baptist10-27-39.4-66.40-10Maranatha Baptist

[continue reading…]

{ 0 comments }

Things are getting ugly in Pittsburgh. Really ugly.

Ben Roethlisberger started the first nine games of the season, but things are getting ugly quickly in Pittsburgh. After suffering a right shoulder injury and bruising his ribs against the Chiefs, Byron Leftwich started last weekend against the Ravens. Leftwich injured his ribs against Baltimore, leaving Pittsburgh to now turn to Charlie Batch against the Browns tomorrow.

When was the last time a team started three different quarterbacks in consecutive games? Three teams last year pulled off that feat. After Jason Campbell started the first six games of the season, Kyle Boller started the next week before the team permanently switched to Carson Palmer.

Matt Schaub was the Texans starting quarterback for ten games, but a foot injury ended his season. Matt Leinart took over, but a broken collarbone ended his season, leaving the reins in the hands of rookie T.J. Yates. In St. Louis, an ankle injury caused Sam Bradford to miss a December game against the 49ers, leaving A.J. Feeley to start. Feely injured his right thumb, but Bradford was back the next week. He would miss the rest of the year due to his ankle, though, and Kellen Clemens started the last three games.

So it’s actually not all that rare for a team to go with three different quarterbacks in three weeks; at some point this season, it’s possible the Cardinals will, as well, with John Skelton, Ryan Lindley, and Kevin Kolb. From 2000 to 2011, teams started three different quarterbacks in consecutive games on 36 different occasions:

TmYearGM#QBQBQB
HOU201110-12Matt SchaubMatt LeinartT.J. Yates
OAK20116-8Jason CampbellKyle BollerCarson Palmer
STL201112-14A.J. FeeleySam BradfordKellen Clemens
CAR20108-10Matt MooreJimmy ClausenBrian St. Pierre
MIA20108-10Chad HenneChad PenningtonTyler Thigpen
MIA20109-11Chad PenningtonTyler ThigpenChad Henne
MIN201013-15Tarvaris JacksonBrett FavreJoe Webb
TEN20109-11Kerry CollinsVince YoungRusty Smith
TEN201010-12Vince YoungRusty SmithKerry Collins
CLE200811-13Brady QuinnDerek AndersonKen Dorsey
KAN20081-3Brodie CroyleDamon HuardTyler Thigpen
KAN20085-7Damon HuardBrodie CroyleTyler Thigpen
SEA20084-6Matt HasselbeckCharlie FryeSeneca Wallace
MIN20077-9Kelly HolcombTarvaris JacksonBrooks Bollinger
STL200711-13Marc BulgerGus FrerotteBrock Berlin
STL200712-14Gus FrerotteBrock BerlinMarc Bulger
NYJ20053-5Chad PenningtonBrooks BollingerVinny Testaverde
PIT20059-11Charlie BatchTommy MaddoxBen Roethlisberger
STL200510-12Marc BulgerJamie MartinRyan Fitzpatrick
SFO20056-8Alex SmithKen DorseyCody Pickett
ARI200411-13Shaun KingJohn NavarreJosh McCown
TAM20044-6Brad JohnsonChris SimmsBrian Griese
TEN200314-16Billy VolekSteve McNairNeil O'Donnell
OAK20037-9Rich GannonMarques TuiasosopoRick Mirer
CAR20026-8Rodney PeeteChris WeinkeRandy Fasani
CAR20027-9Chris WeinkeRandy FasaniRodney Peete
CIN20023-5Gus FrerotteAkili SmithJon Kitna
PHI200210-12Donovan McNabbKoy DetmerA.J. Feeley
STL20024-6Kurt WarnerJamie MartinMarc Bulger
STL200212-14Kurt WarnerJamie MartinMarc Bulger
TAM200214-16Brad JohnsonShaun KingRob Johnson
TAM200215-17Shaun KingRob JohnsonBrad Johnson
WAS20023-5Shane MatthewsDanny WuerffelPatrick Ramsey
DAL20014-6Quincy CarterAnthony WrightClint Stoerner
SDG20003-5Moses MorenoRyan LeafJim Harbaugh
SDG20009-11Jim HarbaughMoses MorenoRyan Leaf

Excluding the 1987 season, the 1974 49ers were the only team since the merger to start four different quarterbacks in four weeks. As you can imagine, their story is interesting. Joe Reed entered the season as the starter, after splitting time with a 38-year-old John Brodie (who retired after the season) and Steve Spurrier (who suffered a severely dislocated shoulder in the final pre-season game in ’74) in 1973. He started the first three games of the year, and played miserably, so the team moved on to Dennis Morrison, who had been a 14th-round draft selection in 1973.

Morrison started the 4th and 5th games of the season for the 49ers, which is when the streak began. Morris started game five in Detroit, but threw three interceptions, so in week 6, the 49ers went back to Reed. Reed went 2/8 for 1 interception and was promptly traded later that week. So in week 7, 13th-round rookie Tom Owen started the game and performed reasonably well, but he was just the interim quarterback. That’s because in connection with the Reed trade, San Francisco acquired Norm Snead from the Giants, who sent Snead to San Francisco after acquiring Craig Morton from Dallas. Injuries and ineffectiveness limited Snead to just that one start for the 49ers in ’74, however, and Owen would go on to play (somewhat competently) for the remainder of the year.

{ 2 comments }

Checkdowns: Best Thanksgiving Performances

Stump your family with some Football Perspective trivia today. The tables below show the leaders in various categories in all games played on Thanksgiving since 1960.

Most passing yards

RkYearTmOppPFPAQBCMPATTPYDTDINT
11998dalmin3646Troy Aikman345745510
21995detmin4438Scott Mitchell304541041
31995mindet3844Warren Moon304738432
42007gnbdet3726Brett Favre314138130
51998mindal4636Randall Cunningham173535941
61997daloti1427Troy Aikman274235623
72010nordal3027Drew Brees233935211
81994detbuf3521Dave Krieg202535130
92009gnbdet3412Aaron Rodgers283934830
102010nwedet4524Tom Brady212734140

Most passing touchdowns

RkYearTmOppPFPAQBCMPATTPYDTDINT
12004cltdet419Peyton Manning232823660
11977miacrd5514Bob Griese152320761
32006daltam3810Tony Romo222930650
31962nyjden4645Johnny Green224629253
51995detmin4438Scott Mitchell304541041
51998mindal4636Randall Cunningham173535941
52010nwedet4524Tom Brady212734140
51987dalmin3844Danny White254134143
51985detnyj3120Eric Hipple192926941
52008phicrd4820Donovan McNabb273926040
51994gnbdal3142Brett Favre274025740
51985dalcrd3517Danny White142623541

[continue reading…]

{ 1 comment }

An interesting story today on Antonio Cromartie, courtesy of Bob Glauber of Newsday. Cromartie says that after Revis was injured, the All-Pro cornerback told Cromartie that he needed to start taking his job more seriously and that it was time for him to reach his potential. Cromartie stated: “Hearing it from your peers, you take more out of that than hearing it from your coach…. Your peers expect so much out of you and expect you to play at a higher level, especially when he’s one of the best corners in the league.”

I’ve been very impressed with Cromartie this season, and Pro Football Focus’ numbers back in up. PFF’s subscriber content ranks Cromartie fourth in pass coverage among cornerbacks this season, behind only Charles Tillman, Casey Hayward, and Richard Sherman. He’s playing as well as I’ve seen him since he’s been a Jet, and he’s changed his demeanor off the field, too.

Your reaction to Cromartie’s comments is essentially a Rorschach test of your views on life. Whether you find it disappointing that this is what it took for the light to go on (and who knows when the bulb will need to be replaced) or inspiring that he was able to elevate his play is left to the reader.

Cromartie realized he had to take on more of a leadership role, and admitted that his level of play leading up to this season wasn’t as proficient as it should have been. It was a startling admission from a player who rarely suffers from a lack of self assurance, yet it was a moment that signaled a major turnaround. Cromartie is indeed playing his best football, and now laments that he didn’t take his craft more seriously before.

“It shouldn’t have taken for Revis to go down for me to be playing at a very high level,” he said. “There’s something I think I took for granted having Revis on the other side and not being able to play at a high level when he was here.”

“I think the biggest thing that’s changed for me is the leadership role,” Cromartie said. “Just making sure everyone was on top of everything, helping guys study film and knowing how to study film. I think I just took on a role that once [Revis] left, and I wanted to make sure I played at a higher level every single week.”

{ 4 comments }

On November 15, 2010, Michael Vick humiliated the Washington Redskins before a national television audience on Monday Night Football. The big news right before kickoff was that the ‘Skins had signed former Eagle QB Donovan McNabb to a five-year, $78 million contract extension, an ironic note that wouldn’t be lost on observers as McNabb’s replacement, Vick, put together one of the greatest all-around quarterbacking performances in NFL history:

DateTm OppResultCmpAttCmp%YdsTDIntRateSkSkYdANYPARushR_YdsR_TD
11/15/2010PHI@WASW 59-28202871.4%33340150.71114.28802

McNabb, on the other hand, was mediocre, going 17-31 with 295 yards and 2 TDs, but also 3 picks. More damning, Washington’s offense produced zero points until the Redskins were in a 35-0 hole and the game was essentially over.

Fast-forward 735 days, though, and the Redskins got their payback. An injured Vick was on the shelf, the Eagles entered the game on a 5-game losing streak, and electrifying rookie Robert Griffin III extended it to six with a brilliant performance of his own:

DateTm OppResultCmpAttCmp%YdsTDIntRateSkSkYdANYPARushR_YdsR_TD
11/18/2012WASPHIW 31-6141593.3%20040158.32816.012840

So, which performance was better, Vick’s original or RGIII’s remix? Vick threw for 133 more yards, rushed for practically the same amount as Griffin (on 4 fewer carries), and produced more total TDs. Then again, Griffin completed 93% of his passes and put together the vaunted 158.3 “perfect” QB rating. It’s a tough call.

Sound off with your opinion below!


{ 9 comments }

Scott Kacsmar posted an interesting article yesterday, noting that teams are punting or kicking on 4th down in 2012 more frequently than at any other time in the last 20 years. So far in 2012, just 1.27% of all plays are 4th down attempts.

Scott also noted that teams have been less aggressive on 4th and 1. I wanted to tweak some of Scott’s cutoffs and see if the results changed. I look at all 4th-and-1s since 2000, but limited the data to just weeks 1-10 and the first three quarters of the game. This year, teams have gone for it 56 times in these situations, gaining a first down 75% of the time.

The table below shows how often teams punted, kicked a field goal, or went for it on 4th and 1. The fifth column shows the conversion rate when teams did choose to try to get the first down, and the next two columns display the run to pass ratio (scrambles are included as runs). The final two columns show the success rates by run and by pass.

YearPuntField GoalGo For ItConv RtRun %Pass %Run ConRtPass ConRt
201254.3%16%29.8%75%76.8%23.2%76.7%69.2%
201148.7%23.3%28%61.9%83.3%16.7%60%71.4%
201050%11.1%38.9%68.3%76.2%23.8%72.9%53.3%
200946.8%10.5%42.6%61.7%76.5%23.5%64.5%52.6%
200847.3%12.1%40.6%70.1%80.6%19.4%74.1%53.8%
200745.3%14.1%40.6%69.6%84.1%15.9%72.4%54.5%
200647.2%18.1%34.7%70.1%74.6%25.4%76%52.9%
200549.1%10.9%40%66.7%84.8%15.2%66.1%70%
200452%12.1%35.8%69.4%83.9%16.1%69.2%70%
200347.7%15.5%36.8%73.7%87.7%12.3%74%71.4%
200248.5%16.8%34.7%69%82.8%17.2%75%40%
200152.1%14.1%33.7%69.1%83.6%16.4%73.9%44.4%
200045.5%21.3%33.1%72.9%81.4%18.6%75%63.6%
Avg48.8%15.1%36.1%69%81%19%71.5%57.9%

It is a bit odd to see that teams seem less willing to try to convert on 4th-and-1 in 2012 than they were a decade ago. Why do you think that is?

{ 13 comments }

When Miami was blown out by Tennessee this weekend, I was shocked. So I cooked up a quick little way to measure how shocked I should have been. First, here are the SRS standings for the NFL through 10 weeks:

RkTeamGMOVSOSSRS
1Houston Texans911.6-0.311.3
2Chicago Bears911.8-0.910.9
3Denver Broncos99.41.310.7
4New England Patriots911.2-0.910.4
5San Francisco 49ers99.20.49.7
6Green Bay Packers95.41.77.1
7Atlanta Falcons98.4-2.36.1
8Seattle Seahawks103.72.15.8
9New York Giants105.105.1
10Baltimore Ravens96.1-2.33.8
11Tampa Bay Buccaneers95.3-2.23.1
12Dallas Cowboys9-0.83.62.8
13Pittsburgh Steelers93.7-3.30.4
14Detroit Lions90.3-0.30.1
15Minnesota Vikings101.1-10.1
16New Orleans Saints9-1.10.5-0.6
17San Diego Chargers92.3-3.4-1.1
18Washington Redskins9-2.10.9-1.2
19Carolina Panthers9-6.24.8-1.5
20St. Louis Rams9-5.84.1-1.7
21Arizona Cardinals9-3.61.6-2
22Cincinnati Bengals9-1.6-1.2-2.8
23Miami Dolphins9-1.1-3.1-4.2
24New York Jets9-6.21.9-4.3
25Indianapolis Colts9-2-3.4-5.4
26Buffalo Bills9-7.21-6.2
27Cleveland Browns9-5-1.3-6.3
28Philadelphia Eagles9-7.61-6.5
29Tennessee Titans10-9.21.6-7.6
30Oakland Raiders9-10-0.7-10.7
31Kansas City Chiefs9-11.9-0.7-12.6
32Jacksonville Jaguars9-13.60.6-13

Now the SRS weighs each game equally. This means that we can come up with a projected game score for each week, and see how close the actual result came to meeting our projection. For this iteration of the SRS, I am not using any caps or floors, and am giving the home team three points.
[continue reading…]

{ 7 comments }
Next Posts Previous Posts