≡ Menu

In week 1, the passing stats were once again remarkable: the league averaged 7.08 ANY/A and produced a passer rating of 100.2.

In week 2, though, things dipped down quite a bit to 5.96 ANY/A and a passer rating of 87.6. There are injuries to be discussed. Sam Darnold is out with mono and didn’t play last night. Nick Foles broke his left clavicle early in week one and is out indefinitely. In week two, two Hall of Fame quarterbacks went down: Ben Roethlisberger is out for the season with an injured right elbow, and Drew Brees is out for two months torn ligament in the thumb on his throwing hand.

There are also the Dolphins to be discussed. Ryan Fitzpatrick and Josh Rosen combined to be terrible: 7 passing first downs, 4 interceptions, and 7 sacks. And Eli Manning, Carson Wentz, and Derek Carr all had ugly weeks, too.

What did help week 2? The reigning MVP of the NFL, Patrick Mahomes. The best player in football put together a 2nd quarter for the ages on Sunday against the Raiders. Mahomes completed 12 of 17 passes, for a remarkable 278 yards (23.2 yards per completion) and 4 touchdowns, with no interceptions or sacks and *ten* first downs. Jimmy Garoppolo and his former mentor Tom Brady both had great weeks, but there’s no question who was the best quarterback in week two.

The table below shows the full passing stats: [continue reading…]

{ 0 comments }

Passing First Down Rate: What’s Average?

In week 1, Russell Wilson completed 70% of his passes, going 14 for 20. But in the modern NFL, completion percentage is meaningless. What really matters is first down percentage. Wilson took 4 sacks, and only 6 of his 14 completed passes picked up a first down. Therefore, Wilson picked up a first down on only 25% of his 24 dropbacks! Passing first down percentage and completion percentage are supposed to measure the same thing — how well an offense can consistently move the ball via the pass — but there can occasionally be a huge chasm between those numbers.

To be sure, passing first down percentage is hardly a perfect stat. Wilson completed an 8-yard pass on a 1st-and-10, a 7-yard pass on a 1st-and-10, and even had an 11-yard completion to Chris Carson that doesn’t get recorded as a first down because Carson fumbled. On the other hand, 5 of his completions were clearly not successful: a -3 yard completion on 2nd-and-long, a 2-yard completion on 3rd-and-17, 5- and 6-yard completions on 3rd-and-9s, and an 11-yard completion on 3rd-and-26.

Using success rate instead of passing first down percentage would be an improvement — you’d move the two long gains on 1st-and-10 into the success range, and say that 8 of his 24 pass plays were successful. And, of course, this isn’t all the quarterback’s fault or blame: it’s not his fault that Carson fumbled, it’s possible some of the 4 sacks weren’t his fault, and almost nobody is completing a 3rd-and-26 (on the other hand, he probably shouldn’t get credit when his receiver makes a great catch, or his offensive line blocks for much longer than average, or his receiver gets wide open, etc.).

So let’s not let the perfect be the enemy of the good: passing first down percentage is much better than completion percentage, and let’s leave it at that. You can view some of the outliers in NFL history in these two stats here.

A year ago, I looked at the relationship between those two statistics, and so I wanted to update that through the 2018 season. [continue reading…]

{ 0 comments }

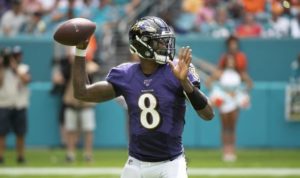
The Game Scripts are back! As a reminder, a Game Script is simply the average score of a game over each second of play during the game. And if you are like me, as you watched the Dolphins/Ravens game unfold, you were wondering what would the final Game Script be from that massive blowout.

The Ravens took a 7-0 lead less than five minutes into the game, and that jumped to 14-0 before the 8-minute mark, 21-0 before the 11-minute mark, and 28-0 after just 16 minutes. Baltimore got the lead up to 42-10 at halftime, and scored three times in the second half to walk away with a 59-10 win. Over the course of the 3,600 seconds of this game, Baltimore’s average lead was 30.0 points.

That’s the best Game Script by a team since this Rams/Raiders blowout in 2014, a 52-0 win that registered a 30.9 Game Script. [continue reading…]

{ 2 comments }

Jackson squished the fish on Sunday

After every week, I post the weekly passing numbers to look at which passers produced the best stats of the week. The formula is pretty simple.

It begins with Adjusted Net Yards per Attempt, which is (Passing Yards + 20*Passing TDs – 45*INTs – Sack Yards Lost) divided by (Pass Attempts + Sacks). Let’s begin with the best passing performance of week one, which belongs to Ravens second-year quarterback Lamar Jackson. Baltimore’s young quarterback went 17/20 for 324 yards with 5 TDs and 0 INTs, while taking 1 sack and losing one yard. That means Jackson had 423 Adjusted Net Yards on 21 dropbacks, or 20.14 Adjusted Net Yards per Attempt.

The NFL as a whole in week 1 averaged 7.08 ANY/A, which sets our baseline for average play. This means Jackson was 13.06 ANY/A above average over 21 dropbacks, which means he produced 274 Adjusted Net Yards of value over average. That, of course, was the most in the NFL.

It also harkens back to one of the greatest performances in NFL history by another Baltimore quarterback: Johnny Unitas. Historians have long regarded Unitas’s game against the 1967 Falcons as one of the best ever, and the stats confirm that.  In a ‘glitch in the matrix’ moment, the old Baltimore QB went 17/20 against the Falcons that day, for 370 yards with 4 TDs and 0 INTs. Both Unitas and now Jackson are part of the extremely rare 20/20 club: averaging 20 Adjusted Net Yards per Attempt on 20+ pass attempts. In fact, Baltimore has been involved in all three games: Unitas against the Falcons in ’67, Jackson against the Dolphins in week 1 of 2019, and what is the greatest statistical game in NFL history: Joe Namath (in a shootout with Unitas) against Baltimore in 1972.

The full week 1 passing stats below: [continue reading…]

{ 0 comments }

The Vikings Win With A Very Odd Gameplan

Minnesota opened its season with two Kirk Cousins pass plays resulting in a touchdown. The Vikings third offensive play of the season was a pass play, as was the team’s fifth.

Opening the season with 4 passing plays on the first 5 plays from scrimmage is hardly unusual.  What is unusual is what happened next.   On the Vikings final 44 plays of the day, Minnesota finished with 7 passing plays and 37 rushing plays!  On a drive against the Saints last season, Kirk Cousins went 8-for-10 with 1 sack and 1 touchdown; for the entire game on Sunday, Kirk Cousins went 8-for-10 with 1 sack and 1 touchdown!

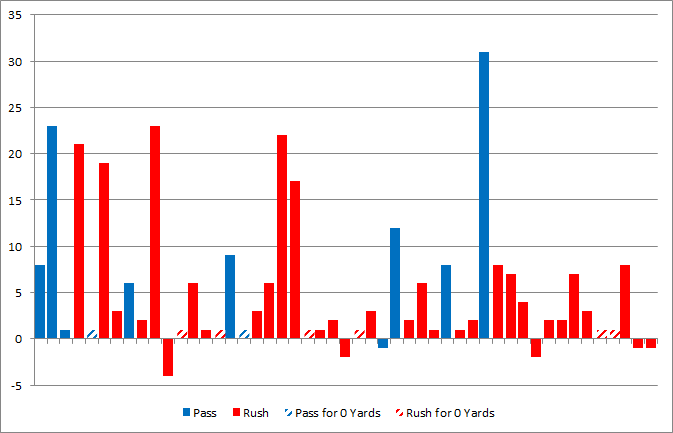
The team ran 49 plays on Sunday in a 28-12 win over the Falcons.  Here are the results of those plays, in order, with pass plays in blue and rushing plays in red.  Also, because plays of 0 yards would otherwise not show up on the graph, I’ve noted them separately as 1-yard plays with diagonal shading.

The Vikings did not attempt a pass in the 4th quarter of the game, which is the sort of thing you can do when you lead 28-0 after three quarters.  Still, this was remarkable: the Vikings passed on just 22% of all plays. [continue reading…]

{ 0 comments }

Do Running Backs Matter?

Seth Keysor highlights one of the great debates of football twitter in 2019 with four words, and then a bit wordier summary:

Running backs don’t matter.

Everyone who follows football closely has heard that statement or some version of it over the past few years. It’s an exaggerated claim that actually means something closer to this: Not only is running the ball much less important than passing the ball, but running back production is also so dependent on the blocking and offensive scheme that the ability of an individual running back doesn’t move the needle as much as other skill positions like quarterback, wide receiver and tight end. That’s a lot wordier than “running backs don’t matter,” though.

Whether running backs matter much is a difficult question to answer, but I think there’s one thing we can all agree on: they are much more important in fantasy football than real football. On the other hand, we should be careful not to go too far in the other direction and say that running backs don’t matter at all.

Let’s suppose that we think offense, defense, and special teams are worth 4 parts, 3 parts, and 1 part of a team. This makes the 11 starting players on offense worth 50% of the team. We don’t quite know how valuable a quarterback is, but let’s conservatively suggest that they’re worth double the average offensive player. That would make the quarterback position worth 8.3% of the team, leaving 41.7% for the other 10 offensive players (and they’re backups). If you think the quarterback is worth more than that, than there would be an even smaller pie for the rest of the offense. [continue reading…]

{ 0 comments }

In this series, I will be looking at the history of coaches, quarterbacks, rushers, and receivers for all 32 franchises. For coaches and quarterbacks, I will be looking at how much their franchise’s career records (regular season only) would change if we removed the games with that person. For rushers and receivers, I will note how many times that player was the team’s leading rusher/receiver over the course of their time with that franchise (regular plus postseason).

Teams:

AFC East: Dolphins, Bills, Jets, and Patriots
NFC East: Cowboys, Eagles, Giants, and Redskins
AFC North: Steelers, Browns, Ravens, and Bengals
NFC North: Packers, Vikings, Bears, and Lions
AFC South: Jaguars, Colts, Texans, and Titans
NFC South: Panthers, Falcons, Saints, and Buccaneers
AFC West: Raiders, Chiefs, Chargers, and Broncos
NFC West: Seahawks, Rams, 49ers, and Cardinals
[continue reading…]

{ 0 comments }

On January 3, 2019, the St. Louis Blues had the worst record in the NHL. But by the end of the year, the Blues had captured their first championship. There is no similar success story in NFL history, but I was curious: which Super Bowl champion had the worst record after X games, for all X?

There have been 9 Super Bowl champions that began the year 0-1. That is not a very big hole from which to escape. But only three teams — the 1993 Cowboys, the 2001 Patriots, and the 2007 Giants — have won the Lombardi Trophy after an 0-2 start. And in the first two cases, it’s noteworthy that Emmitt Smith and Tom Brady were not part of that 0-2 start, but entered the starting lineup in week 3.

What about the worst team after 3 games to win a Super Bowl? 5 teams have begun the season with a 1-2 mark; the three teams mentioned above, along with the 1981 49ers and the 2018 Patriots.

After 4 games? Just one team has started 1-3 and won the Super Bowl: the 2001 Patriots.

After 5 games? Two teams have started 2-3 and won the Super Bowl: the 2001 Patriots and the 1980 Raiders.

After 6 games? No team has been 2-4, with the ’01 Patriots, ’80 Raiders, and the 2010 Packers.

After 7 games? Only team, the 2001 Patriots, had a losing record at 3-4 after 7 games.

After 8 games? Only the 2001 Patriots were 4-4 after 8 games; the other 52 Super Bowl champions had a winning record at this point in the season.

After 9 games? No team had a losing record and won the Super Bowl; in addition to the ’01 Patriots, the ’00 Ravens were the only other team at 5-4 after 9 games that won it all in the Super Bowl era (the ’57 Lions also pulled off this feat).

After 10 games? Yes, once again, we have a field of one: the 2001 Patriots are the only team without a winning record after 10 games, as New England began this season 0-2, 1-3, 3-4, and 5-5. That was the team’s last loss of the season.

After 11 games? Three teams started 6-5: the ’88 49ers, ’01 Patriots, and a new entry: the ’11 Giants.

After 12 games? Just one Super Bowl champion, the 2011 Giants, failed to have a winning record at this point in the season.

After 13 games? The 2011 Giants, at 7-6, are the lone entry here.

After 14 games? The 2011 Giants were 7-7! Only one other team, the 2010 Packers at 8-6, had even 6 losses after 14 games.

The 2011 Giants were the only team to win the Super Bowl with 7 losses, so they are the Super Bowl champion with the worst record after 15 and 16 games, too.

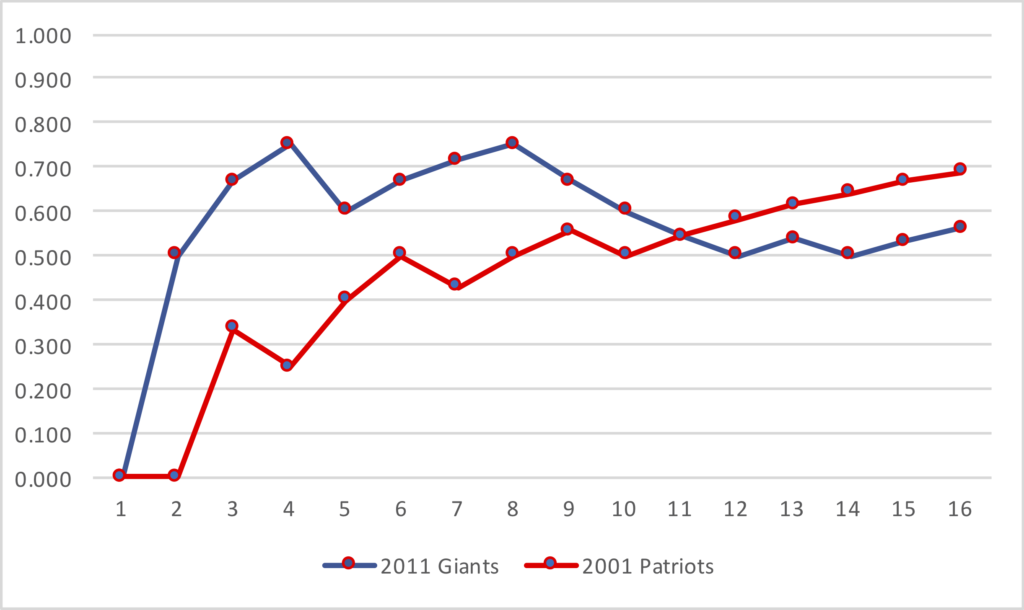
So the Patriots had the single worst record, either alone or tied with other teams, of any Super Bowl champion through X games, for all values of X from 1 to 11. At 6-5, the 2011 Giants were tied with the Patriots (and ’88 49ers) for worst record, and the 2011 Giants hold the mark for worst record of any Super Bowl champion through X games, for all values of X from 11 to 16. The graph below shows the winning percentages of both teams after each game of the regular season.
What do you think?

{ 0 comments }

AFC West Champion History: A Tale of Parity

Like the AFC East, the AFC West has been home to some of the best quarterbacks in NFL history. You know that the Broncos have been fortunate to have John Elway and Peyton Manning bring home 11 division titles, and that the Chargers have 7 from Philip Rivers and Dan Fouts. For Oakland, Daryle Lamonica (5), Ken Stabler (4), Rich Gannon (3) and Jim Plunkett (2) have led them to division crowns, But don’t forget that Joe Montana and Drew Brees have led AFC West teams to division titles.

In the early AFL days, it was Jack Kemp, Len Dawson, John Hadl and Tobin Rote bringing home division crowns. The AFL / AFC West has always been a remarkably competitive division, with the Raiders, Chiefs, Broncos, and Chargers always fighting for division superiority. And two times, it was the Seahawks — behind Dave Krieg in ’88 and Jon Kitna in ’98 — winning the division.

The graph below shows the AFL / AFC West division winner in each year since 1960. [continue reading…]

{ 0 comments }

When the Giants traded Odell Beckham to the Browns, I noted how rare it was for young, talented wide receivers to change teams. Over the last couple of weeks, I’ve calculated the fantasy value – as measured by VBD – of every player since 1970.

The graph below shows all WRs to enter the league since 1970 and produce at least 200 points of VBD. The X-Axis shows the year that player switched teams for the first time. The Y-Axis shows how much VBD they had in their career prior to switching teams.

As you can see, OBJ is a bit of an outlier when it comes to being both very good with his first team and leaving his first team at a young age.

The table below shows the 95 wide receivers with 200+ points of VBD since 1970. Here’s how to read the table below. John Jefferson played from 1978 to 1985, and was 25 years old when he first switched teams. He had a whopping 318 points of VBD with his first team, and 320 points of career VBD through age 26.

Wide ReceiverFirst YrLast YrAge When Switching TeamsVBD With 1st TeamCareer VBD Thru 26
Andre Rison19892000230384
Ken Burrough1970198123037
John Jefferson1978198525318320
Wes Chandler197819882590365
Cris Carter19872002251035
Ahmad Rashad197219822511
Reggie Rucker1970198125070
Brandon Marshall2006201826220242
Santana Moss200120142668156
Wes Welker2004201526061
Keenan McCardell1992200726020
Odell Beckham2014201827392392
Charlie Brown1982198727209209
Terance Mathis199020022700
Randy Moss1998201228689648
DeSean Jackson2008201828185120
Keyshawn Johnson1996200628146103
Joe Horn199620072800
Anthony Miller1988199729237115
Darrell Jackson2000200829210135
Joey Galloway1995201029196157
Vincent Jackson200520162913396
Drew Hill197919932900
Anquan Boldin2003201630408223
Carl Pickens1992200030313292
Antonio Freeman1995200330312261
Greg Jennings2006201530266141
Louis Lipps1984199230209176
J.T. Smith197819903000
Terrell Owens199620103155996
James Lofton1978199331510303
Gary Clark1985199531455186
Ernest Givins1986199531264168
Bob Chandler197119823121071
Derrick Mason19972011312043
Irving Fryar19842000314715
Mark Clayton1983199332518281
Muhsin Muhammad199620093224467
T.J. Houshmandzadeh20012011322150
Haywood Jeffires198719963220153
Torry Holt1999200933635192
Chad Johnson2001201133469183
Jordy Nelson200820183336187
Henry Ellard19831998333009
Eric Moulds199620073324990
Andre Johnson2003201634573134
Roy Green1979199234373143
Anthony Carter198519953422835
Harold Carmichael1971198435553245
Steve Smith2001201635498188
Stanley Morgan1977199035346184
Isaac Bruce1994200936560268
Andre Reed1985200036459212
Art Monk198019953742257
Tim Brown198820043859719
Jerry Rice19852004391636446
Marvin Harrison19962008na94143
Steve Largent19761989na810321
Antonio Brown20102018na724247
Larry Fitzgerald20042018na687424
Calvin Johnson20072015na683350
Sterling Sharpe19881994na574183
Julio Jones20112018na571342
Michael Irvin19881999na563211
Cliff Branch19721985na527149
Reggie Wayne20012014na50977
Herman Moore19912002na499321
Jimmy Smith19922005na4750
Rod Smith19952006na4620
A.J. Green20112018na423248
John Stallworth19741987na422117
Roddy White20052015na41934
Hines Ward19982011na405133
Mike Quick19821990na389280
Wesley Walker19771989na382176
Demaryius Thomas20102018na370194
DeAndre Hopkins20132018na362362
Tony Hill19771986na350197
Marques Colston20062015na337185
Dwight Clark19791987na332301
Drew Pearson19731983na331264
Sammy White19761985na331239
Mel Gray19711982na33099
Dez Bryant20102017na326302
Mark Duper19821992na314152
Cris Collinsworth19811988na296243
Lynn Swann19741982na295235
Isaac Curtis19731984na282274
Nat Moore19741986na279212
Alfred Jenkins19751983na270107
Steve Watson19791987na249180
Donald Driver19992012na2470
Mike Evans20142018na242242
Davante Adams20142018na213213
Al Toon19851992na213188

As for Beckham, he ranks 4th in career VBD through age 26 among all wide receivers to enter the NFL since 1970. The top three? Randy Moss, Jerry Rice, and Larry Fitzgerald.

{ 0 comments }

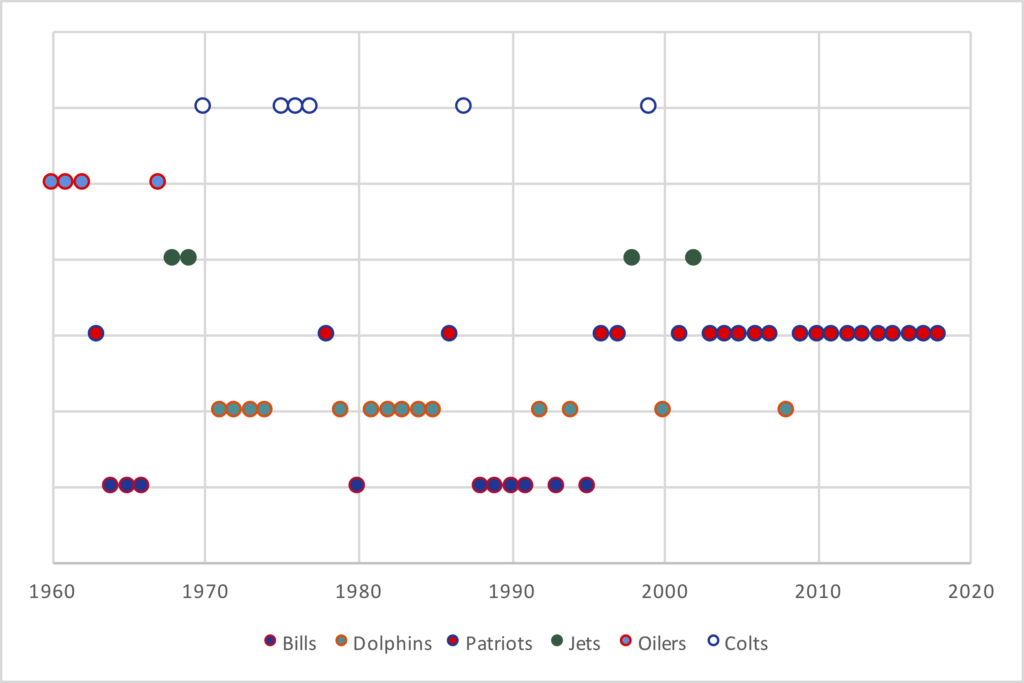
The AFC/AFL East has been around since 1960. Since that time, the Patriots (21) and Dolphins (14) have won the majority of division titles, while the Jets are behind one team no longer in the division and one team that hasn’t been in the division since the merger.

The graph below shows the winner of the AFC/AFL East in each year of existence.

[continue reading…]

{ 0 comments }

In 1998, Glenn Foley started the season as the Jets quarterback. He went 0-3 but was replaced by Vinny Testaverde, who went 12-1 as a starter that year. Testaverde led the Jets to an AFC East Division title that season.

In 2002, Testaverde had switched roles. He began the season as New York’s starter, but went 1-3, and was replaced by a young Chad Pennington. In his first year as a starter, Pennington led the NFL in completion percentage, touchdown percentage, and passer rating, and led New York to an 8-4 record. That included a win over the Patriots … in New England… on Sunday Night Football in week 16, that meant neither New England nor New York would control their own destiny for the playoffs. Entering week 17, Miami was 9-6, with the Jets and Patriots at both 8-7; Miami would win the division with a win over New England in week 17, New England would win the division with a win over Miami and a Jets loss to Green Bay, and New York would win with a win over the Packers and a Dolphins loss to New England.

Miami led 24-13 over the Patriots with 4 minutes to go, but New England completed a wild comeback to force overtime. The Patriots ultimately won, 27-24, and the stadium full of Jets fans erupted when news was blasted on the big screen. New York routed the Packers, giving the Jets the AFC East.

Why such lengthy descriptions about a pair of division titles? Because those are the only two times the Jets have ever won the AFC East. In 1968 and 1969, Joe Namath led the Jets to division titles over the Bills, Dolphins, Patriots, and Oilers to capture the AFL East crown, in those final two seasons prior to the merger.

But that’s it. In 59 seasons, the Jets have won just 4 division titles. How bad is that? Well, consider the following. For the first 6 seasons of the Jets franchise, they played in a 4-team division in the AFL East. The last 17 years, the Jets have played in the 4-team AFC East. So for 23 seasons, the Jets — if all teams were average — would have a 25% chance of winning the division. That would mean we would have expected New York to win 5.75 division titles those years. And for the 36 years from 1966 to 2001, the Jets played in a 5-team division, so you would expect 7.2 division titles with a 20% chance each season.

So over the 59 seasons, you would expect an average team in the Jets position to win 12.95 division titles. Instead, the Jets won 4, just 31% as many division titles as you would expect. That’s the fewest of any team.

The table below shows the results for every team in the NFL. The Cowbyos were in 7- and 8-team divisions for a couple of years, but like the Jets, entered the NFL in 1960. Dallas, like the Jets, was in a 5-team division from 1970 to 2001, and a 4-team division since; as a result, the Cowboys would be “expected” to have 12.38 division titles, with that number slightly lower than New York due to those early years in big divisions. In reality, Dallas has won 24 division titles, or 194% relative to expectation. That’s the most of any team. [continue reading…]

{ 2 comments }

Oldest Fantasy Players Since 1970, By Year

The table below shows the oldest QB, RB, WR, and TE in the NFL each season that ranked at least (i) in the top 30, for quarterbacks and tight ends, (ii) in the top 50, for running backs ,or (iii) in the top 70, for wide receivers.

The age is the player’s age as of September of the season in question. So last year, a 41.1-year-old Tom Brady was the oldest quarterback, Frank Gore at 35.3 years was the oldest running back,Larry Fitzgerald (35) was the oldest wide receiver, and a 38.2-year-old Antonio Gates was the oldest tight end. [continue reading…]

{ 0 comments }

There were only 2,214 punts last season, an average of just 4.32 per team game. That number is low, and it’s really low considering the low number of turnovers. Meanwhile, NFL teams scored 1,286 rushing or passing touchdowns last season and kicked 947 field goal attempts, meaning there were a total of 2,233 drives last year that ended in a touchdown or a field goal attempt.

You won’t be surprised to know that offensive production is on the way up, and we’ve long known that turnover rates are declining, scoring is up, and punting is down. But the 2018 season became the first since the merger with more drives ending on a scoring play or potential scoring play than on a punt.

The graph below shows the number of punts per team game, and the number of combined touchdowns and field goal attempts per team game, for each season since 1970. [continue reading…]

{ 1 comment }

NFL Players, Ironically, Don’t Begin On Sunday

There were over 11,000 players drafted from 1970 to 2018. You might think that those players were evenly distributed in terms of what day of the week they were born. For example, 1 out of every 6.9 were born on Monday, which is pretty close to what you would get by random chance. And 1 out of every 6.9 players were born on Tuesdays and Saturdays, respectively, too. In between those days, 1 out of every 6.7 or 6.8 NFL players were born on a Wednesday, Thursday, or Friday. All pretty even, until we get to the day dominated by pro football: only one out of every 8.2 NFL babies were born on a Sunday.

The graph below shows, for all NFL players drafted from ’70 to ’18 on whom I have birth data (generally those who actually made it to the NFL), how many were born on each day. As you can see, Sunday is a huge outlier. [continue reading…]

{ 0 comments }

When Are NFL Players Born?

Yesterday, I looked at the day on the calendar when players in the 2018 NFL season were born. To do this, I looked at birth rates in 31-day increments. The days from late July to mid August produced a lot of NFL players, while the Geminis of the world — those born from in the window from late May to late June — produced comparably few NFL players.

We also looked at how this compared to the United States as a whole, which tends to have more kids in the summer and few in the winter. In that respect, the Leos of the world — born from late July to late August — didn’t stand out quite as much. June babies, though, looked really low, while January/February seemed to produce more NFL players than you would expect (those are low birth rates for the United States).

Today, let’s examine all players to enter and play in an NFL game since 1970. Once again, we are looking at 31-day periods. Now, that Tom Brady peak has disappeared, and it is players born on or around February 25th that produce the most players. There is another peak in early September, and September 8th is the birthday of the most NFL players since 1970. [continue reading…]

{ 0 comments }

Winston has been a national name for a long time.

Jameis Winston and Carson Wentz provide an interesting pair of quarterbacks to evaluate by age. Winston was the first pick in the 2015 Draft, while Wentz was the second pick in the 2016 Draft. And yet Winston is actually one year younger than Wentz, meaning he entered the NFL at an age two years younger than the Eagles star.

It actually becomes more confusing if you look at their ages on Pro-Football-Reference, since that page makes Wentz looks three years older. That’s because Wentz was born at the end of the year (12/30/1992) while Winston was born at the beginning of the year (1/6/1994). So in 2018, PFR lists Wentz at 26 years old, the age he was for just the last two days of the calendar year; meanwhile, Winston is listed at 24, even though he turned 25 just days after the season ended.

Wentz was born 372 days before Winston, making him almost exactly one year older. If we want to compare their seasons by age, we shouldn’t use age as of 12/31, which is an arbitrary cut-off that masks the real age difference between the two quarterbacks. Instead, we should use each passer’s age at the start of each football season. And, you will soon see, Winston has been the better quarterback for 5 of those 6 ages, beginning when both players entered college.

[continue reading…]

{ 0 comments }

Passing Offense vs. Passing Defense

How consistent are passing offenses from year to year? What about passing defenses?

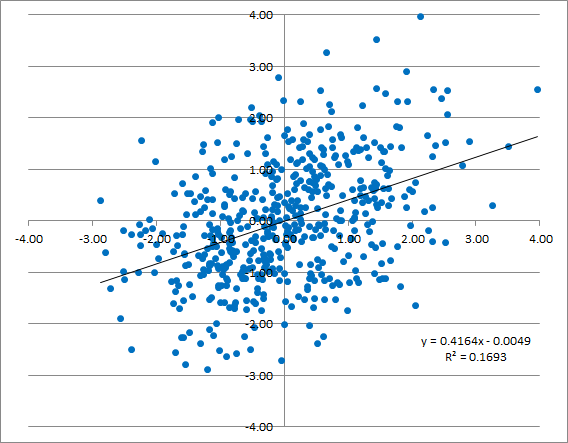
To measure this, I looked at all teams from 2002 to 2017 and measured how effective their passing attacks were by Adjusted Net Yards per Attempt relative to league average. So the best passing offense by this measure was the 2004 Colts, who were +3.97 ANY/A better than average. The next year, Indianapolis was 2.55 ANY/A better than average. In the graph below, I have shown every team during this era, with their Relative ANY/A on the X-Axis and their Relative ANY/A the next season on the Y-Axis.

[continue reading…]

{ 0 comments }

The 2018 Bucs led the NFL in passing first downs and passing first down percentage for the second straight year. For the most part, passing first down percentage tells the story of how successful a team will be.

Passing first down percentage is defined as passing first downs divided by total team pass attempts (which includes sacks). The Bucs led the NFL at 39.8%, and were followed closely by four 12+ wins teams: the Rams (39.3%), Chiefs (39.2%), Chargers (39.0%), and Saints (39.0%). The bottom 8 teams in passing first down percentage all lost at least 9 games, with the Cardinals (25.0%), Bills (25.4%), Jaguars (27.8%), Jets (28.0%), and Redskins (28.2%) in the bottom five.

But Tampa Bay still went 5-11, because despite being outstanding at picking up first downs through the air, the Bucs had three problems:

  • Tampa Bay had 35 turnovers, the most in the NFL.
  • The Bucs running backs were very bad: they had 296 carries for just 1,049 yards (3.5 YPC) and picked up only 50 first downs. The 1,049 yards and 50 first downs were the fewest in the NFL by any set of running backs.
  • Tampa Bay’s pass defense was also atrocious, which is the point of today’s post.

The Bucs pass defense allowed first downs on 36.5% of all passing plays, which was the worst rate in the NFL. And like most of the teams at the bottom of the list that didn’t have an MVP caliber quarterback, they were unsuccessful last year. [continue reading…]

{ 0 comments }

Hilton was #1 last year

Yesterday, I wrote a bit about Bills WR Robert Foster, who had a remarkable season for any rookie, let alone an undrafted free agent. While Foster’s traditional stats were solid — 544 receiving yards, with 511 of them coming in the final 7 games — his rate statistics were out of this world. I am always skeptical of using yards per target as a metric of value because targets are an inherently good thing. That said, it can be fun to look at metrics that don’t always measure pure value, and let’s do that today.

In 2018, Foster averaged 12.30 yards per target, thanks to those 541 yards coming on just 44 targets. Last season, all players in the NFL averaged 7.59 yards per target, which means Foster was well above-average. But his performance is even better when you remember that he was on the Bills, playing with below-average passers. Buffalo players averaged just 6.42 yards per target last season, well below the league average.

But wait: that number is juiced because, well, of Foster. Bills players other than Foster averaged just 5.83 yards per target. Therefore, we could say that Foster averaged 6.47 more yards per target than all other Buffalo players.

Of course, some of that value is mitigated by him having just 44 targets, but if we multiply 44 by 6.47, we could say that Foster added 285 yards of value on targets over the average Bills receiver. But we need some context for what that means, so let’s look at T.Y. Hilton.

The Colts star had 1,270 receiving yards on just 120 targets, which means he averaged an impressive 10.58 yards per target. All other Colts players averaged just 6.47 yards per target last year, which of course is pretty awful (sidenote: Indianapolis had a pretty awful set of weapons outside of Hilton). This means Hilton averaged 4.11 more yards/target than his Colts teammates, and produced 494 yards of value over the average Indianapolis receiver.

Hilton wasn’t chosen at random. By this measure — which I have used before — Hilton produced the most value in the NFL last year relative to his teammates. The table below shows the top 50 players by this metric. Let’s use Tyler Lockett, who ranked 2nd by this metric as an example. Last year, Lockett had 965 receiving yards on just 70 targets, a whopping 13.79 yards/target average. His Seahawks teammates averaged 7.52 yards per target, meaning Lockett was 6.26 Y/T ahead of his teammates. Multiply that difference by his 70 targets, and Lockett produced 438 yards of value over his teammates. [continue reading…]

{ 0 comments }

Through 9 weeks of the 2018 season, the Bills looked like one of the worst passing teams of the modern era.  Buffalo ranked last — by a lot — in most major passing categories.

  • Buffalo’s passer rating was 51.5; Arizona ranked 31st at 67.5.
  • Buffalo ranked 32nd in Net Yards per Attempt at 4.2; Arizona ranked 31st at 4.9, Cleveland was 30th at 5.2, and every other team was at 5.7 or better.
  • Buffalo had 3 TD passes and 16 INTs, by far the worst TD/INT ratio in the league. Arizona had the second-worst at 7 TDs and 10 INTs.
  • Buffalo ranked 31st in yards per completion, at just 9.9 (the Colts were at 9.7).

But over the last 8 weeks of the season — and admittedly I am using multiple endpoints here to make a point — things changed significantly. From week 10 through the end of the season, the Bills ranked:

  • 28th in passer rating, which while not very good, was a much better 78.0.
  • 12th in Net Yards per Attempt, at an above-average 6.6.
  • Had a TD/INT ratio of 10/7.
  • 1st (!) in yards per completion, at 13.5.

In case it wasn’t obvious by those four numbers, much of the improvement in pass efficiency was driven by Buffalo’s huge jump in yards per completion. And much of that improvement was due to the breakout performance by Robert Foster.  The rookie wideout had just two receptions for 30 yards through week 9, but in the team’s final 7 games, he had 25 catches for 511 yards, a 20.4 YPC average. Foster was an undrafted rookie out of Alabama who had just 389 yards in four seasons with the Crimson Tide, but like most players from Tuscaloosa, he profiled as a player with great athleticism.  And, of course, some of Buffalo’s improvement comes from how the men under center changed over the course of the season.

The graph below shows the Adjusted Net Yards per Attempt produced by the Bills in each game in 2018. The black line shows the league average ANY/A of 6.32. The Bills were really bad through week 9, as we showed above, but then rebounded significantly the rest of the way.  The X-Axis shows game number, and the Y-Axis shows ANY/A:

So let’s get to the quarterbacks. Josh Allen, Nathan Peterman, Derek Anderson, and Matt Barkley all started games for the Bills last season.

Peterman started game 1, threw 12 passes in game 6 (relieving an injured Allen), and started game 9.

Allen threw 15 passes in game 1, started games 2 through 6, missed the next four games with an injured elbow, and then started games 11 through 16.

Anderson started games 7 and 8 in relief of an injured Allen, before a concussion re-opened the door for Peterman.

Barkley was the quarterback for the team’s 10th game — a win over the Jets that was arguably Buffalo’s best passing game of the season. Despite the sparkling performance, after that game, Allen returned as the team’s starter for the remainder of the year. And while Allen’s full-season numbers were underwhelming, his statistics improved significantly as the season went on. And how much of that was due to Allen — and how much is due to Foster — is also worth asking.

Allen averaged 6.5 yards per attempt last season, which is really bad (it landed him in the bottom three with Joe Flacco and fellow rookie Josh Rosen).  On targeted passes (i.e., excluding throwaways and spikes), he averaged 6.7 yards per attempt.  But Allen averaged 10.9 yards per attempt on passes targeted to Foster and 6.1 yards per attempt on passes targeted to all other Bills.  For Buffalo fans, it may not really matter, and the optimistic spin is that the future is very bright: these two rookies from 2018 may well lead the next great passing attack in western New York.

{ 0 comments }

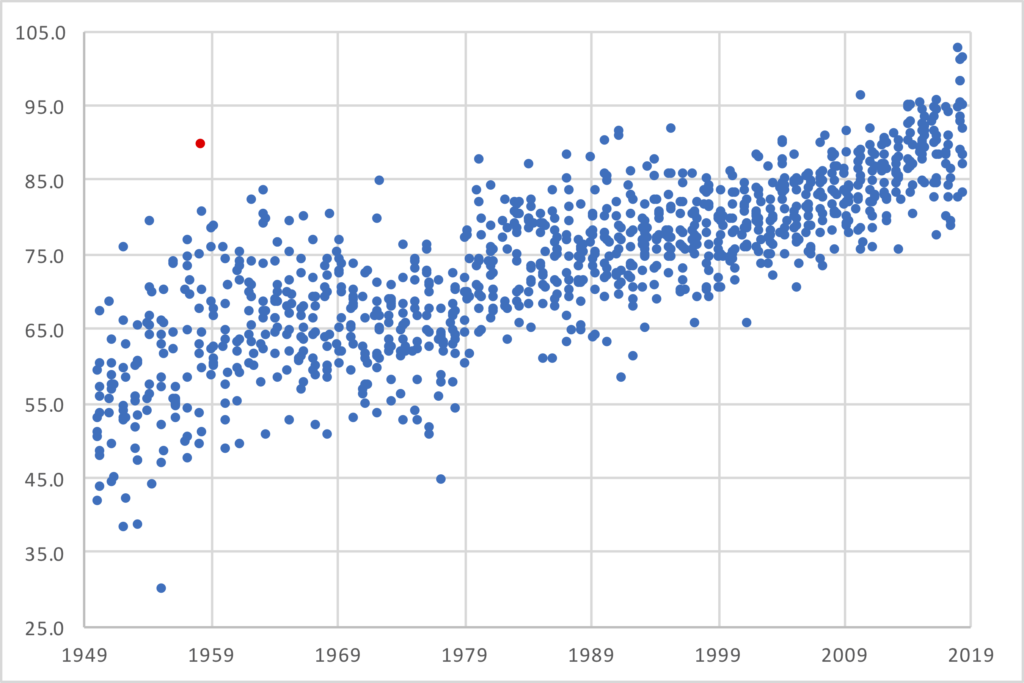
The graph below shows the passer rating in every week of every NFL season since 1950. The red dot at the top left? That’s the passer rating from week 7, 1958, when six games all took place on Sunday, November 9th.

November 9th, 1958 should be remembered as the greatest passing day of the NFL’s first 50 years. It was a star-studded day with names even modern fans will recognize. Two of the best quarterbacks of the 1960s, Bart Starr and Norm Van Brocklin, were starters that day, while the 49ers saw both future MVP John Brodie and Hall of Famer Y.A. Tittle take the field. And all four lost. [continue reading…]

{ 1 comment }

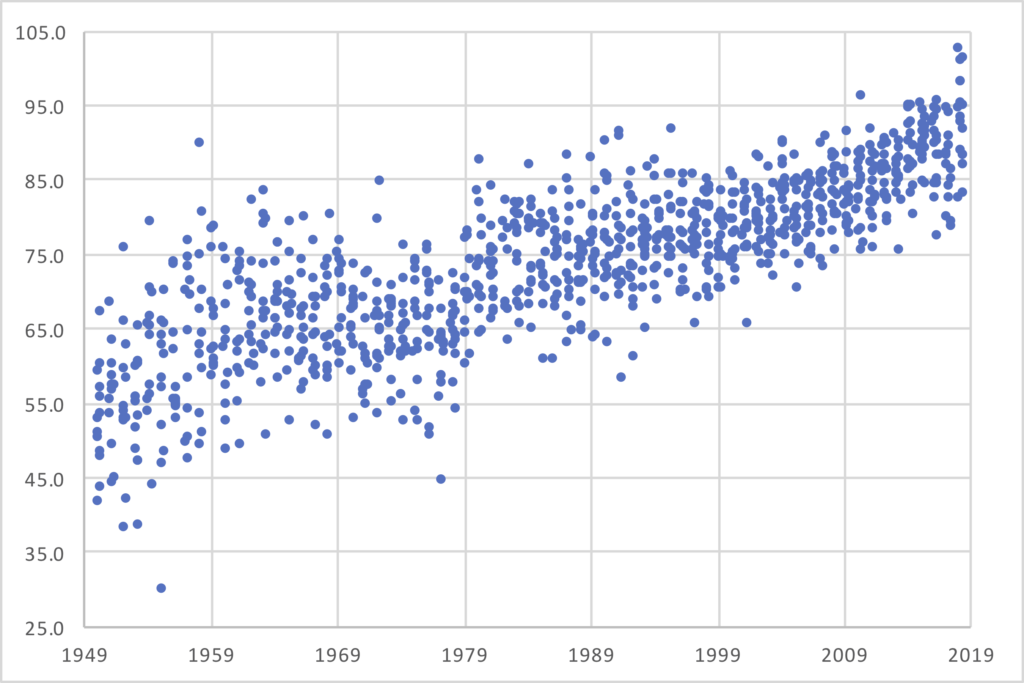
Prior to the 2018 season, there had never been a week in the NFL where at least 5 games were played and the league as a whole had a passer rating of 97.0. In week 2 of the 2018 season, the league-wide passer rating was 102.6. In week 4, it was 98.2. In week 8, it was 98.0. In week 10, it was 100.9. In week 12 it was 101.2.

The graph below shows the passer rating of every week in the NFL since 1950, shown chronologically along the X-Axis, where at least five games were played:

[continue reading…]

{ 0 comments }

Is Winning In Close Games Sustainable?

In 2017, the Carolina Panthers went 11-5, thanks largely to a 7-1 record in games decided by 7 or fewer points. This means that in non-close games, Carolina went 4-4.

In 2018, Carolina was even better in non-close games, going 5-2. But the Panthers didn’t replicate their close-game success; in fact, the Panthers luck swung wildly in a different direction, going just 2-7 in close games.  This has actually been a trend of the Ron RiveraCam Newton Panthers.  The duo got off to a very rocky start, going 1-5 (0.167) in close games in their first year together in 2011, and then 1-7 (0.125) in close games in 2012.  After that season, I wrote that Carolina looked like a team on the rise that would probably start experiencing good luck soon.  That turned out to be one of my most accurate predictions, as in close games, Carolina went 5-2 (0.714) in 2013, 4-2-1 (0.643) in 2014, and then 6-1 (0.857) in 2015.  The Panthers then swung the other way, going 2-6 (0.250) in 2016, then up to 7-1 (0.875) in 2017, and back down to 2-7 (0.222) in 2018. [continue reading…]

{ 1 comment }

It’s time for a topical post here at Football Perspective, so let’s look at the careers of Roman Gabriel and Ken Stabler. Both were very good quarterbacks for a long time, and occasionally great quarterbacks for stretches. When they retired, each was a borderline HOF candidate. Statistically, Gabriel had the better career, including posting an ever-so-slightly better era-adjusted passer rating. Both are safely in the top-50 quarterbacks of all time, and while Stabler (who won a Super Bowl) is in the Hall of Fame, Gabriel probably was the better quarterback on a consistent basis.

But that’s not what I want to discuss today, because it’s not that interesting whether you have Gabriel at 28 and Stabler at 35 on your all time list, or vice versa. What *is* interesting is how they are two of the biggest outliers in two metrics that often go together. [continue reading…]

{ 0 comments }

I originally wanted to write today about the Dallas Cowboys, and whether them being labeled America’s Team was reflected in their appearances on Monday Night Football. The Cowboys have been on MNF a whopping 83 times since the program began in 1970, just one behind the Miami Dolphins for the most in the NFL. The 49ers, Broncos, Redskins, Steelers, and Bears all have between 70 and 75 appearances, too.

Then I wondered: do the Cowboys usually play at home or on the road on MNF? As it turns out, it’s usually on the road. Dallas has played 43 road games on Monday Night Football, as have the Raiders, two teams that NFL fans love to hate. But it’s the New York Giants that have the most road games on Mondays with a whopping 47. That stands in stark contrast to just the 19 home games the Giants have had on Monday nights. The table below shows the MNF data for all 32 teams. The Giants have played, on average, 0.57 more road games than home games per season on MNF, easily the most in the league. Meanwhile, the Dolphins — perhaps because Miami is a good location for a night game — have played 0.57 more home MNF games per season than road MNF games.

[continue reading…]

{ 1 comment }

On Monday, I posted the implied SRS ratings from the Vegas lines released last week covering the first 240 games of the season. And, as discussed, the Oakland Raiders have the toughest schedule in the league, by virtue of competing in the AFC West with two elite teams, and facing the tough AFC South and NFC North Divisions. The table below shows each team’s SOS for all 16 games in 2018:

RkTeamSOSDivisionOpp Divisions
1Oakland Raiders0.9AFC WestAFCS; NFCN
2Denver Broncos0.7AFC WestAFCS; NFCN
3Houston Texans0.6AFC SouthAFCW; NFCS
4Atlanta Falcons0.6NFC SouthNFCW; AFCS
5Chicago Bears0.5NFC NorthNFCNE; AFCW
6Tampa Bay Buccaneers0.5NFC SouthNFCW; AFCS
7Arizona Cardinals0.4NFC WestNFCS; AFCN
8Tennessee Titans0.4AFC SouthAFCW; NFCS
9Jacksonville Jaguars0.4AFC SouthAFCW; NFCS
10Minnesota Vikings0.3NFC NorthNFCNE; AFCW
11Los Angeles Chargers0.3AFC WestAFCS; NFCN
12Detroit Lions0.2NFC NorthNFCNE; AFCW
13Kansas City Chiefs0.2AFC WestAFCS; NFCN
14Carolina Panthers0.1NFC SouthNFCW; AFCS
15Seattle Seahawks0.1NFC WestNFCS; AFCN
16San Francisco 49ers0.1NFC WestNFCS; AFCN
17Green Bay Packers0.1NFC NorthNFCNE; AFCW
18Miami Dolphins0AFC EastAFCN; NFCE
19New Orleans Saints0NFC SouthNFCW; AFCS
20Indianapolis Colts-0.1AFC SouthAFCW; NFCS
21Dallas Cowboys-0.1NFC EastNFCN; AFCE
22Los Angeles Rams-0.1NFC WestNFCS; AFCN
23Washington Redskins-0.2NFC EastNFCN; AFCE
24Baltimore Ravens-0.2AFC NorthAFCE; NFCW
25Pittsburgh Steelers-0.4AFC NorthAFCE; NFCW
26Cincinnati Bengals-0.4AFC NorthAFCE; NFCW
27New York Giants-0.6NFC EastNFCN; AFCE
28Philadelphia Eagles-0.7NFC EastNFCN; AFCE
29Buffalo Bills-0.7AFC EastAFCN; NFCE
30Cleveland Browns-0.7AFC NorthAFCE; NFCW
31New York Jets-0.9AFC EastAFCN; NFCE
32New England Patriots-1.3AFC EastAFCN; NFCE

[continue reading…]

{ 1 comment }

It is a football truism that the team that wins the rushing battle wins the game. The causation arrow also runs the other way, of course: the team that wins the game usually wins the rushing battle.

Since 1950, how successful were teams that won the rushing battle? Those teams won 72.9% of the time. That number is 72.7% since 1970, 71.9% since 1990, 71.3% since 2002, and 70.5% over the last 10 years. And the numbers are nearly identical, of course, if we ask the question the other way (among teams that won, how often did they win the rushing battle?).

Now, there are obviously key factors that drive both of these results: number of carries and leading late in games. The number of carries a team has is highly correlated with how many rushing yards a team gains. And the number of carries a team has is highly correlated with what the score margin is late in the game. And, finally, the score margin late in the game is highly correlated with how often the team wins the game.

That’s a few steps, but given the strong correlations, it makes it difficult to really evaluate a team’s rushing game and the causal relationship between rushing and winning. In a lot of games, you can see something like this:

Team that is winning late –> is team that runs more late in games –> is team that finishes with more runs –> is team that finishes with more rushing yards –> is team that wins.

But what if we flip the script and look at games where that’s not true. Specifically, I’m thinking of all games where the team that wins the game was losing at the end of the third quarter. In that universe, we have a much more even environment to examine the rushing game. For example, since 1950, there have been 2,085 games where a team was losing after three quarters and won the game. On average, those teams trailed by 5.4 points after three quarters, but of course won every game.

Now, what percentage of the time do you think the winning team — that is, the team that trailed after three quarters — won the rushing battle?

This isn’t just a rhetorical question. I want you to think about it. On average, over these two thousand plus games, the winning team trailed by 1.5 points after the first quarter, (4.6 to 3.1), by 3.8 points at halftime, (12.0 to 8.2), 5.4 points after three quarters (17.1 to 11.7), and then was ahead by 4.2 points (23.7 to 19.5) after the fourth quarter.

Knowing this, how often do you think the team that won also won the rushing battle?

I’ll give you another minute to think about it.

.
.
.
.
.
.
. [continue reading…]

{ 1 comment }

How Often Does A Passing Game Flip The Outcome?

In week 1 last year, Tampa Bay quarterback Ryan Fitzpatrick had a game for the ages. He averaged 17.75 ANY/A on 28 dropbacks, and was the catalyst in the Bucs 48-40 upset over the Saints.  Tampa Bay’s running game underperformed, and its defense was dreadful, but Fitzpatrick and the passing offense were so effective that the Bucs won anyway.

Here is the Expected Points Summary from that game, courtesy of PFR.

Passing is king in football, and you won’t be surprised to learn that in lots of games, the passing game is the reason a team wins. Even in games where a player throws a pick six — say, this Chargers/49ers game from September — strong passing the rest of the way can make up the difference. In this game, Los Angeles won by 1 point and finished with +2.2 points of passing EPA, as Philip Rivers still finished with 6.43 ANY/A.

In total, there were 113 games last year where a team won and their passing EPA was larger than the margin of victory.  This is in stark contrast to yesterday, where there 23 games where the team that won had a rushing EPA larger than the margin of victory.  This means that in 44% of games, the team that won would “have lost” if they had an average passing attack. [continue reading…]

{ 1 comment }

How Often Does A Running Game Flip The Outcome?

No study is perfect, but some are useful anyway. Pro-Football-Reference.com publishes Expected Points Data for every game broken down by unit. For example, let’s take a look at the week 6 game from the 2018 season between the Broncos and Rams. In this game, Jared Goff and the passing attack produced just 174 net yards on 33 dropbacks, while throwing one interception and zero touchdowns. In other words, it was a really bad game (3.91 ANY/A), statistically his second-worst of the season (behind his disaster performance in Chicago). Meanwhile, Todd Gurley rushed 28 times for 208 yards and 2 TDs, a monster performance that included a 4th down conversion.

The Rams won the game by 3 points, while the team’s running game produced 15 points above expectation. So — if we are willing to make a few assumptions about how a game works — we can say that the Rams won against the Broncos in a game where they would not have won had their rushing game been average.

There were 23 games in 2019 where a team won and where the team’s rushing EPA was greater than the margin of victory. That represents 9% of all winning teams in 2018. [continue reading…]

{ 1 comment }
Next Posts Previous Posts