≡ Menu

We know that there is a strong correlation between winning percentage and rushing plays: the teams with the best records tend to run most often, as leading in the second half of games is strongly correlated with both winning games and running in the second half of games. Last year, the top 5 teams in rushing attempts all made the playoffs, and 9 of the top 10 teams (sorry, Buffalo) in rushing attempts won at least 9 games.

The flip side of this is that there is a negative correlation between winning percentage and pass plays. But what I wanted to look at today is how this has changed over time.

I grouped all games into ones where a team passed between 20 and 29 times, 30 and 39 times, or 40 to 49 times. I then checked, for every season since 1960, how often teams won when meeting those criteria. The results are in the graph below: [continue reading…]

{ 0 comments }

According to Ian Rapaport, Jets head coach — and now interim GMAdam Gase was apparently unhappy with the amount of money ex-New York GM Mike Maccagnan spent to lure Le’Veon Bell to the team in March. Gase “just did not love spending that much money for a player at that position” according to Rapaport. Which, frankly, is a little silly.

For starters, other than Bell, all other Jets running backs are making less than $1M this season (the top three are Elijah McGuire, Trent Cannon, and Ty Montgomery).  And the Bell contract is hardly debilitating: he will cost the Jets $9M in salary cap space.  As a result, New York has allocated $12.4M in 2019 salary cap dollars to the running back position, which …. simply isn’t that much.

The two teams that have allocated the most 2019 salary cap dollars to the running back position are the Bills (LeSean McCoy, Frank Gore, and T.J. Yeldon) and 49ers (Jerick McKinnon, Tevin Coleman,Raheem Mostert), and perhaps you want to argue that those are not the teams one should emulate.  But last year’s two Super Bowl participants are also in the top five in salary cap dollars spent at running backs.  The Rams have the highest paid running back in the NFL in Todd Gurley and also are paying over $2M this season to Malcolm Brown.  New England is spending $4.6M on James White, $3M on Rex Burkhead, $2.2M on Sony Michel, and $1.7M on Brandon Bolden.  And in terms of capital spent, New England used a 1st round pick on Michel in 2018, have two higher paid backs on the roster, and then used a 3rd round pick this year on RB Damien Harris from Alabama.

Arizona (David Johnson) rounds out the top 5 in RB salary cap dollars spent, and the Jets are sixth.  So while Gase may think the Jets overpaid for Bell, it’s hard to make the argument that this was a big mistake.  The Jets are one of 10 teams that still have $25M of salary cap space available for 2019, and there are not many ways left to use that space.  Maybe Gase thinks Bell was overpaid by a couple of million dollars, but that will have little practical impact on the team in 2019.  In 2020, Bell’s cap hit will be $15.5M, but that is not going to hamstring the team.

One reason for that, of course, is the presence of Sam Darnold.  In general, we do see an inverse relationship between how many 2019 salary cap dollars a team spends at RB with how many salary cap dollars a team spends at QB. Take a look at the graph below, with all data courtesy of Over The Cap. [continue reading…]

{ 0 comments }

Arranged marriages are a Jets tradition

In 2001, the Jets did something pretty conventional.  On January 12, 2001, they hired a new GM in Terry Bradway, and six days later, Bradway hired a new head coach in Herm Edwards.  That’s pretty much the normal way a team operates: ownership (in this case, it was brand new owner Woody Johnson) picks a GM to build the organization, and then the GM picks a head coach to build the team.

Apparently, Johnson has since found the old fashioned way to be pretty boring.

In January 2006, the Jets traded Edwards to the Chiefs with Bradway’s tenure on the rocks. On January 18, 2006, the Jets hired a new head coach in Eric Mangini.  But then, a few weeks later, on February 7, 2006 Bradway was fired and assistant GM Mike Tannenbaum was promoted.  Tannenbaum was a friend of Mangini and “part of the interviewing process” — a common Jets theme — but acknowledged that it was Bradway who made the final call to hire Mangini.

Regardless, in late December 2008, Mangini was fired, and on January 20, 2009, Tannebaum hired Rex Ryan to replace him.

That worked out because the Jets had great seasons in 2009 and 2010, but after bad seasons in 2011 and 2012, Tannenbaum was fired on the last day of the 2012 calendar year. You might think that Ryan would be shown the door with him, but if you think so, you don’t know the Jets.

With Johnson determined to hire a GM while keeping Ryan in place, the best Johnson could do was hire John Idzik — another salary cap guru — to replace Tannenbaum.  That happened in January 2013.  But Idzik couldn’t help turn around a depleted Jets roster, and he never got a chance to hire his own head coach, either: at the end of the 2014 season, Johnson fired both Idzik and Ryan.

This gave the Jets a chance to bring on a new GM and have that GM hire his own head coach. It also gave the Jets a chance to reinvent the circus wheel, and that turned out to be the more appealing option.  On January 12, 2015, Johnson hired both HC Todd Bowles and GM Mike Maccagnan.  Maccagnan didn’t hire Bowles, but he was “part of the interviewing process” as the Jets ran a dual-track hiring approach. As Rich Cimini noted that day:

In hiring Maccagnan, the Jets have changed their power structure. He and Bowles will report directly to Johnson, who envisions the GM and coach as equal partners. Previously, the coach reported to the GM. Maccagnan will have control over the 53-man roster and final say on the draft; the coach will decide the weekly lineups. The lines were blurred with Ryan and Idzik, especially with quarterback decisions.

You may be surprised to learn that such a strategy did not work out.  Under Bowles and Maccagnan, from 2015 to 2018, the Jets were a bad football team.  At the end of the 2018 season, it made a lot of sense to fire both and start over.

But making a lot of sense is viewed as boring by the Jets.  Instead, New York fired Bowles and hired the underwhelming Adam Gase, whose Dolphins ranked 29th in points differential over his three years in Miami.  If you think limiting prospective coaching hires to only those who are willing to work under a bad GM who is on the hot seat and has a 24-40 record would limit the coaching pool, you are correct.  The Jets — after mismanaging the hiring process with another coach — were left with Gase, a candidate who would not have otherwise been a head coach in the NFL in 2019.

But today, on May 15, 2019, in a stunning move for those who don’t follow the Jets, the team has fired Maccagnan, a move that is long overdue but comes at a very suspect time.  It means the new Jets GM will have to inherit Gase as his coach, in typical Jets fashion. And the early reports are not very promising, as Gase is going to be acting as interim GM and assisting in the process of finding his own boss:

Six months ago, the Jets entered the offseason with a potential franchise quarterback in Sam Darnold, the #3 pick in the Draft, and a ton of cap space.  It was the perfect opportunity for the Jets to attract a strong GM candidate, and in turn, have that GM be able to find a strong HC. Instead, the Jets let Maccagnan run the offseason, hire Gates, and spend nearly $200M on free agents, and oversee the 2019 Draft…. and then fire him.  And now, the Jets are looking to to attract a GM who will have no power to make material changes in 2019 and be tied at the hip to Gase.

That strategy makes a lot of sense, but only if you are talking about the Jets.

{ 0 comments }

Yesterday, I noted that the average height of all wide receivers — weighted by receiving yards — declined steadily during the ’80s, and then reverted by steadily rising during the 1990s. There is no natural way to measure something like “wide receiver height” because it involves taking an average. And taking an average means you need a numerator and a denominator, and there’s no clear answer as to what the denominator should be.

Should “average wide receiver height” be an average of all wide receivers in the NFL? Maybe, but what does “all” mean? Does it include only players who made it to the final 53 man roster? Only players who played in a single NFL game that year? Only starters?

Should a wide receiver who played in zero games but be on the roster be counted exactly the same as Jerry Rice? I don’t think so, and one easy and neat way to deal with all of these questions is to take a weighted average, and to use receiving yards as the weighing mechanism. So if Rice was responsible for 2% of all NFL receiving yards, and a 6’7 backup who never made it into a game was responsible for 0% of all receiving yards, then the “average height of all wide receivers” is comprised of 2% Rice and 0% of the backup.

This works well, in my opinion, but there is a potential drawback to this approach. If the structure of the league changes — say, the introduction of three-WR sets with smaller slot receivers — that would change the average by a noticeable amount. Teams may have always had a 5’10 player as their third receiver, but they could jump from 200 yards to 700 yards just by moving to an offense that gets them on the field. [continue reading…]

{ 0 comments }

Yesterday, I noted that in 2018, Josh Rosen produced one of the least valuable passing seasons ever. One reason that Rosen had so much negative value attributed to his stats is because he took 80% of all Arizona dropbacks last year. So while Rosen was bad, the results look different if we examine things on the team level.

In fact, two other Cardinals passing attacks were worse. In 2012, Arizona had three passers with over 180 dropbacks — John Skelton, Kevin Kolb, and Ryan Lindley — and a fourth (Brian Hoyer) with 57 dropbacks. Collectively, the group averaged 3.42 ANY/A (compared to 3.68 in 2018). The league average was 5.93 that season (and 6.32 last year), and Arizona had a whopping 666 pass plays that season. As a result, the 2012 Cardinals finished 1,672 adjusted net yards below average, the second worst in NFL history. (The 1999 Cardinals, with Jake Plummer, also check in as slightly worse than the 2018 Cardinals; more on them in the table below). [continue reading…]

{ 0 comments }

Last year, I looked at the worst passing seasons in NFL history as measured by the amount of Adjusted Net Yards each passer produced relative to league average. The worst season of all time — which is heavily influenced by the number of pass attempts a quarterback has — belonged to Blake Bortles in 2014.

Well, in 2018, a rookie Josh Rosen nearly beat him. Rosen averaged just 3.53 ANY/A last year, relative to a leauge average ANY/A of 6.32. That’s 2.79 ANY/A below average, and over 438 dropbacks, that means Rosen produced 1,221 Adjusted Net Yards fewer than league average. He was worse relative to league average than Bortles was in 2014, but since he had fewer attempts, he now comes in with the second least valuable season.

The full list of the 100 worst passing seasons (without pro-rating for games played) is below.

RkQuarterbackYearTeamANY/ALgAvgDropbacksRANY/AValue
1Blake Bortles2014jax3.816.14530-2.33-1234
2Josh Rosen2018crd3.536.32438-2.79-1221
3DeShone Kizer2017cle3.695.91514-2.21-1138
4David Carr2002htx3.245.35520-2.11-1096
5Jake Plummer1999crd2.65.18408-2.59-1055
6Archie Manning1975nor1.384.04387-2.66-1030
7Brock Osweiler2016htx4.346.22537-1.88-1007
8Blaine Gabbert2011jax3.685.9453-2.22-1007
9Bobby Hoying1998phi1.435.31259-3.88-1004
10JaMarcus Russell2009rai2.315.65279-3.34-931
11Jimmy Clausen2010car2.985.73332-2.75-913
12Joe Flacco2013rav4.55.87662-1.37-910
13Kerry Collins1997car2.945.16408-2.22-907
14Ryan Leaf1998sdg1.935.31267-3.38-904
15Vinny Testaverde1988tam3.275.02499-1.75-872
16Ryan Fitzpatrick2008cin3.585.7410-2.13-872
17Jon Kitna2001cin3.765.19606-1.43-867
18Joe Kapp1970nwe0.684.16246-3.47-854
19Kyle Orton2005chi3.25.34398-2.14-852
20Dan Pastorini1981ram-0.125166-5.12-850
21Jack Trudeau1986clt3.054.96446-1.9-849
22Kordell Stewart1998pit3.585.31491-1.73-848
23Jack Jacobs1948gnb0.024.61184-4.59-844
24Jake Plummer2002crd3.865.35566-1.49-844
25Jim Plunkett1972nwe2.154.28394-2.13-841
26Andrew Walter2006rai2.785.38322-2.6-836
27A.J. Feeley2004mia3.445.63379-2.2-833
28Geno Smith2013nyj4.175.87486-1.7-828
29Derek Carr2014rai4.826.14623-1.32-822
30Alex Smith2005sfo1.115.34194-4.23-821
31Chris Weinke2001car3.745.19566-1.45-821
32Dave Brown1996nyg3.35.14447-1.83-820
33Jeff Komlo1979det2.64.61408-2.01-819
34Matthew Stafford2009det3.645.65401-2.01-807
35Terry Bradshaw1970pit0.864.16243-3.3-802
36Vince Evans1981chi3.275459-1.73-793
37Joe Ferguson1984buf2.935379-2.08-788
38Trent Dilfer1995tam3.715.41462-1.7-787
39Rusty Hilger1988det2.695.02337-2.33-785
40Jared Goff2016ram2.826.22231-3.39-784
41Eli Manning2013nyg4.555.87590-1.33-783
42Craig Whelihan1998sdg2.985.31335-2.33-782
43Bob Lee1974atl0.063.91203-3.85-781
44Gary Marangi1976buf0.994.07254-3.07-781
45David Carr2005htx3.775.34491-1.58-774
46Mark Malone1987pit2.855.04354-2.19-774
47Trent Dilfer2007sfo2.375.52246-3.14-773
48Mark Sanchez2012nyj4.365.93487-1.57-766
49Jake Delhomme2009car3.425.65344-2.22-765
50Brett Hundley2017gnb3.715.91345-2.2-759
51Joey Harrington2003det3.865.2563-1.34-754
52Stan Gelbaugh1992sea2.314.88289-2.57-744
53Joe Theismann1985was2.664.86338-2.2-744
54Matt Cassel2009kan4.265.65535-1.38-741
55Ryan Lindley2012crd1.895.93183-4.04-740
56Dan Pastorini1973oti1.583.89320-2.31-739
57Kyle Boller2004rav4.165.63499-1.47-734
58Akili Smith2000cin2.815.21303-2.39-726
59Charlie Frye2006cle3.725.38437-1.66-724
60Kelly Stouffer1992sea1.544.88216-3.34-722
61Carson Wentz2016phi5.096.22640-1.12-720
62Jeff George1991clt3.865.18541-1.32-716
63Randy Hedberg1977tam-3.213.55105-6.76-709
64Steve DeBerg1978sfo1.834.03319-2.2-701
65Joe Namath1976nyj1.224.07246-2.85-700
66Ryan Leaf2000sdg3.225.21353-1.98-700
67Mike Phipps1973cle1.863.89343-2.03-696
68Joe Flacco2017rav4.715.91576-1.2-691
69Drew Bledsoe1995nwe4.375.41659-1.05-689
70Dennis Shaw1971buf1.813.93324-2.12-686
71Steve Fuller1979kan2.384.61307-2.23-685
72Kim McQuilken1976atl-0.94.07138-4.96-685
73Bubby Brister1995nyj1.745.41186-3.67-683
74Josh Allen2018buf4.376.32348-1.95-679
75Donovan McNabb1999phi2.415.18244-2.77-675
76Rick Mirer1995sea3.855.41433-1.56-674
77Troy Aikman1989dal3.095.24312-2.15-672
78David Archer1985atl2.974.86355-1.89-671
79Greg Landry1969det1.154.67190-3.52-668
80Derek Anderson2009cle2.195.65193-3.46-667
81Josh McCown2014tam4.36.14363-1.84-666
82Josh Freeman2011tam4.765.9580-1.14-664
83Mike Phipps1975cle2.094.04341-1.95-664
84Bobby Douglass1969chi1.094.67185-3.58-662
85Mark Rypien1993was3.165.11335-1.96-656
86Rick Mirer1993sea3.895.11533-1.22-653
87Cliff Stoudt1983pit3.495432-1.5-650
88Blake Bortles2016jax5.236.22659-0.98-649
89Boomer Esiason1992cin2.74.88297-2.18-648
90Bobby Douglass1971chi1.393.93255-2.54-648
91Randall Cunningham1986phi2.664.96281-2.3-646
92Tobin Rote1959det0.654.59162-3.93-637
93Marc Bulger2008ram4.385.7478-1.33-634
94Hugh McCullough1940crd-2.92.55116-5.45-632
95Vinny Testaverde1991tam3.455.18361-1.74-627
96Sam Bradford2010ram4.735.73624-1-624
97Rick Norton1969mia0.484.23166-3.76-624
98Marc Bulger2007ram4.025.52415-1.5-621
99Richard Todd1976nyj0.824.07191-3.24-619
100Ronnie Cahill1943crd-2.543.12109-5.66-617
{ 0 comments }

The Best Players To Change Teams In 2018

Who were the best players to change teams last season? The Oakland Raiders lost three of them, with varying degrees of fanfare. Oakland traded Khalil Mack to the Bears, and the outside linebacker wound up having a dominant season in Chicago. Mack was drafted with the 5th overall pick by Oakland in 2014; at the end of the draft, the Raiders signed Denico Autry as an undrafted free agent. He had a good four-year run in Oakland, and then signed a three-year, $17.8M contract with the Colts after the 2017 season. As it turned out, 2018 was Autry’s breakout year, putting together 9 sacks in 12 games.

And then, in the middle of the season, Oakland traded Amari Cooper to the Cowboys, and the wide receiver played like a superstar during his 9-game run in Dallas.

The table below shows all players who switched teams in 2018 who produced at least 5 points of AV last year. [continue reading…]

{ 0 comments }

In 2008, four undrafted quarterbacks were leading potential playoff teams in Kurt Warner, Jake Delhomme, Jeff Garcia, and Tony Romo.  Warner’s Cardinals made the Super Bowl, Delhomme’s Panthers went 12-4, Garcia went 6-5 for the Bucs, and Romo went 8-5 for the Cowboys.  A fifth undrafted quarterback, Shaun Hill, went 5-3 for the 49ers.

The undrafted quarterback era seemingly disappeared, but is it on its way back? Nick Mullens had one of the best seasons by an undrafted free agent rookie quarterback last year.  Only two other rookie UDFAs started games last year, one apiece by the two Panthers backups (Taylor Heinicke and Kyle Allen). And while it was an ignored week 17 game, Allen played extremely well.

Highly drafted rookies get a chance to stink for a very long time — think of the awful rookie seasons of Blake Bortles, Josh Rosen, Derek Carr, or Jared Goff.  But we don’t have a very large sample when it comes to lowly regarded prospects who play poorly. [continue reading…]

{ 1 comment }

Matt Ryan Is Building A Hall of Fame Career

Matt Ryan has had the unfortunate luck of playing in an area with Tom Brady, Drew Brees, Peyton Manning, and Aaron Rodgers, four quarterbacks who will go down as among the 15 or so best to ever play the position. Manning entered the NFL in ’98, Brady in ’00, and Brees in ’01; Ben Roethlisberger, another very likely future HOFer, was drafted in ’04, and then Rodgers in ’05.

But then there’s a gap.

The best quarterback drafted in ’06, by far, was Jay Cutler.
There are no quarterbacks of note from 2007, the year JaMarcus Russell and Brady Quinn were first round picks.
Ryan was drafted in 2008, as was Joe Flacco.
In 2009, we have Matthew Stafford and Mark Sanchez.
In 2010, it’s Sam Bradford and nothing else.
In 2011, we get Cam Newton and Andy Dalton. We probably should have seen Russell Wilson, and Andrew Luck nearly declared this year but did not.

As a result, when we look at the 6-year period from 2006 to 2011, Ryan and Newton stand out as the best quarterbacks of that era. And at this point in time, Ryan is the heavy favorite to finish his career as the best quarterback to enter the league during this 6-year period.

And that’s because there’s no reason to think Ryan won’t age very well. He entered the league at age 23, and just finished his 11th (age 33) season. Ryan also has thrown for the most yards in history during any players age 23 through 33 seasons.

Will Ryan get to 70,000 passing yards? Right now, only four players have done that — Brett Favre, Brady, Manning and Brees. Ryan has not been at that caliber, but it would require just 23,280 yards the rest of his career. At this point in time, I would suggest that he’s more likely than not to get there. [continue reading…]

{ 1 comment }

Jameis Winston and Marcus Mariota have been linked together for a long time.

In college, Jameis Winston was the 2013 Heisman Trophy winner, and his Florida State team won the college championship that season. The next season, Marcus Mariota won the Heisman Trophy Winner and his Oregon Ducks knocked Winston and the Seminoles out of the playoffs.

The two quarterbacks then were selected as the first two picks in the 2015 Draft. Who was the better prospect? That was a tough debate for many analysts to answer. Four years later, the question of who is the better pro quarterback is just as difficult to solve.

Both have been average starters in the NFL. There have been 32 quarterbacks to throw 800+ passes since Winston and Mariota entered the NFL. Of those passers, Winston ranks 17th in ANY/A and Mariota ranks 20th. Stylistically, the two quarterbacks are very different: Mariota takes a ton of sacks (he has the 5th-worst sack rate of those 32 quarterbacks; Winston is square in the middle at 16th), while Winston throws a lot of interceptions (he has the 2nd-worst INT rate) but also is a deep thrower (he has the 3rd-best yards/completion rate).

But perhaps the biggest discrepancy between the two players through four years is their records. Mariota is an average 27-28, but that’s dragged down by a 3-9 rookie season; he has been slightly better than .500 every year since. Winston, meanwhile, has a 21-33 record; his 0.389 winning percentage is the 4th-worst of those 32 quarterbacks.

But how they got to those records tells a pretty revealing story. Mariota has started 55 games and has produced a 6.16 ANY/A average in those starts, while Winston has started 54 games and averaged 6.34 ANY/A. I calculated each quarterback’s ANY/A average in each game, and then combined those games into groups: an ANY/A of 0 to 0.99, 1 to 1.99, 2 to 2.99, etc. Then, I checked to see how many games under or over .500 each quarterback was in each group.

That’s shown below, with Winston’s numbers in orange and Mariota’s in blue.  I have also included each quarterback’s full record for each category of games.  For example, take a look at the graph below and look in the middle for the 7 on the X-Axis.  This is all games where the quarterbacks averaged between 7 and 7.99 ANY/A.  Mariota is four games over .500 in those games, going 4-0.  Winston is two games over .500 in those games, going 5-3.

The biggest outliers concern Winston, particularly at the 6 and 10 marks.  For Winston, he is 3-7 when averaging between 6 and 6.99 ANY/A, while Mariota is 4-5.  More striking, perhaps, is at the 10-10.99 ANY/A mark: Winston there is 0-3!  (Those losses were to Carolina, Washington, and Atlanta.) Mariota, meanwhile, is 7-1 when in games with an ANY/A of 9.00 or better. [continue reading…]

{ 0 comments }

Yesterday, I took another look at the draft value chart and the appropriate values we should assign to each draft pick. One conclusion was that the value of all draft picks has increased, as more AV is going to players on rookie contracts.

Today, I want to specifically examine the claim that since the NFL instituted the rookie wage scale as part of the 2011 CBA, teams are giving more playing time and production to players on rookie contracts. For all graphs today, I will be separating players into two categories: players who are in their first 4 seasons will be graphed in red, and veterans in their 5th seasons or later will be graphed in black. [continue reading…]

{ 1 comment }

Mayfield powered the Browns resurgence in 2018.

In 2018, there were three teams that made huge strides in their passing game, and all three involved turnover at quarterback.

In 2017, the Colts averaged 5.06 ANY/A, 25th-best in the NFL, with Andrew Luck missing the season due to injury. Last year, with a healthy Luck, Indianapolis finished 10th in ANY/A with a 6.90 average.

In 2017, the Packers finished 30th in ANY/A with a 4.66 average as Aaron Rodgers missed over half of the season due to injury; last year, with Rodgers back, Green Bay averaged 6.58 ANY/A, 13th-best in the league.

But the biggest jump from ’17 to ’18 came from the Cleveland Browns. After adding Baker Mayfield, the Browns jumped from last in ANY/A at 3.63 to 17th with a 6.25 average.

Yesterday, I looked at the teams that saw the biggest year-over-year declines in passing efficiency. Today, the opposite: which teams made the biggest ANY/A improvement each year? That’s what is shown in the table below. For example, in 2017, the Rams made the biggest jump in ANY/A. The year before, the Rams averaged 3.98 ANY/A, worst in the league, behind mostly Case Keenum (although a rookie Jared Goff was miserable as a starter in 7 games). The next year, Los Angeles averaged 7.47 ANY/A 4th-best in the league, as Goff made an enormous leap.

YearTeamN-1 ANY/AN-1 RkYr N-1 QBYr N ANY/AYr N RkYr N QBANY/A Diff
2018CLE3.6332DeShone Kizer (83%)6.2517Baker Mayfield (85%)2.61
2017LAR3.9832Case Keenum (60%)7.474Jared Goff (92%)3.48
2016ATL6.1817Matt Ryan (99%)9.011Matt Ryan (99%)2.83
2015JAX3.9732Blake Bortles (85%)6.0819Blake Bortles (100%)2.11
2014NYG4.3531Eli Manning (97%)6.6611Eli Manning (99%)2.31
2013PHI5.2224Michael Vick (57%)7.842Nick Foles (62%)2.62
2012DEN4.7724Tim Tebow (63%)7.851Peyton Manning (99%)3.07
2011CAR2.8532Jimmy Clausen (62%)6.2911Cam Newton (100%)3.43
2010TAM3.6429Josh Freeman (55%)6.895Josh Freeman (96%)3.25
2009MIN5.3220Gus Frerotte (67%)7.73Brett Favre (96%)2.39
2008MIA4.2528Cleo Lemon (55%)7.193Chad Pennington (97%)2.94
2007NWE6.049Tom Brady (98%)8.771Tom Brady (99%)2.73
2006NOR4.3124Aaron Brooks (78%)7.393Drew Brees (96%)3.08
2005WAS4.0330Patrick Ramsey (53%)6.0810Mark Brunell (94%)2.04
2004SDG4.6722Drew Brees (68%)7.593Drew Brees (89%)2.93
2003MIN4.9924Daunte Culpepper (98%)7.133Daunte Culpepper (87%)2.14
2002KAN5.1615Trent Green (99%)7.111Trent Green (99%)1.95
2001GNB5.3313Brett Favre (97%)7.022Brett Favre (100%)1.69
2000SFO4.5623Jeff Garcia (67%)7.282Jeff Garcia (96%)2.72
1999STL4.1725Tony Banks (73%)8.021Kurt Warner (94%)3.85
1998BUF3.4329Todd Collins (72%)6.597Doug Flutie (77%)3.16
1997OAK4.8117Jeff Hostetler (75%)6.216Jeff George (98%)1.39
1996CAR3.927Kerry Collins (81%)5.796Kerry Collins (75%)1.89
1995CHI5.2216Steve Walsh (68%)7.21Erik Kramer (100%)1.98
1994CHI3.3527Jim Harbaugh (84%)5.2216Steve Walsh (68%)1.87
1993DEN3.724John Elway (67%)6.524John Elway (100%)2.81
1992TAM2.7728Vinny Testaverde (66%)4.5119Vinny Testaverde (70%)1.73
1991WAS5.2512Mark Rypien (57%)8.331Mark Rypien (94%)3.08
1990KAN4.9814Steve DeBerg (74%)7.441Steve DeBerg (99%)2.45
1989SFO5.776Joe Montana (79%)8.541Joe Montana (80%)2.77
1988CIN5.2310Boomer Esiason (93%)7.771Boomer Esiason (99%)2.53
1987NOR3.9922Dave Wilson (80%)6.124Bobby Hebert (72%)2.13
1986MIN4.4618Tommy Kramer (88%)6.852Tommy Kramer (72%)2.39
1985NYJ4.4719Pat Ryan (58%)6.662Ken O'Brien (98%)2.19
1984MIA6.693Dan Marino (67%)8.851Dan Marino (99%)2.17
1983MIA3.5723David Woodley (75%)6.693Dan Marino (67%)3.12
1982RAM2.6928Pat Haden (56%)5.0911Vince Ferragamo (70%)2.4
1981CIN3.7124Ken Anderson (54%)6.932Ken Anderson (87%)3.22
1980DET2.7926Jeff Komlo (81%)5.698Gary Danielson (99%)2.9
1979SFO1.0828Steve DeBerg (69%)4.9411Steve DeBerg (96%)3.86
1978NOR2.4224Archie Manning (64%)5.373Archie Manning (98%)2.95
1977NYJ1.1128Joe Namath (59%)2.8221Richard Todd (74%)1.71
1976OAK4.0214Ken Stabler (84%)7.082Ken Stabler (81%)3.06
1975BAL2.3723Bert Jones (64%)5.872Bert Jones (97%)3.5
1974SDG1.626Dan Fouts (53%)4.1813Dan Fouts (68%)2.58
1973RAM3.6618Roman Gabriel (87%)6.691John Hadl (95%)3.03
1972NYJ3.1918Bob Davis (44%)6.064Joe Namath (93%)2.88
1971NWE1.0726Joe Kapp (56%)4.2311Jim Plunkett (99%)3.15
1970SFO4.6411John Brodie (70%)7.61John Brodie (99%)2.96

In 1993, the Bears finished 2nd to last (behind Washington) in ANY/A at 3.35, with Jim Harbaugh struggling at quarterback. In 1994, with Steve Walsh at quarterback, Chicago finished 17th in ANY/A with the biggest improvement (+1.87 ANY/A) in the league at that metric.  And then in 1995, with Erik Kramer , Chicago jumped another 1.98 ANY/A; not only was that the biggest jump from ’94 to ’95, it also made the Bears the top passing team of 1995. In a span of two years, the Bears went from averaging 3.3 ANY/A to 7.2 ANY/A, increased their touchdowns from 7 to 29 and their average completion from 9.9 yards to 12.2 yards, while seeing their interceptions call from 16 to 10 and sacks drop from 48 to 15.

That’s one of two times a team had the biggest ANY/A improvement in back to back years.  The other time involved Dan Marino and the Miami Dolphins; Miami made a huge jump going from not Marino to a rookie Marino in ’83, and then another big jump going from rookie Marino to HOF Marino in ’83.

What stands out to you?

{ 0 comments }

There were 5 teams that experienced a decline of at least 1.00 Adjusted Net Yards per Attempt last season. The Lions, with Matt Stafford, dropped by 1.27 ANY/A, while the Cardinals (-1.32) and Bills (-1.41) saw declines after switching to rookie quarterbacks. The Jaguars experienced the scary half of the Blake Bortles roller coaster last year, as the team’s passing game declined by 1.43 ANY/A.

But it was Washington — who evicted Kirk Cousins — that saw the biggest decline, a drop-off of 1.56 ANY/A. The Redskins problems were compounded by the injury to Alex Smith, as Washington averaged 4.82 ANY/A for the year but Smith averaged 5.81 ANY/A.

It made me wonder: which teams have had the biggest decline in their passing games each year? The table below shows that for each year since the merger.

YearTeamN-1 ANY/AN-1 RkYr N-1 QBYr N ANY/AYr N RkYr N QBANY/A Diff
2018WAS6.3812Kirk Cousins (100%)4.8228Alex Smith (64%)-1.56
2017GNB7.086Aaron Rodgers (98%)4.6630Brett Hundley (56%)-2.42
2016ARI8.031Carson Palmer (96%)5.7223Carson Palmer (92%)-2.31
2015DAL7.962Tony Romo (91%)4.9932Matt Cassel (39%)-2.97
2014PHI7.842Nick Foles (62%)6.0516Nick Foles (50%)-1.79
2013WAS7.462Robert Griffin (89%)5.0421Robert Griffin (75%)-2.42
2012GNB9.421Aaron Rodgers (91%)7.374Aaron Rodgers (99%)-2.05
2011TAM6.895Josh Freeman (96%)4.6927Josh Freeman (94%)-2.2
2010MIN7.73Brett Favre (96%)4.0830Brett Favre (71%)-3.62
2009MIA7.193Chad Pennington (97%)4.5223Chad Henne (83%)-2.67
2008NWE8.771Tom Brady (99%)612Matt Cassel (97%)-2.77
2007STL6.376Marc Bulger (99%)3.7831Marc Bulger (66%)-2.59
2006OAK5.316Kerry Collins (96%)2.6732Andrew Walter (57%)-2.64
2005MIN7.952Daunte Culpepper (99%)4.9420Brad Johnson (58%)-3.01
2004TEN7.731Steve McNair (80%)5.2119Billy Volek (61%)-2.51
2003OAK6.942Rich Gannon (100%)4.0826Rich Gannon (43%)-2.86
2002STL7.471Kurt Warner (99%)5.0222Kurt Warner (35%)-2.45
2001DEN7.124Brian Griese (59%)4.7124Brian Griese (88%)-2.41
2000CAR6.723Steve Beuerlein (99%)4.7117Steve Beuerlein (94%)-2.01
1999SFO7.232Steve Young (93%)4.5623Jeff Garcia (67%)-2.66
1998PHI5.1717Ty Detmer (42%)2.9529Bobby Hoying (42%)-2.22
1997CAR5.796Kerry Collins (75%)3.6428Kerry Collins (71%)-2.15
1996DET7.033Scott Mitchell (96%)4.5324Scott Mitchell (81%)-2.5
1995TAM5.5412Craig Erickson (81%)3.8328Trent Dilfer (82%)-1.71
1994NYG6.195Phil Simms (94%)4.5925Dave Brown (86%)-1.59
1993WAS5.3111Mark Rypien (99%)3.1828Mark Rypien (60%)-2.13
1992WAS8.331Mark Rypien (94%)5.3111Mark Rypien (99%)-3.02
1991PHI6.127Randall Cunningham (97%)3.6425Jim McMahon (61%)-2.48
1990SFO8.541Joe Montana (80%)6.486Joe Montana (89%)-2.06
1989PHO5.549Neil Lomax (79%)3.9227Gary Hogeboom (70%)-1.62
1988NWE4.8913Steve Grogan (37%)2.828Doug Flutie (46%)-2.09
1987MIN6.852Tommy Kramer (72%)4.4424Wade Wilson (59%)-2.41
1986SDG6.354Dan Fouts (68%)4.2716Dan Fouts (71%)-2.08
1985MIA8.851Dan Marino (99%)6.373Dan Marino (98%)-2.49
1984WAS7.231Joe Theismann (99%)5.575Joe Theismann (98%)-1.65
1983SDG7.911Dan Fouts (98%)5.68Dan Fouts (54%)-2.3
1982BUF66Joe Ferguson (99%)3.3427Joe Ferguson (97%)-2.67
1981RAM5.825Vince Ferragamo (90%)2.6928Pat Haden (56%)-3.13
1980SEA5.822Jim Zorn (97%)4.2619Jim Zorn (94%)-1.56
1979STL4.88Jim Hart (94%)3.3225Jim Hart (77%)-1.49
1978BAL5.382Bert Jones (99%)2.4426Bill Troup (77%)-2.94
1977OAK7.082Ken Stabler (81%)4.1511Ken Stabler (91%)-2.93
1976BUF5.853Joe Ferguson (91%)3.3518Gary Marangi (61%)-2.5
1975DEN5.138Charley Johnson (74%)2.7720Steve Ramsey (55%)-2.36
1974ATL4.829Bob Lee (72%)-0.0226Bob Lee (48%)-4.84
1973BAL5.069Marty Domres (58%)1.923Marty Domres (64%)-3.16
1972DAL6.611Roger Staubach (58%)4.0914Craig Morton (92%)-2.52
1971SFO7.61John Brodie (99%)4.6210John Brodie (99%)-2.98
1970GNB5.74Don Horn (53%)2.4223Bart Starr (73%)-3.28

Some notes:

12 times the biggest dropoff came from the team that ranked 1st in ANY/A the year before, which makes some sense, along with 10 more that ranked 2nd in ANY/A. Three teams went from average to horrible, which is even harder to pull off: the 1988 Patriots, the 1998 Eagles, and the 2006 Raiders.  And a special nod to Mark Rypien and the Redskins, who led the NFL in ANY/A in 1991 at 8.33, had the biggest decline in ANY/A from ’91 to ’92 when the Redskins ranked 11th with 5.31 ANY/A, and then again suffered the biggest decline in ANY/A from ’92 to ’93 when the team averaged 3.18 ANY/A, ranking last in the league.

{ 0 comments }

On Thursday, the NFL schedule was released. After that happens, one thing I like to do is to measure how much rest each team has relative to its opponents each week (although Brian Burke beat me to the punch this year). In past years, some teams got really screwed when it came to extra rest, but that wasn’t the case this year.

The Lions have the most friendly schedule this year when it comes to rest. With the exception of a week 7 game on Sunday following a week 6 game on Monday Night Football, Detroit doesn’t have any games this year when it played a game more recently than its opponent. The Lions don’t play any team coming off of a bye or a Thursday night game, and Detroit gets extra rest following its own bye, following its Thanksgiving game, and potentially two extra days in week 17 (the Lions might play on Saturday in week 16, while Detroit’s week 17 opponent, Green Bay, plays on Monday night in week 16).

On the other hand, you have the Patriots. New England has three consecutive games against opponents coming off of a bye: the Browns have a bye in week 7 before traveling to New England in week 8, the Ravens have a bye that week before hosting the Patriots in week 9, and both the Eagles and Patriots have a week 10 bye before facing off in Philadelphia in week 11. In addition, the Texans have a Thursday night home game in week 12, and 10 days later, host the Patriots.

The table below shows the amount of extra rest each team (and its opponent) has this year. Note that all 5 week 16 games that are possible Saturday games are considered Saturday games. The table is sorted from most favorable to least: e.g., the Lions face opponents with 12 days of fewer rest than them, the Chargers face opponents with 10 fewer days of rest, etc.

TeamOpp ByesExtra Rest (Own)Extra Rest (Opp)Extra Rest vs. Opp
Lions00-1212
Chargers00-1010
Bills00-88
Buccaneers00-88
Panthers00-88
Bears13-47
Cardinals00-66
Cowboys00-66
Jaguars10-55
Raiders1-1-54
Rams10-44
Texans1-1-43
Redskins10-33
Chiefs00-33
Colts1000
Titans1000
Bengals0000
Giants101-1
Falcons101-1
Vikings102-2
Seahawks102-2
Steelers102-2
Broncos1-12-3
Browns104-4
Jets104-4
Saints2-15-6
Ravens207-7
49ers2010-10
Packers2313-10
Dolphins2011-11
Eagles3011-11
Patriots3013-13

The “Opp Byes” column shows how many games each team has against teams coming off of byes. Obviously this totals to 32, but it is not evenly distributed. The Eagles and Patriots each play three teams coming off of byes, while nine teams face zero teams coming off of byes.

{ 0 comments }

As you can imagine, heavier players fare much worse in the 3-cone drill, and taller players have a slight advantage, too. Here was the best-fit formula from the 2019 combine:

Expected 3-Cone Drill = 7.4183 – 0.0287 * Height (Inches) + 0.0081 * Weight (Pounds)

Michigan defensive back David Long, who posted the fastest (but not the best) time in he dominated in the short shuttle, finishing in 6.45 seconds, the fastest time in the drill. Given his dimensions — 71 inches, 196 pounds — he’d be expected to complete the drill in 6.97 seconds. Therefore, Ford finished the drill in 0.52 seconds better than expected, the best adjusted performance in this drill.

Below is a chart showing the expected 3-Cone Drill based on various heights and weights: [continue reading…]

{ 0 comments }

Earlier this week, I wrote about the passing breakdown on short throws to both the left and right side of the field.

What about on deep throws? As it turns out, there’s not much of a difference in terms of either quantity or quality, with one notable exception. Last year, there was a nearly perfect 50/50 split on deep throws between being to the left side of the field and the right side of the field.  And the completion percentages were nearly identical, too, at 40%, as were the yards/attempt averages.  One big difference, though, was in touchdown rates.  And this is actually all consistent with what we found in the 2017 season, too: a 50/50 split between left and right side, the same completion percentage, but a much better TD rate on throws to the right side.

So, I suppose, all else being equal, you want to throw more deep passes to the right side of the field.  What’s interesting, though, is someone like Marcus Mariota, who threw 31 passes to the deep left side but just 11 to the deep right.  His top wideout, Corey Davis, caught 6 of 8 passes to the deep right, and was targeted 9 times on the deep left side.  But unless he was throwing to Davis, Mariota rarely threw to the deep right side of the field. [continue reading…]

{ 0 comments }

The 2019 NFL Schedule

Every year, I publish a color-coded version of the NFL schedule the night it is released. Tonight is that night.

Download the Excel file here

Some notes:

As usual, the games are color-coded based on time: Thursday (the Thanksgiving slate is week 13, with Detroit/Chicago repeating as the early game, Dallas/Buffalo in the afternoon, and Atlanta/New Orleans repeating at night) games are in light red, Sunday games at 1PM have no color, Sunday afternoon games are in orange, Sunday night games are in green, and Monday night games are in blue. In addition, in week 16, three of five possible matchups currently listed as TBD will be scheduled for Saturday. Those games are all in red, with white font.

There are five international games, with four in London. The Bears play “at” Oakland in week 5, Carolina plays “at” Tampa Bay in week 6, the Rams lose a home game to the Bengals in week 8, and the Jaguars “host” the Texans in week 9. In addition, the Chargers and Chiefs will play in Mexico City on Monday Night Football in week 11. That game is color-coded in blue for Monday Night, but with yellow font for international. Yes, my schedule grid has an easter egg.

Enjoy, and let me know if you spot any errors in the comments.

{ 0 comments }

Pass Efficiency By Pass Direction, Part II

Last year, I wrote about the distribution of passes across NFL fields, both horizontally (left/middle/right) and vertically (short/deep).

Today I want to do a quick update on two of those 6 boxes: passes to the short left and passes to the short right parts of the field. Historically, passes that are short and to the left side of the field have been slightly more effective for teams. Despite that, teams throw slightly more passes to the short right side of the field than the short left. Did that hold true for 2018?

Yes and yes. There were 5,079 passes marked as “short right” in 2018, and 5,508 attempts marked as “short left.”  And once again, passes that were thrown short and to the left were slightly more effective. Passes thrown short and to the left were completed 73.0% of the time, and had a slightly lower interception rate and slightly higher yards per completion rate, too.  In the aggregate, it does appear that throwing short and to the right is better than throwing short and to the left

So we have here a bit of an inefficiency, at least on the surface.    It seems as though teams should be throwing more short left passes than short right passes, but the opposite is happening.  What if we look at the individual data — are some teams throwing short passes more often to the left, and other teams are throwing significantly more often to the right?

I sorted all quarterbacks with at least 50 passes that were either short left or short right, and then noted which quarterbacks had the largest disparity between those.  On one side, you have  Tom Brady, C.J. Beathard, and Jared Goff.  On the other side you have Blake Bortles, Kirk Cousins, and Eli Manning.

Anyone want to guess which trio of quarterbacks was throwing short left at a disproportionately high rate?  If you guessed the quarterbacks coached by Bill Belichick, Kyle Shanahan, and Sean McVay, you are correct.

Now, I don’t know enough to say that there is a definite market inefficiency that can be exploited. But after seeing the results from this table, I am now more inclined to think that there is one.

{ 0 comments }

Russell Wilson has been with the Seahawks for 7 seasons, and in 5 of those years, there has been a large discrepancy between how well Seattle has passed and how often the Seahawks have passed.

In 2018, the Seahawks ranked 7th in Adjusted Net Yards per pass Attempt and 32nd in number passing plays (pass plays plus sacks).

In 2015, the Seahawks ranked 3rd in ANY/A and 27th in pass plays.
In 2014, the Seahawks ranked 8th in ANY/A and 32nd in pass plays.
In 2013, the Seahawks ranked 5th in ANY/A and 31st in pass plays.
In 2012, the Seahawks ranked 6th in ANY/A and 32nd in pass plays.

In general, there isn’t much of a correlation between pass efficiency and pass quantity. You might think the best passing teams would pass more frequently, but game scripts force the best passing teams to pass less frequently as a counterbalancing force.

So how unusual have the Seahawks been under Wilson? The graph below shows all team seasons since 2012, and each dot represents one team. The X-Axis shows where each team ranked in ANY/A and the Y-Axis shows where each team ranked in number of pass plays. [continue reading…]

{ 1 comment }

Last year, I wrote a two-part series on how teams were using more highly drafted players. In 2017, 50% of all passes came from players selected in the top 32 of the draft, but I suspected that 2018 could be even more tilted in favor of highly drafted players. The reasons I suspected all came true, namely:

Thanks to those new starters, plus returning starters Eli Manning, Jared Goff, Matthew Stafford, Cam Newton, Jameis Winston, Alex Smith, Mitchell Trubisky, Carson Wentz, Marcus Mariota, Matt Ryan, Blake Bortles, Philip Rivers and 101 pass attempts from Blaine Gabbert – and yes, those 101 attempts were necessary — 2018 was a record-setting year.  Over half of all pass attempts in the NFL came from players drafted in the top 10 just the second time that’s happened since 1967 (the year of the common draft).
[continue reading…]

{ 0 comments }

The 20-yard shuttle is the Combine’s approach to measure an athlete’s agility, short-range explosiveness, and lateral quickness. Here’s the description from NFL.com:

The athlete starts in the three-point stance, explodes out 5 yards to his right, touches the line, goes back 10 yards to his left, left hand touches the line, pivot, and he turns 5 more yards and finishes.

As you can imagine, heavier players fare much worse in this metric, and taller players have a slight advantage, too. The best-fit formula from the 2019 Combine using height and weight as inputs is: 4.13 -0.0125 * Height (Inches) + 0.00485 * Weight (Pounds). In other words, for every 20-21 pounds a player weighs, he would be expected to take an extra tenth of a second to complete the drill. Ohio State defensive end Nick Bosa is 6’4 and weighs 266 pounds; that’s a formula for just being average in this drill. But he wound up completing the workout in just 4.14 second, but we would have projected Bosa to take an extra 0.33 seconds to finish, which means he is your 2019 Short Shuttle champion. [continue reading…]

{ 0 comments }

On Saturday, I looked at the era-adjusted leaders in completion percentage. On Sunday, I did the same for yards/attempt, on Monday, I analyzed the era-adjusted leaders in touchdown rate, and yesterday continued the analysis but for interception percentage.

I thought it would be helpful to have all the information in one place, so that’s what today’s post is.  Here’s how to read the table below.
Otto Graham threw 2,626 pass attempts, and played from 1946 to 1955. He is in the Hall of Fame. Based on the passer rating formula — where 1.00 represents league average (a 66.67 era-adjusted passer rating), and a 1.50 in each category translates to a 100.00 passer rating — Graham scored a 1.40 in completion percentage, 1.53 in yards/attempt, 1.25 in touchdown rate, and 1.53 in interception rate. If you add those four numbers and divide by 6 — yes, this is exactly how passer rating is calculated! — you get 95.2, which is Graham’s era-adjusted passer rating. The full results are below.
[continue reading…]

{ 0 comments }

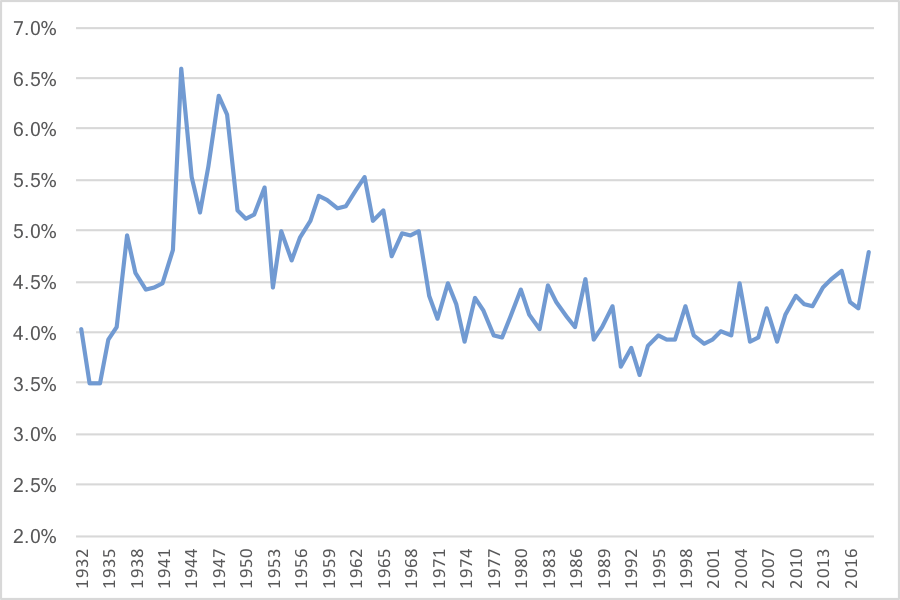
On Saturday, I looked at the era-adjusted leaders in completion percentage. Yesterday, I did the same for yards/attempt; today, we continue the analysis but for touchdown percentage.

Here’s a look at the touchdown rate in each year since 1932:

[continue reading…]

{ 0 comments }

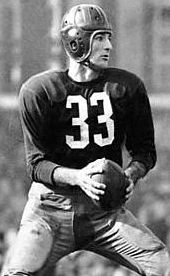
Baugh about to complete a pass, probably.

Regular readers know that I have spent some time over the past few years adjusting passer rating for era. One valuable part of the methodology is that we can also adjust each of the four component parts — completion percentage, yards per attempt, touchdown percentage, and interception percentage — for era.

Let’s take completion percentage. The passer rating formula measures completion percentage by taking a passer’s completion percentage, subtracting 30%, and multiplying the result by five. This made sense when the average completion percentage was around 50%; in that case, 50% minus 30% equals 20%, and multiplying that by 5 gives a result of 1.00.

To adjust for era, we replace “30%” in that formula with “league average minus 20%.” So in 2018, the league average completion percentage was 64.9%, which means we would use 44.9% for this formula. Drew Brees completed 74.4% of his passes; if we subtract the baseline from his result, we get 29.5%. Multiply that result by 5, and Brees gets a completion percentage score of 1.48 for 2018.

If we do this for every quarterback in every season of his career, and then weight each season by his number of pass attempts, we can get career grades. This is one way to come up with career completion percentages adjusted for era.

The overwhelming champion in this regard is Sammy Baugh, who led the NFL in completion percentage 8 times during the decade of the ’40s. As recently as 1975, Baugh was still 4th all-time in career completion percentage, and less than 1% off of the leader. Baugh has a rating of 1.58, which means on average he was better at completing passes relative to his era than Brees was in 2018.

The top passers in measuring completion percentage this way are Baugh followed by a who’s who of the completion percentage kings: Len Dawson, Otto Graham, Steve Young, Joe Montana, Sid Luckman, and Drew Brees.

The bottom 5? Rex Grossman, Jay Schroeder, Doug Williams, Mike Pagel, and the man at the very bottom of the list is… Derek Anderson. [continue reading…]

{ 0 comments }

20 Questions: Jets Uniforms Contest Results

[continue reading…]

{ 0 comments }

The broad jump is a good way to measure a player’s all-around athletic ability. As a rule of thumb, the drill is heavily biased in favor of lighter players (who can jump farther since they weigh less), but it is also biased in favor of taller players, who have longer legs. Therefore, to adjust for weight and height, we use the following formula, based on the actual 2019 results:

Projected Broad Jump = 110.31 + 0.63 * Height (Inches) – 0.164 * Weight (Pounds)

Here’s a graph showing the expected broad jump results for a player based on a variety of different heights and weights.

Last year, Virginia Tech safety Terrell Edmunds (now with the Steelers, drafted 28th overall) posted the best broad jump. This year, it was safety Juan Thornhill of Virginia — who also posted the best vertical jump — who was the broad jump champion.

At just six feet tall, Thornhill wouldn’t be expected to dominate this event, but he did, jumping a whopping 141 inches. That’s tied for the second-most over the last two decades, and easily the best by a player 6’0 or shorter. The full results below.

RkPlayerPosSchoolHeightWtExp BJBroad JumpDiff
1Juan ThornhillSVirginia7220512214119
2Miles BoykinWRNotre Dame76220122.114017.9
3Ben BanoguEDGETCU75250116.513417.5
4Emanuel HallWRMissouri7420112414117
5D.K. MetcalfWRMississippi75228120.213413.8
6Parris CampbellWROhio St.7220512213513
7Otaro AlakaLBTexas A&M75239118.413112.6
8Corey BallentineCBWashburn71196122.913512.1
9Marvell TellSUSC74198124.413611.6
10Renell WrenDLArizona State77318106.711811.3
11Ken WebsterCBMississippi71203121.713311.3
12Brian BurnsEDGEFlorida St.7724911812911
13Andre DillardOTWashington St.77315107.111810.9
14Isaiah JohnsonCBHouston74208122.813310.2
15Ed OliverDLHouston74287109.912010.1
16Darius SlaytonWRAuburn73190125.11359.9
17Jordan BrailfordEDGEOklahoma St.75252116.21269.8
18Dexter WilliamsRBNotre Dame71212120.31309.7
19Noah FantTEIowa76249117.31279.7
20Chris LindstromOLBoston College76308107.71179.3
21Justin LayneCBMichigan St.74192125.41348.6
22Travis HomerRBMiami70201121.41308.6
23Alexander MattisonRBBoise St.71221118.81278.2
24Montez SweatEDGEMississippi St.78260116.81258.2
25Mike JacksonCBMiami73210121.91308.1
26Justice HillRBOklahoma St.70198121.91308.1
27Trysten HillDLCentral Florida753081071158
28Sione TakitakiLBBYU73238117.31257.7
29Michael JordanOTOhio St.78312108.31167.7
30Jamel DeanCBAuburn73206122.51307.5
31L.J. CollierDLTCU74283110.51187.5
32Alex BarnesRBKansas St.72226118.61267.4
33Devin BushLBMichigan71234116.71247.3
34Rashan GaryDLMichigan76277112.81207.2
35Yosh NijmanOTVirginia Tech79324106.91147.1
36Lonnie JohnsonCBKentucky742131221297
37Blake CashmanLBMinnesota73237117.41246.6
38Sheldrick RedwineSMiami72196123.51306.5
39Hakeem ButlerWRIowa St.77227121.61286.4
40Ty SummersLBTCU73241116.81236.2
41Gary JenningsWRWest Virginia73214121.21275.8
42Isaiah PrinceOTOhio St.78305109.41155.6
43Kevin GivensDLPenn St.73285109.51155.5
44T.J. HockensonTEIowa77251117.61235.4
45Jordan BrownCBSouth Dakota St.72201122.71285.3
46Trey PipkinsOTSioux Falls78309108.81145.2
47Cameron SmithLBUSC74238117.91235.1
48Greg LittleOTMississippi773101081135
49Maxx CrosbyDLEastern Michigan772551171225
50Andrew Van ginkelLBWisconsin752411181235
51Kris BoydCBTexas71201122.11274.9
52Bobby OkerekeLBStanford73239117.11224.9
53Kahale WarringTESan Diego St.77252117.51224.5
54Jordan JonesLBKentucky74234118.51234.5
55Derrek ThomasCBBaylor75189126.61314.4
56Travis FulghamWROld Dominion74215121.71264.3
57Foster MoreauTELSU76253116.71214.3
58Jamal DavisEDGEAkron75243117.71224.3
59Quinnen WilliamsDLAlabama75303107.91124.1
60John CominskyDLCharleston77286111.91164.1
61Donovan WilsonSTexas A&M721991231274
62Jerry TilleryDLNotre Dame78295111.11153.9
63Greg GainesDLWashington73312105.11093.9
64Connor McGovernOLPenn St.77308108.31123.7
65Tyler JonesOTNorth Carolina St.75306107.41113.6
66Miles SandersRBPenn St.71211120.41243.6
67Drue TranquillLBNotre Dame74234118.51223.5
68Terry McLaurinWROhio St.72208121.51253.5
69Darnell SavageSMaryland71198122.61263.4
70Trevon WescoTEWest Virginia75267113.81173.2
71Iosua OpetaOLWeber St.76301108.81123.2
72Ben Burr-KirvenLBWashington72230117.91213.1
73Karan HigdonRBMichigan692061201233
74David MontgomeryRBIowa St.702221181213
75Kaleb McGaryOTWashington79317108.11112.9
76William SweetOTNorth Carolina78313108.11112.9
77Alize MackTENotre Dame76249117.31202.7
78Porter GustinEDGEUSC76255116.41192.6
79Phil HaynesOLWake Forest76322105.41082.6
80Wyatt RayEDGEBoston College75257115.41182.6
81Saquan HamptonSRutgers73206122.51252.5
82Nkeal HarryWRArizona State74228119.51222.5
83Stanley MorganWRNebraska72202122.51252.5
84Amani HookerSIowa71210120.61232.4
85Gary JohnsonLBTexas72226118.61212.4
86Derrick BaityCBKentucky74197124.61272.4
87Anthony NelsonDLIowa79271115.61182.4
88Dalton RisnerOTKansas St.77312107.61102.4
89Byron CowartDLMaryland75298108.71112.3
90Sean BuntingCBCentral Michigan72195123.71262.3
91Emeke EgbuleLBHouston74245116.71192.3
92David LongLBWest Virginia71227117.81202.2
93Max ScharpingOTNorthern Illinois78327105.81082.2
94Josh AllenEDGEKentucky77262115.81182.2
95Blace BrownCBTroy72194123.81262.2
96Charles OmenihuDLTexas77280112.91152.1
97Deebo SamuelWRSouth Carolina71214119.91222.1
98Damien HarrisRBAlabama702161191212
99Darrell HendersonRBMemphis682081191212
100Oshane XiminesEDGEOld Dominion75253116.11181.9
101Carl GrandersonEDGEWyoming77254117.21191.8
102Bisi JohnsonWRColorado St.72204122.21241.8
103Joshua MilesOTMorgan St.77314107.31091.7
104Elgton JenkinsOLMississippi St.76310107.31091.7
105Trayveon WilliamsRBTexas A&M68206119.41211.6
106Lj ScottRBMichigan St.72227118.41201.6
107Nick BosaDLOhio St.76266114.61161.4
108Jazz FergusonWRNorthwestern St. (LA)77227121.61231.4
109A.J. BrownWRMississippi72226118.61201.4
110Benny SnellRBKentucky70224117.71191.3
111Nate DavisOLCharlotte75316105.71071.3
112Devin WhiteLBLSU72237116.81181.2
113Tyrel DodsonLBTexas A&M72237116.81181.2
114Davante DavisCBTexas74202123.81251.2
115Christian WilkinsDLClemson75315105.91071.1
116Keenen BrownTETexas St.74250115.91171.1
117Jaylen SmithWRLouisville742191211221
118Christian MillerEDGEAlabama752471171181
119Jamal CustisWRSyracuse76214123.11240.9
120Justin HollinsEDGEOregon77248118.11190.9
121Dre GreenlawLBArkansas71237116.21170.8
122Daylon MackDLTexas A&M73336101.21020.8
123Terrill HanksLBNew Mexico St.74242117.21180.8
124Ryan ConnellyLBWisconsin74242117.21180.8
125Tyree JacksonQBBuffalo79249119.21200.8
126Marquise BlairSUtah73195124.31250.7
127Kingsley KekeDLTexas A&M75288110.31110.7
128Will HarrisSBoston College73207122.31230.7
129Ryan DavisWRAuburn70189123.41240.6
130Zedrick WoodsSMississippi71205121.41220.6
131Sutton SmithEDGENorthern Illinois72233117.41180.6
132Daniel WiseDLKansas75281111.51120.5
133Alex WesleyWRNorthern Colorado72190124.51250.5
134Chase WinovichEDGEMichigan75256115.61160.4
135Riley RidleyWRGeorgia73199123.71240.3
136Mack WilsonLBAlabama73240116.91170.1
137Ashton DulinWRMalone University (Ohio)732151211210
138Zach AllenDLBoston College76281112.1112-0.1
139Tony PollardRBMemphis72210121.2121-0.2
140Cody FordOTOklahoma76329104.2104-0.2
141Jackson BartonOTUtah79310109.2109-0.2
142Tyler RoemerOTSan Diego St.78312108.3108-0.3
143Andrew WingardSWyoming72209121.4121-0.4
144Alec IngoldFBWisconsin73242116.6116-0.6
145Anthony JohnsonWRBuffalo74209122.6122-0.6
146Trayvon MullenCBClemson73199123.7123-0.7
147Dan GodsilLSIndiana76241118.7118-0.7
148Jordan MillerCBWashington73186125.8125-0.8
149Elijah HolyfieldRBGeorgia70217118.8118-0.8
150Oli UdohOTElon77323105.8105-0.8
151Montre HartageCBNorthwestern71190123.9123-0.9
152Josh OliverTESan Jose St.77249118117-1
153Deion CalhounOLMississippi St.74310106.1105-1.1
154Evan WorthingtonSColorado74212122.2121-1.2
155Diontae JohnsonWRToledo70183124.4123-1.4
156Johnnie DixonWROhio St.70201121.4120-1.4
157Dre'Mont JonesDLOhio St.75281111.5110-1.5
158Erik McCoyOLTexas A&M76303108.5107-1.5
159Khalen SaundersDLWestern Illinois72324102.5101-1.5
160Easton StickQBNorth Dakota St.73224119.6118-1.6
161Germaine PrattLBNorth Carolina St.74240117.6116-1.6
162Andy IsabellaWRMassachusetts69188122.9121-1.9
163D'Cota DixonSWisconsin70204120.9119-1.9
164Dillon MitchellWROregon73197124122-2
165Drew SampleTEWashington77255117115-2
166Julian LoveCBNotre Dame71195123.1121-2.1
167Cody BartonLBUtah74237118.1116-2.1
168Jaquan JohnsonSMiami70191123.1121-2.1
169Khari WillisSMichigan St.71213120.1118-2.1
170Myles GaskinRBWashington69205120.2118-2.2
171Devin SingletaryRBFlorida Atlantic67203119.2117-2.2
172Dakota AllenLBTexas Tech73232118.2116-2.2
173Daniel JonesQBDuke77221122.6120-2.6
174Jeff AllisonLBFresno St.71228117.6115-2.6
175Saivion SmithCBAlabama73199123.7121-2.7
176John BattleSLSU72201122.7120-2.7
177Nick BrossetteRBLSU71209120.8118-2.8
178Malik CarneyEDGENorth Carolina74251115.8113-2.8
179Gerri GreenEDGEMississippi St.76252116.9114-2.9
180David LongCBMichigan71196122.9120-2.9
181Tytus HowardOTAlabama St.77322106103-3
182Michael DeiterOLWisconsin77309108.1105-3.1
183Jamarius WayWRSouth Alabama75215122.3119-3.3
184Amani OruwariyeCBPenn St.74205123.3120-3.3
185Garrett BradburyOLNorth Carolina St.75306107.4104-3.4
186Gardner MinshewQBWashington St.73225119.4116-3.4
187James WilliamsRBWashington St.69197121.5118-3.5
188Kendall BlantonTEMissouri78262116.5113-3.5
189Chauncey Gardner-JohnsonSFlorida71210120.6117-3.6
190Hjalte FroholdtOLArkansas77306108.6105-3.6
191Cody ThompsonWRToledo73205122.7119-3.7
192Kelvin HarmonWRNorth Carolina St.74221120.7117-3.7
193Dennis DaleyOTSouth Carolina77317106.8103-3.8
194Jalen JelksEDGEOregon77256116.8113-3.8
195Byron MurphyCBWashington71190123.9120-3.9
196Alijah HolderCBStanford73191125121-4
197Jace SternbergerTETexas A&M76251117113-4
198Hamp CheeversCBBoston College69169126.1122-4.1
199Joe JacksonDLMiami76275113.1109-4.1
200Andre JamesOTUCLA76299109.1105-4.1
201Mitch WishnowskyPUtah74218121.2117-4.2
202Rock Ya-SinCBTemple72192124.2120-4.2
203Jonathan LedbetterDLGeorgia76280112.3108-4.3
204Paul AdamsOTMissouri78317107.5103-4.5
205Cece JeffersonEDGEFlorida73266112.7108-4.7
206Mecole HardmanWRGeorgia70187123.7119-4.7
207Lil'Jordan HumphreyWRTexas76210123.7119-4.7
208Damarkus LodgeWRMississippi74202123.8119-4.8
209Qadree OllisonRBPittsburgh73228118.9114-4.9
210Jordan ScarlettRBFlorida71208120.9116-4.9
211Ryquell ArmsteadRBTemple71220119114-5
212Mike BellSFresno St.75210123.1118-5.1
213Deandre BakerCBGeorgia71193123.4118-5.4
214Johnathan AbramSMississippi St.71205121.4116-5.4
215Jakobi MeyersWRNorth Carolina St.74203123.6118-5.6
216Deshaun DavisLBAuburn71234116.7111-5.7
217Caleb WilsonTEUCLA76240118.8113-5.8
218David SillsWRWest Virginia75211122.9117-5.9
219Tyre BradyWRMarshall75211122.9117-5.9
220Ryan BatesOLPenn St.76306108102-6
221Ugo AmadiSOregon69199121.1115-6.1
222Keesean JohnsonWRFresno St.73201123.3117-6.3
223Rashad FentonCBSouth Carolina71193123.4117-6.4
224Brett RypienQBBoise St.74210122.5116-6.5
225Jake BaileyPStanford73200123.5117-6.5
226Albert HugginsDLClemson75305107.5101-6.5
227Taylor RappSWashington72208121.5115-6.5
228Nick FitzgeraldQBMississippi St.77226121.7115-6.7
229Zack BaileyOLSouth Carolina77299109.8103-6.8
230Chris SlaytonDLSyracuse76307107.8101-6.8
231Emmanuel ButlerWRNorthern Arizona75217122115-7
232Mitch HyattOTClemson77303109.1102-7.1
233Irv SmithTEAlabama74242117.2110-7.2
234Zach GentryTEMichigan80265117.2110-7.2
235Ryan FinleyQBNorth Carolina St.76213123.2116-7.2
236Malik GantSMarshall72209121.4114-7.4
237Antoine WesleyWRTexas Tech76206124.4117-7.4
238Trace McSorleyQBPenn St.72202122.5115-7.5
239Joe Giles-HarrisLBDuke74234118.5111-7.5
240Jonathan CrawfordSIndiana73205122.7115-7.7
241Dru SamiaOTOklahoma77305108.8101-7.8
242Terry GodwinWRGeorgia71184124.9117-7.9
243Lukas DenisSBoston College71190123.9116-7.9
244Darius WestSKentucky71208120.9113-7.9
245Jack FoxPRice74213122114-8
246Dax RaymondTEUtah St.77255117109-8
247Hunter RenfrowWRClemson70184124.2116-8.2
248Demarcus ChristmasDLFlorida St.75294109.3101-8.3
249Jonah WilliamsOTAlabama76302108.7100-8.7
250Drew LockQBMissouri76228120.8112-8.8
251Jovon DuranteWRFlorida Atlantic71160128.8120-8.8
252Kaden SmithTEStanford77255117108-9
253Javon PattersonOLMississippi75307107.298-9.2
254Will GrierQBWest Virginia74217121.3112-9.3
255Ryan PulleyCBArkansas71209120.8111-9.8
256David EdwardsOTWisconsin78308108.999-9.9
257Nyqwan MurrayWRFlorida St.70191123.1113-10.1
258Jake BrowningQBWashington74211122.3112-10.3
259Jarrett StidhamQBAuburn74218121.2110-11.2
260Isaiah BuggsDLAlabama75306107.496-11.4
261Terry BecknerDLMissouri76296109.698-11.6
262Jordan Ta'amuQBMississippi75221121.3109-12.3
263Nate HerbigOLStanford75335102.690-12.6
264Kyle ShurmurQBVanderbilt76230120.5106-14.5
265Devon JohnsonOTFerris St.79338104.689-15.6
266Derwin GrayOTMaryland76320105.790-15.7
{ 0 comments }

Yesterday, I looked at rushing success rate for individual running backs. Today, I perform the same analysis for running backs, but at the team level (and ignoring runs by non-RBs).

Here’s how to read the table below. The Rams led the NFL in rushing success rate by running backs last season. Los Angeles RBs had 363 carries (after removing 3rd or 4th and long runs that did not pick up a first down) and 228 of them were successful, a 62.8% conversion rate. That was the best rate in the NFL. As noted yesterday, Todd Gurley was great (60.2%), but the other Rams running backs had even higher rates. It was truly a remarkable rushing attack in Los Angeles last year, at least until the NFC Championship Game and the Super Bowl. [continue reading…]

{ 1 comment }

Blount getting tackled, per usual

On Wednesday, I looked at all running backs with at least 100 carries. Then, for those running backs who averaged over 4.41 yards per carry (the average YPC for that group), I asked the question: how many of the best rushes would you need to discard for each running back to have an average (or worse) YPC average?

The answer was not many. For Todd Gurley and Gus Edwards, who led the league in this metric, the answer was just 6 runs. Taking away Gurley’s 6 best carries dropped his YPC average to 4.34; taking away his 5 best would have dropped his YPC to “only” 4.43, so you need to take away his best 6 carries to get him to average or below.

But what about the reverse? If we look at all running backs with at least 100 carries who averaged fewer than 4.41 yards per carry, how many of their worst rushes would you need to discard to get that running back to average or better?

The leader in this category is LeGarrette Blount, and it wasn’t particularly close. In 2018, the Lions running back rushed 154 times for just 418 yards, an abysmal 2.71 YPC average. [continue reading…]

{ 0 comments }

You can hear me on the Bill Barnwell podcast today discussing the Jets, Le’Veon Bell, and the running back posts I’ve done this week.

Listen here

Or on iTunes

My segment begins at 30:39

{ 0 comments }

About 12 years ago, Doug and I wrote about where the league leaders in attempts ranked in yards, and vice versa. I only remember one thing about that post, and it’s about Jon Kitna. You probably don’t spend much time thinking about Jon Kitna these days, but here’s one of the quirkiest stats in NFL history.

In 2001, Jon Kitna led the NFL in pass attempts, but ranked 16th in passing yards.

That’s really, really hard to do. He averaged just 5.5 yards per pass attempt, among the worst performances by any passer in the last two decades.

Cincinnati actually had a remarkable set of weapons: Darnay Scott was 29, Corey Dillon was 27, Peter Warrick was 24, T.J. Houshmandzadeh was 24, and Chad Johnson was 23.  Johnson and Houshmandzadeh were rookies, though, and far away from becoming the players they would become, while Scott was at the tail end of a good career. The Bengals even had a pair of strong blockers in FB Lorenzo Neal and TE Tony McGee.  The offensive coordinator was Bob Bratkowski – who was in his first year in Cincinnati, but would remain until 2010 – while the head coach was Dick LeBeau. The next season, Kitna averaged 6.7 yards per pass attempt: he threw for nearly the same amount of yards, but on 108 fewer attempts.

But his 2001 season is a performance that is unlikely to ever be matched. The graph below shows where the league leader in pass attempts in each season ranked in passing yards. It should be pretty easy to understand, and even easier to find Kitna. [continue reading…]

{ 0 comments }
Next Posts Previous Posts