≡ Menu

Pittsburgh’s Aaron Donald Was Your Combine MVP

Building on yesterday’s post, I decided to crown a combine MVP because it’s February and there’s nothing else to do. I looked at each player’s combine results, courtesy of the great NFLSavant.com, in four different tests.

40-yard dash

There were 268 players with 40-yard dash times posted at NFL Savant. I ran a regression using weight as the input and 40-yard time as the output, and the best-fit formula (R^2 of 0.75) was:

[math]Expected 40 Time = 3.433 + 0.00554 * Weight[/math]

Using this formula, Jadeveon Clowney, with a weight of 266 pounds, would be projected to run the 40 in 4.91 seconds. Since he actually ran the 40 in 4.53 seconds, he gets credited for finishing +0.38 seconds above expectation. That was the best of any player in Indianapolis this year. The table below shows, for each of the 268 players (the table, by default, displays only the top 10, but you can change that in the dropdown box), their weight, their actual 40 time, their expected 40 time, and the difference. Auburn tackle Greg Robinson hopes be a top-five pick, and his 40 time does a good job displaying his athleticism. Pittsburgh’s Aaron Donald comes in third, but there will be plenty of reasons to talk about him later. [continue reading…]

{ 20 comments }

Love the Bowl Championship Series or (more likely) hate it, tonight marks the end of college football’s 16-year BCS experiment. Designed to bring some measure of order to the chaotic state college football had been in under the Bowl Alliance/Coalition, the BCS did streamline the process of determining a national champion — though it was obviously not without its share of controversies either.

If various opinion polls conducted over the years are any indication, the public is ready to move on from the BCS to next season’s “plus-one”-style playoff system. But before it bids farewell forever, how does the BCS grade out relative to other playoff systems in terms of selecting the best team as a champion?

Back in 2008, I concluded that it didn’t really do much worse of a job than a plus-one system would have. But that was more of an unscientific survey of the 1992-2007 seasons than a truly rigorous study. Today, I plan to take a page from Doug’s book and use the power of Monte Carlo simulation to determine which playoff system sees the true best team win the national title most often.

(Note: If you just want the results and don’t want to get bogged down in the details, feel free to skip the next section.) [continue reading…]

{ 21 comments }

Which Four Teams Would Make a College Playoff in 2013?

We can officially declare the BCS dead (1998-2013). As it turns out, the final edition of the BCS rankings was not controversial. It took awhile, but with the losses by Ohio State and Northern Illinois, Florida State was the only team in the Football Bowl Subdivision to finish the year without a blemish. The champion of the Pac-12 had two losses, while the one loss champions of the Big 12 (blowout loss) and Big 10 (one win against a team in the SRS top 25) had unimpressive resumes compared to the one-loss SEC Champion (4-1 record against teams in the SRS top 25). No team distinguished itself from the AAC or any other the other conferences, nor did any of the independent teams. That left the voters with two easy choices to fill two slots.

But starting next season, there will be a four-team playoff in college football. In general and on average, a four-team playoff is preferable to a two-team playoff: leaving out the fifth best team is easier to stomach than leaving out the third place team. A four-team playoff may not be ideal, but it’s the system we will have. So which teams would be deserving of the third and fourth golden tickets if the playoffs began in 2013?

There are only four legitimate candidates: Alabama, Stanford (Pac-12 champion), Baylor (Big 12 champion), and Michigan State (Big 10 champion). Any other team could be dismissed quickly: Fresno State, Northern Illinois, Central Florida, and Louisville each lost just one game, but easy schedules make that accomplishment less impressive. Among two-loss teams, Stanford had the most difficult schedule and was the only to win its conference: South Carolina, Missouri, Oklahoma, Oklahoma State, and Clemson were good teams, but don’t have elite resumes. The two teams that could make the best case would be Oregon and Ohio State, but both teams can’t make credible arguments after losing their conference to another team in consideration. [1]I will leave the argument as to whether head-to-head is the best tiebreaker, particularly between Ohio State and Michigan State, for another day. Which team you would pick out of those four would say more about the voter than the team in question. But before we go through the criteria, first, the final college football SRS ratings. [continue reading…]

References

References
1 I will leave the argument as to whether head-to-head is the best tiebreaker, particularly between Ohio State and Michigan State, for another day.
{ 2 comments }

Let’s just assume that Auburn defeats Missouri this afternoon and Ohio State defeats Michigan State tonight. Which team would have pulled off the more impressive feat: Ohio State, going undefeated against a relatively easy schedule, or Auburn going 12-1 against a harder schedule? That’s a tricky question to answer, but here is one way to think about it.

To make the math easier for everyone — and the answer won’t be practically different otherwise — let’s eliminate the eight easiest games on each team’s schedule. For Ohio State, that means elminating wins over Florida A&M, Purdue, San Diego State, California, Buffalo, Illinois, Penn State, and Indiana. For Auburn, we remove wins over Western Carolina, Arkansas State, Florida Atlantic, Arkansas, Mississippi State, Washington State, Tennessee, and Mississippi. A team arguing that it should be the #2 team in the country is going to win those games over 95% of the time. Granted, this slightly disadvantages the Tigers as they had a slightly harder bottom eight, but you can include those games if you want to do more heavy lifting. For now, let’s just focus on each team’s toughest five games.

Ohio State will have gone undefeated against Wisconsin, Michigan State, Michigan, Iowa, and Northwestern. Is that more or less impressive than going 4-1 against Alabama, Missouri, LSU, Texas A&M, and Georgia? One way to can answer this question is by looking at a team’s win probability in each game.

Let’s assume that Ohio State has an SRS rating of 62.1. Why that number? You’ll see why in a minute. When the Buckeyes hosted the Badgers (SRS of 53.8), how likely was Ohio State to win? If we give three points for home field, that would make the Buckeyes 11.3-point favorites. And we can use the following formula to determine how likely an 11.3-point favorite is to win a given game:

(1-NORMDIST(0.5,-(home_fav),13.86,TRUE)) + 0.5*(NORMDIST(0.5,-(home_fav),13.86,TRUE) – NORMDIST(-0.5,-(home_fav),13.86,TRUE))

Based on this formula, an 11.3-point favorite would win 79.2% of the time. Against Michigan State (48.8), Ohio State would be a 13.3 point favorite if the Buckeyes had an SRS rating of 62.1, which translates into an 83.1% win probability. For Michigan, Iowa, and Northwestern, the spreads and win probabilities would be 15.4/86.7%, 20.3/92.8%, and 22.6/94.8%, respectively.

Now, what are the odds that Ohio State would win all five of those games? That is simply the product of 79.2%, 83.1%, 86.7%, 92.8%, and 94.8% — which is 50%. That’s not a coincidence, of course: the reason I picked 62.1 is because that’s what rating Ohio State would need to have in order to have a 50% chance of going undefeated against those five teams. In reality, the Buckeyes have a rating of 56.1, which indicates that — like just about every undefeated team — they were a little bit lucky to go undefeated (assuming, of course, that they beat Michigan State).

Now, let’s use that same 62.1 rating number to go through Auburn’s schedule. At home against Alabama (rating of 56.4), a team with an SRS rating of 62.1 would be a 5.7-point favorite, and have a 65.9% chance of winning. In Atlanta against Missouri (55.7), the team would be a 6.4-point favorite, and have a 67.8% chance of success. The team would be 8 point favorites in Baton Rouge — the game Auburn lost — against LSU (51.1), and have a 71.8% chance of winning. The games at Texas A&M (48.9) and at home against Georgia (48.5) would have 76.9% and 88.4% chances of victory.

Now, the odds of winning all five of those games is just 21.8%, which is a very long-winded, mathematical way of saying what we all know: Auburn faced a harder schedule. But what are the odds of going 5-0 or 4-1 against that schedule? Well, the odds of going 4-1 is just a bit more complicated.

    • The probability of beating Missouri, LSU, A&M, and Georgia, but losing to Alabama, is 11.3%;
    • The probability of beating Alabama, LSU, A&M, and Georgia, but losing to Missouri, is 10.4%;
    • The probability of beating Alabama, Missouri, A&M, and Georgia, but losing to LSU, is 8.6%;
    • The probability of beating Alabama, Missouri, LSU, and Georgia, but losing to A&M, is 6.6%; and
    • The probability of beating Alabama, Missouri, LSU, and A&M, but losing to Georgia, is 2.9%.

Therefore, the likelihood of going 4-1 is 39.6%; that means the likelihood of a team with an SRS rating of 62.1 going 4-1 or 5-0 against those five teams is 61.4%. While there are many assumptions implicit in this post, the conclusion is that it is harder to do what Ohio State will do if it wins tonight than what Auburn will do.  Adding in the bottom 8 opponents for each team won’t change the numbers much (you can run the numbers using the above formula).

What would change the numbers is changing the ratings of some of the team’s opponents.  If, for example, Alabama had a rating of 69 instead of 56.4, then a team of a a quality equal to 62.1 would win that game only 38.9% of the time, and the odds of going 4-1 or 5-0 against that schedule would be 50/50. But that’s a pretty significant increase to Alabama’s grade, of course.

For a team to have a 50% chance of winning at least four out of five games against Alabama, Missouri, LSU, A&M, and Georgia, they would need a rating of 59.8. But a team with a rating of 59.8 would only have a 40.5% chance of not dropping a game to Wisconsin, Michigan State, Michigan, Iowa, or Northwestern.

Of course, I’ve followed college football long enough to not wait until Sunday to make this post. That’s because there is only a 30% chance of both Ohio State and Auburn winning today. We could perform the same analysis for Missouri, but the results would only look worse for the SEC crowd, as those Tigers have had an easier schedule than Auburn.  Assuming a rating of 62.1, a team would have a 36.8% chance of beating Auburn, Georgia, South Carolina, A&M, and Ole Miss, and a 78.0% chance of winning at least four of those games. In fact, a team would only need a rating of 56.0 to have even odds of going 5-0 against those teams.

The more interesting case, however, is Florida State. Assuming a rating of 62.1, the Seminoles would have a 69.8% chance of winning in Clemson, and then over a 90% chance of winning every other game (Duke will be the second toughest game of the year for FSU). That means a 62.1 SRS team would have a 53.0% chance of going 5-0 against Clemson, Duke, Florida, Pittsburgh, and Boston College; a team that had only a 50% chance would need a rating of 61.4, slightly lower than what Ohio State has produced.

That doesn’t mean Ohio State is more deserving of a spot than Florida State in the BCS National Championship Game, as FSU’s dominance is an element that can’t be overlooked. But I wouldn’t argue with you if you said that it was easier for FSU to go undefeated than it is for Ohio State.

{ 5 comments }

Week 14 College Football SRS Ratings & The Iron Bowl

We are out of words. You should be dead, Auburn, because we saw you die. And here you are, breathing in the flesh, able to say this: you made the Alabama Crimson Tide kick the winning touchdown for you.

It’s hard to top that recap from EDSBS of one of the greatest games in college football history. Two weeks after pulling off the ending of the season — the Prayer at Jordan-Hare — Auburn gave us the ending of our lives. Entering week 14, Alabama had fielded the best special teams in the nation; on Saturday, all of the Tide’s goals were ripped from them following three missed field goals and a game-winning field goal return touchdown.

Toomer's Corner.

In a second, Alabama lost to its most bitter rival. With that, the Tide lost the SEC West division title, which means the team won’t have a chance to win the SEC Championship or the BCS Championship (barring the unthinkable). In an odd twist, the most dominant team of our era has now won just one division title in the last four years.

Of course, the SRS is not so sensitive to missed field goals that are returned for touchdowns. The Crimson Tide ranked third in last week’s SRS, a ranking which felt one spot too low. Following the Iron Bowl loss, Alabama’s rating dropped from 61.1 to 59.4, moving Nick Saban’s team down to… third. The beauty of a predictive system is that it need not change due to a close road loss to a top team, and that’s what happens here. Auburn jumps from 14 to 11 but no higher, as a 14-point road loss to LSU, a 4-point home win against MSU, and a 7-point home win against Washington State still count.

Ohio State, in fact, actually drops one slot, as the close win in Ann Arbor dropped the Buckeyes behind idle Oklahoma State. Does that mean the Buckeyes don’t deserve to be in the BCS National Championship Game if they defeat Michigan State? Of course not. Last year, Notre Dame was ranked 6th on December 9th in the SRS, but the Fighting Irish surely deserved a spot in the BCSNCG by virtue of being the lone undefeated (and eligible) team in college football. Ohio State deserves the same treatment this year.
[continue reading…]

{ 13 comments }

FCS Playoffs Preview

I’ll be honest: I know nothing about FCS football. But that’s what the SRS is for! If you want to read a real FCS playoff preview, SB Nation has a good one, as does the Sports Network, but let’s be honest, I have no idea how good those previews are. If you were to tell me that SB Nation just made up the name “Terrence West”, I couldn’t offer a counterargument.

That said, here is what the SRS says about the first round of the playoffs. Here’s how to read the table below: South Dakota State has an SRS rating of 30.1, the 8th best among FCS schools. In the first round of the playoffs, they go on the road to face Northern Arizona, which has an SRS rating of 23.5, the 27th best school in the FCS. As a result, the projected Margin of Victory – always shown from the perspective of the home team, is 3.6 points in the favor of the visitors. The table is sorted in terms of Game Quality, in case you need to determine which one of these games to watch. Game Quality is a proprietary statistic which meas… nah, even I’m not that crazy. The Game Quality rank is just a combination of the average SRS ratings of the two teams and the projected competitiveness of the game.

GQVisitorSRS RatingFCS RkHomeSRS RatingFCS RkProj MOV
1South Dakota St30.18Northern Arizona23.527-3.6
2Bethune-Cookman24.626Coastal Carolina27.5125.9
3Samford22.930Jacksonville St25.5215.6
4Furman18.943South Carolina St23.3297.4
5Southern Utah17.346Sam Houston St25.22310.9
6Lafayette16.352New Hampshire26.41613.1
7Sacred Heart15.354Fordham23.42811.1
8Tennessee St2524Butler8.973-13.1

[continue reading…]

{ 4 comments }

Oklahoma State won one for the Drinen

Oklahoma State won one for Drinen.

Every year, a few mind-blowing upsets occur this time of year, and every year, we are shocked when it happens. Three of the top five single game performances of the season occurred on Saturday, including the best individual game rating of the year. Oklahoma State’s blowout win against Baylor produced an SRS score of 88.5, topping Florida State’s win at Clemson by three points. Meanwhile, Arizona shocked Oregon, giving the Wildcats (82.9 score) just the third 80+ point SRS rating in a game in 2013. And in less exciting but still noteworthy news: Washington crushed Oregon State (#27 in last week’s SRS ratings) in Corvalis, 69-27.

It looks like we’re headed for a Florida State-Alabama showdown in the BCS National Championship Game. FSU’s last two games should not pose any issues: the Seminoles are rated 27 points higher than Florida, and will be a three-touchdown favorite in the ACC Championship Game. In fact, the difference between the ratings of Florida and Georgia Southern is smaller than the difference between Florida and Florida State (you can view the ratings of FCS teams here). And we’ll get to that Georgia Southern game in a minute.

For Alabama, the schedule is a little more challenging. The Tide are “only” 9 points ahead of Auburn in the SRS, but that’s a little misleading. If we remove Alabama’s games against Colorado State, Georgia State, Chattanooga, Kentucky, and Tennessee — all games the Tide won by over 21 points — their rating would jump to 64.4. For Auburn, the only team they beat by more than three touchdowns that lowered their rating was Western Carolina; do that, and the Tigers are at 52.9. That puts Alabama 11.5 points better than Auburn. The Iron Bowl is in Auburn this year, and the Tigers are 10.5 point underdogs, so perhaps the SRS is still underrating the Tide by a point or two. An SEC Championship Game against Missouri would be another tough test, but first, those Tigers must defeat Johnny Manziel and the Aggies to earn a trip to Atlanta.

Below are the SRS ratings through 13 weeks. As always, thanks to Dr. Peter Wolfe for providing the final scores for every college football game. [continue reading…]

{ 2 comments }

Comparing the schedules of Ohio State and Baylor

In the unlikely event that either Alabama or Florida State drop a game, Ohio State and Baylor will each have very good arguments that they deserve to move into the top two of the BCS standings. Through 12 weeks, Baylor ranks higher than Ohio State in the SRS ratings thanks to a higher margin of victory and strength of schedule. But I want to delve into the SOS argument a little bit more today.

First, let’s just assume each team wins out, even though that’s no sure thing. Ohio State defeated Indiana today, but still must beat Michigan and Michigan State. Baylor plays Oklahoma State tonight, and then has Texas Tech and Texas to close the year. But let’s assume both schools finish the year undefeated: who will have faced the harder schedule?

Baylor plays every team in the Big 12 — giving the Bears 9 conference games — and faced Buffalo, an FCS school, and a Sun Belt school (Louisiana-Monroe). Ohio State will also play 9 conference games, including the Big 10 championship — and conveniently also played Buffalo and an FCS school, along with a Mountain West team (San Diego State), and California.

We can obviously throw out the games against Buffalo and the FCS school. Louisiana-Monroe ranks 106th and Cal ranks 96th, so those two games are a wash. Since beating San Diego State (78th in the SRS) is nothing special, picking between Baylor and OSU predictably turns into a referendum on the Big 12 and Big 10. So let’s look at the SRS ratings of each of the conference opponents and San Diego State for the Buckeyes and Bears.

Here’s how to read the first line. The toughest opponent for Baylor (after adjusting for home field) is Oklahoma State, who Baylor plays tonight in Stillwater. The Cowboys have an SRS rating of 54.8. The toughest opponent for Ohio State was Wisconsin, who the Buckeyes played at home, and the Badgers have an SRS rating of 57.4. After accounting for home field, that means Baylor’s toughest game was 3.4 points harder than Ohio State’s (54.8 + 3 – (57.4 -3) ).

RkBaylor OpponentH/RSOSOSU OpponentH/RH/RDiff
1Oklahoma StRoad54.8WisconsinHome57.43.4 (Baylor)
2Kansas StRoad49.1Michigan StIndianapolis47.84.3 (Baylor)
3OklahomaHome46.3MichiganRoad42.72.3 (OSU)
4TCURoad40.1NorthwesternRoad38.61.5 (Baylor)
5Texas TechArlington42.4IowaHome43.42.0 (Baylor)
6TexasHome44.3IndianaHome39.35.0 (Baylor)
7West VirginiaHome34.6IllinoisRoad334.4 (OSU)
8KansasRoad27.7Penn StateHome36.52.9 (OSU)
9Iowa StHome29San Diego StHome31.22.2 (OSU)
100PurdueRoad19.9----

By this measure, Baylor’s toughest two games were harder than Ohio State’s toughest two games (although if you ignore home field, you’d argue that Ohio State faced the toughest opponent). Ohio State gets credit for having the third toughest game, but at each of the next three slots, the Bears have the SOS edge.

At the bottom of the schedule, the Buckeyes pick up some ground, but I don’t think the back end of the schedule is the appropriate mechanism to separate national title contenders. Yeah, Illinois, Penn State, San Diego State and Purdue is a tougher set than West Virginia/Kansas State/Iowa State, but any elite team should have no problem sweeping those games.

It’s very close, but if Baylor wins out, I’d vote for Baylor over Ohio State. The Bears clearly have the edge if you take style points into consideration, but even if you ignore margin of victory and all the statistics, I still think Baylor’s season is more impressive.  It’s close, but I’d say that an average great team would have had a harder time going undefeated against Baylor’s schedule than it would against Ohio State’s schedule.

{ 2 comments }

Week 12 College Football SRS Ratings: Auburn Stays Alive

Entering week 12, there were 7 teams with legitimate paths to the national championship. The four undefeated teams came in with cupcake games, while two of the three one-loss teams had tough challenges. So what happened?

  • Alabama was a 23-point favorite at Mississippi State (53rd in the week 11 SRS ratings). It wasn’t pretty, but the Crimson Tide left Starkville with a 20-7 win.
  • Florida State also simply needs to win out, and the Seminoles hosted Syracuse (69). FSU was a 37.5-point favorite, and the game wasn’t even that close. After one quarter, Jameis Winston was 10 for 10 for 170-yards, and the Seminoles were up 28-0, en route to a 59-3 win. That was the largest win of the week, and gives FSU four of the top nine single-game SRS scores of the season.
  • Behind the undefeated behemoths of the SEC and ACC are undefeated teams in two other major conferences: the Big 10 and Big 12. Ohio State was a 33.5-point favorite in Illinois (#74), while Baylor was a 27.5 point favorite against Texas Tech (#41) in Arlington. Ohio State jumped out to a 28-0 lead against Illinois, and won 60-35, but the game got a little close in the middle. It was only 35-21 in the third quarter, and 44-28 in the 4th, but Carlos Hyde and Braxton Miller (combined 40 carries for 430 yards and 5 touchdowns) were too much for the Illini to handle.
  • Baylor fell behind 14-0 early, but still managed to cover the spread after winning 63-34. After the hot start from the Red Raiders, the Bears scored 8 touchdowns in the next 36 minutes of game time. Quarterback Bryce Petty “struggled” in this game, which means he only completed 17 of 31 passes, but still picked up 335 yards and three touchdowns (to go along with two rushing scores). So far, the Bears have been up to the challenge as the meat of the schedule arrived in November, although the toughest test comes next week in Stillwater. The crazy part is that if it wasn’t for West Virginia, this Oklahoma State-Baylor game would be as hyped as any Big 12 game in recent memory: two explosive offenses, two undefeated teams, a B12 title and a possible BCSNCG berth on the line.
  • Three one loss teams were also knocking on the door. Stanford had the hardest SOS through 11 weeks of any team with no more than one loss, and the Cardinal owned the best win (as measured purely by SOS) of any team in the country. Stanford traveled to Los Angeles to face a USC team (#20) that had gone 4-1 since interim head coach Ed Orgeron took over for Lane Kiffin. Stanford was a 3.5-point favorite over the Trojans, but a strong fourth quarter gave USC the win. Kevin Hogan threw two late interceptions, and kicker Andre Heidari hit a 47-yarder in the final minute, completing the upset for Coach O and the Trojans. We can officially rule Stanford out of the BCS race, and absent any upsets, pencil in Oregon-Ohio State in the Rose Bowl.
  • Two one-loss SEC teams entered week 12 with quasi control-their-own-destiny fates. Missouri and Auburn know that winning out means an SEC championship and a win over Alabama. No one really knows if that would be enough to vault them into the BCS National Championship Game, but for idle MIZZOU, the debate will have to wait another week (the bye week comes at an opportune time, with Ole Miss and Johnny Manziel and Texas A&M coming up the next two weeks).
  • Auburn was a three-point home favorite against Georgia (#25), and got off to a hot start, outgaining Georgia 149 to 4 and grabbing a 10-0 lead after the first quarter. With 10 minutes left, the Tigers led 37-20, but three touchdowns in eight minutes — the last on a run by Aaron Murray on 4th-and-goal that just barely (if at all) got in — gave Georgia a 38-37 lead. All looked lost, until on 4th and 18, Nick Marshall threw a 73-yard touchdown to Ricardo Louis on the play of the year.

It didn’t take the straightest route, but after week 12, the national picture barely changed. The Iron Bowl in two weeks will be the de facto SEC West Championship Game, but more importantly it could be a quarterfinal matchup for the national title. The winner of Alabama/Auburn goes to the SEC Championship Game, which — if Missouri wins out — may be a de facto semifinal game. Whether a one-loss Auburn/Missouri gets in over an undefeated Baylor or Ohio State is tough to say, of course, although both of those teams could have a loss by then. And don’t worry: if either set of Tigers can upset Alabama, we will surely hear about how dominant the SEC is, which is very hard to argue.
[continue reading…]

{ 3 comments }

The SEC is a dominant 8-6 against BCS teams

This year, the SEC is 8-6 against BCS conferences, courtesy of:

  • A 2-2 record against the AAC (South Carolina over Central Florida, Texas A&M over SMU; Kentucky lost to Louisville and Arkansas lost to Rutgers);
  • A 2-2 record against the ACC (Alabama over Virginia Tech; South Carolina over North Carolina; Clemson over Georgia, Miami over Florida)
  • A 1-0 record against the Big 10, courtesy of a Missouri victory over Indiana
  • A 2-1 record against the Big 12 (Ole Miss over Texas and LSU over TCU, while Oklahoma State beat Mississippi State)
  • A 1-1 record against the Pac-12 (Auburn over Washington State, Oregon over Tennessee)

But if we want to do an honest analysis, we should recognize that the AAC is a BCS conference in name only: those schools are 4-12 against the other BCS conferences and Notre Dame/BYU (for the rest of this post, I will refer to ACC, Big 10, Big 12, Pac-12, SEC, Notre Dame and BYU as BCS teams), and even that is misleading. Louisville, Central Florida, and Houston are the only AAC teams in the top 70 of the SRS. Outside of Louisville and Central Florida, the AAC is 1-12 against BCS teams, with the sole win being coming when Cincinnati beat Purdue (#110 in the SRS).

So let’s leave out the AAC and just look at how the ACC, B10, B12, P12, SEC, and Notre Dame/BYU have done in games against each other.

ConfACCB10B12SECP12INDTotal
ACC--0-21-02-20-22-15-7
B102-0--1-00-12-32-27-6
B120-10-1--1-20-01-12-5
SEC2-21-02-1--1-10-06-4
P122-03-20-01-1--1-27-5
IND1-22-21-10-02-1--6-6

[continue reading…]

{ 2 comments }

Last week, the top five was Florida State, Baylor, Oregon, Alabama, and Arizona State. Florida State won big (by 56), while Baylor and Alabama won big games (against Oklahoma and LSU) by comfortable margins. Arizona State won by a point at Utah, an underrated team (despite the record, Utah ranks 24th in the SRS). Of course, the big story of the week was Stanford (who lost to Utah earlier in the year) upsetting Oregon. Oregon understandably will drop in the rankings, but this late in the season, one game doesn’t swing the SRS nearly as much. After all, each game is given the same weight. Oregon gets credited with a 50.7 SRS score for losing in Palo Alto, which essentially says for one game, the Ducks were about the 20th best team in the country. Alabama gets 69.9 points for defeating LSU at home by 21. But while the Crimson Tide move up, and moves the Ducks down, Alabama did not pass Oregon in the SRS.

Say what? Yes, the SRS still has FSU, Baylor, and Oregon ahead of Alabama. I’ll explain more in a minute, but first, the SRS ratings through eleven weeks. As a reminder, you can read about the methodology here. As always, thanks to Dr. Peter Wolfe for providing the final scores for every college football game.
[continue reading…]

{ 1 comment }

Jameis Wins a ton

Jameis Wins a ton.

The Florida State Seminoles have done everything a championship team should do. FSU obliterated a 4-0 Maryland team 63-0, the most dominant win of the first five weeks of the season. That performance has only been eclipsed by one game since: the Seminoles 51-14 victory on the road against Clemson, a team that is currently ranked 10th in this week’s version of the SRS. In week 10, FSU was a 21-point favorite against an undefeated but underwhelming Hurricanes team: the Seminoles and Jameis Winston struggled a bit early, but won 41-14. That win gives FSU three of the top nine single game performances of the season.

Of course, FSU is still on the outside looking in when it comes to the BCS. If Oregon and Alabama remain undefeated, that’s your national championship game, a matchup college football fans have been pining for each of the past few seasons. Obviously an undefeated FSU team would deserve to be in the title game, just like an undefeated Alabama and undefeated Oregon would, too. Such is life in (thankfully, the last year of) college football’s two-team playoff system. But if we’re forced to split hairs, is FSU better than Alabama and/or Oregon? And what do we make of an Ohio State team that’s now 21-0 under Urban Meyer?

Let’s start with the SRS ratings through ten weeks. As a reminder, you can read about the methodology here. As always, thanks to Dr. Peter Wolfe for providing the final scores for every college football game.
[continue reading…]

{ 4 comments }

Non-FBS College Football Ratings Through 10 Weeks

Every week, I publish my college football ratings for FBS teams. To generate those ratings – using this methodology — my program also generates ratings for non-FBS teams. Since there is less interest in those numbers, I rarely publish them, but here are the ratings through ten weeks for all non-FBS teams.
[continue reading…]

{ 5 comments }

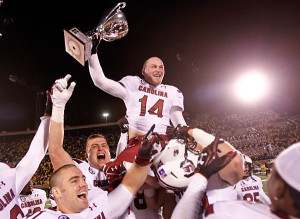
Shaw helped USC win the Battle of The Columbias Trophy. Yes, that is a real thing.

Shaw helped USC win the Battle of The Columbias Trophy. Yes, that is a real thing.

Last week, five teams emerged as the upper crust of college football. That number has dropped to four, after Missouri lost to South Carolina in typical heartbreaking style. The Tigers led 17-0 entering the fourth quarter, but that was before USC starting quarterback Connor Shaw — who had been held out due to injury — was inserted into the game. Shaw led the Gamecocks on a furious comeback to force overtime. After MIZZOU scored a touchdown on the first possession, Shaw threw his third touchdown pass on 4th-and-goal from the 16 yard line. On the second possession, USC was up first and kicked a field goal. Missouri looked to match South Carolina, but a 24-yard field goal bounced off the left upright, giving Tigers fans the gut punch loss of the season.

Elsewhere, most things went according to plan. Johnny Manziel played like a Heisman Trophy winner (25/35, 305 yards, 4 TDs, 1 INT), while Teddy Bridgewater (25/29, 344, 3, 0), Bryce Petty (20/32, 430, 3/0), and Jameis Winston (16/26, 292, 3/1) continued their dominant seasons. A couple of embattled schools pulled off impressive wins over conference rivals: Michigan State won 42-3 against Illinois, while Texas continued to put September in the rear-view mirror by stomping TCU, 30-7.

Below are the SRS ratings through nine weeks. As a reminder, you can read about the methodology here. As always, thanks to Dr. Peter Wolfe for providing the final scores for every college football game.
[continue reading…]

{ 5 comments }

Famous Jameis

Famous Jameis.

Last week, Florida State topped the SRS ratings. And that was before the Seminoles posted the single best performance of the season, winning at Clemson 51-14 on Saturday Night. They scored an 85.5 in the SRS against the Tigers, so FSU now has the top two games of the season (the team’s 63-0 shutout against Maryland had been the previous SRS leader). Freshman phenom Jameis Winston threw for 444 yards and 3 touchdowns on just 34 passes, and is vaulting to the front of Heisman leaderboards. How impressive was the win? Even if you ignore margin of victory, simply winning at Clemson stands as the most impressive road win of the season. The Tigers have an SRS of 53.5, and no team with a higher SRS score has lost at home this season. And it would be a surprise if the Seminoles didn’t finish the season undefeated.

Four of FSU’s final six regular season games come against teams outside of the top 75 in the SRS. FSU is a 29-point favorite this weekend against NC State, and should be similar favorites against Wake Forest, Syracuse, and Idaho (well, that game should be off the board). The only real challenges the rest of the way come from in-state rivals Miami and Florida, but for now, FSU seems like the best team not just in Florida, but in the country.

Of course, nothing is guaranteed in college football, a reality several teams were painfully reminded of this weekend. Louisville and Heisman/2014 No. 1 overall draft pick favorite Teddy Bridgewater lost, at home, to a sneaky good Central Florida team. If UCF can beat Houston in two weeks, the American Athletic Conference is likely theirs, along with an automatic BCS berth. Through eight weeks, the AAC has just three teams in the top half of the 125 FBS teams, so Central Florida’s path to a BCS Bowl won’t feature too many road blocks.

The one loss for the Knights was out of conference to South Carolina, a team who fell on SEC Upset Weekend. Despite a good game (and one monster hit) out of Jadeveon Clowney, the Gamecocks lost on a last-second field goal at Tennessee, 23-21.

That was one of five intraconference upsets in the SEC this weekend. Georgia lost on the road against Vanderbilt 31-27, despite the Bulldogs entering the game as 6.5-point favorites. Missouri had a higher SRS rating than Florida, but was a three-point underdog in Columbia against the Gators. The Tigers outgained Florida 500-151, and Henry Josey led the way with 18 carries for 136 yards and a score. LSU was a 9.5-point favorite in Oxford, but Zach Mettenberger threw three interceptions and Ole Miss jumped out to a 17-0 lead. The Tigers came back to tie the game, but the Rebels hit a 41-yard field goal as time expired to steal the win.

Johnny Manziel went down with an injury against Auburn, but you wouldn’t know it from his stat line: 28/38 for 454 yards, 4 TDs, 18 carries for 48 yards, 1 TD. Manziel also threw two interceptions, and missed one series with an injury, which might have made the difference in a shootout. Aggie wideout Mike Evans, who is a Vincent Jackson clone, caught 11 passes for 287 yards and four touchdowns. But Auburn, which entered College Station as 12.5-point underdogs, ultimately scored last, pulling out a 45-41 win. Tigers quarterback Nick Marshall had a great game, too, throwing for 236 passing yards and two touchdowns on 23 pass attempts, while adding 100 yards and two scores on the ground.

Only one game went according to script in the SEC, which is a pretty good way of describing just about every Alabama game ever. The Crimson Tide defeated Arkansas 52-0, in typical ruthless fashion. A.J. McCarron was 15/21 for 180 yards and 3 touchdowns, Kenyan Drake had 104 yards and two scores on 8 carries, and T.J. Yeldon had 88 yards and a score on 12 carries. Backup Derrick Henry even ran for an 80-yard touchdown in the final minutes, just because.
[continue reading…]

{ 3 comments }

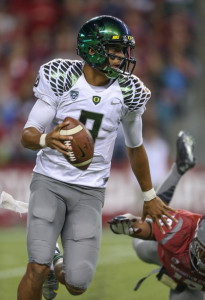
Mariota and the Ducks continue to roll

Mariota and the Ducks continue to roll.

After seven weeks, the idle Seminoles remain atop the SRS Ratings. New readers can read the background about the Simple Rating System here, but the SRS simply takes margin of victory for each team (with some minor tweaks to minimize running up the score and to give credit for close wins) and adjusts that differential for strength of schedule. The top three comprises the same teams as last week, but following a big win in Washington, Oregon leapfrogged Baylor into the number two spot. Quarterback Marcus Mariota now has 17 passing touchdowns, eight rushing touchdowns, and zero interceptions. Among players with at least 150 pass attempts, he leads college football in Adjusted Yards per Attempt, with presumptive number one pick in the 2014 Draft — Louisville’s Teddy Bridgewater — three tenths of a yard behind him. (If you lower the threshold to 100 attempts, both Bryce Petty (Baylor) and Jameis Winston (Florida State) would vault Mariota.)

The 4-5-6 spots are occupied by SEC teams, with newcomer Missouri sandwiched next to SEC stalwarts Alabama and LSU. Missouri was identified as a sleeper in last week’s ratings — the Tigers actually ranked ahead of Georgia entering that game — and then pulled off one of the weekend’s big upsets by winning in Athens. But with Mizzou, the other shoe never waits very long to drop: quarterback James Franklin was injured against Georgia, and is out at least six weeks with a separated shoulder. The Tigers have averaged 45.7 points per game this year, so Missouri is very much a team built around its dynamic offense. It’s hard to imagine Missouri beating both Florida and South Carolina the next two weeks, even with both games coming at home. On the other hand, if the Tigers can do that, there’s a good chance they’ll enter the final game of the regular season with an undefeated record. That game comes against Johnny Manziel and former Big XII rival Texas A&M. If they get to that game, we’re going to just have to assume that this 2013 is Jason Lisk’s year and we’re all just living in it. His Chiefs and Tigers are a combined 12-0 right now, and none of that makes any sense.

There were two other “big upsets” this week among ranked teams. Number five Stanford lost in Utah, in a game that wasn’t as surprising as you might think. Last week, Stanford was “only” 11th and Utah was 30th in the SRS; in fact, the Cardinal only drop to #13 in the SRS this week, while the Utes jump up to #21. The other big upset was in the Red River Shootout, in a game that was hard to see coming. Texas lost to #36 (in the SRS) Ole Miss by 21 points at home earlier this year, so who saw them winning in Dallas against Oklahoma on Saturday? Right now, Baylor is the only team in the top 20 in the SRS from the Big 12, although the Bears had their own struggles against #40 KSU in week seven.

The #7 team in the SRS is Clemson, and the Tigers host Florida State next week in a matchup of two teams ranked in the top five (albeit not in the SRS). That looks to be one of the best games of the year, and is where College Gameday will be in week eight. That’s an 8PM kickoff, so plan accordingly. And now, the week seven SRS ratings. As always, this is an ever-evolving picture, but after seven weeks, you can begin to feel pretty confident in these ratings. As always, thanks to Dr. Peter Wolfe for providing the final scores for every college football game.
[continue reading…]

{ 1 comment }

Last week, the Baylor Bears came in at number one in the first edition of the 2013 SRS Ratings. But the Bears ranked #1 on the strength of blowouts against bad teams; how would Baylor fare against West Virginia, who upset Oklahoma State just one week ago?

Art Briles’ squad raced out to a 56-14 lead, eventually won 73-42, and have cemented themselves as the new cool kids in town. But that doesn’t mean Baylor remained atop the SRS ratings. No, after Florida State and Jameis Winston dismantled Maryland, the Seminoles now rank number one:
[continue reading…]

{ 1 comment }

Five weeks in, the first edition of NCAA SRS ratings

Petty and Seastrunk have yet to break a sweat

Petty and Seastrunk have yet to break a sweat.

It’s still too early to put much faith in any computer ratings, but we can at least begin framing the discussion of which are the most impressive teams in college football. As always, thanks to Dr. Peter Wolfe for providing the final scores for every college football game. As a reminder, here’s the system for producing SRS ratings.

1) For each game not played at a neutral site, 3 points are given to the road team. After that adjustment, all wins and losses of between 7 and 24 points are recorded exactly as such. This means that a 24-10 road win goes down as +17 for the road team, -17 for the home team.

2) With one exception, wins of 7 or fewer points are scored as 7-point wins and losses of 7 or fewer points are scored as 7 point losses. So a 4-point home win goes down as +7 (and not a 1) and a 1-point home loss is a -7 (and not a -4). The one exception is that road losses of 3 or fewer (and home wins of 3 or fewer) are graded as ties. So a 21-20 home victory goes down as a 0 for both teams.

3) Wins/Losses of more than 24 points are scored as the average between the actual number and 24. This is to avoid giving undue credit to teams that run up the score. So a 75-point home win goes down as a 48-point win.

Once we have a rating for each team in each game, we then adjust each result for strength of schedule. This is an iterative process, where we adjust the ratings hundreds of times (to adjust for SOS, you have to adjust for the SOS of each opponent, and the SOS of each opponent’s opponent, and so on.) in Excel. Then we produce final ratings, where the SRS rating is the sum of the Margin of Victory and Strength of Schedule in every week.

After five weeks, what are the results? As usual, the table is fully searchable (type “-0”, for example, to see a list of undefeated teams, or SEC to see all SEC teams.) Right now, the number one team is Baylor, with an average (adjusted) Margin of Victory of 41.5 points per game against an average opponent that is 27.7 points better than average (average includes all football teams at all levels, so all FBS will have a positive grade). Among undefeated teams, no opponent has faced a tougher SOS than Alabama. Below shows all 125 FBS teams.
[continue reading…]

{ 8 comments }

Post-Week 3 College Football Ratings: Part II

Earlier today, I explained my methodology for coming up with college football ratings after three weeks. Here are the current ratings. These ratings are not capped for margin of victory (but do include a home field adjustment). That’s why Oregon tops Alabama (for now). These ratings exclude all FCS games except games where FBS teams lost to FCS teams, which are included (and all FCS teams are given a rating of -20). Here’s how to read the Alabama line. The Crimson Tide are ranked #2, and had a preseason rank (based on the Vegas point spreads) of #1. Alabam was considered 20.1 points better than average before the season; now they’re considered 21.4 points better than average, making them the top team in the SEC. Oregon jumped Alabama because the Ducks beat Virginia 59-10 and Tennessee 59-14.

RkTmPre RkPre SRSSRSConfConf Rk
1Oregon216.328.2P121
2Alabama120.121.4SEC1
3Florida St98.117.1ACC1
4Baylor35-1.115.2B121
5Georgia311.211.9SEC2
6Mississippi184.310.2SEC3
7Texas A&M411.210SEC4
8LSU68.89.3SEC5
9Oklahoma137.29.2B122
10Clemson145.98.9ACC2
11UCLA3008.7P122
12South Carolina78.68.2SEC6
13Oklahoma St127.28.1B123
14Ohio State5117.7B101
15Washington34-0.66.9P123
16Georgia Tech37-1.46.6ACC3
17Louisville271.56.4AAC1
18Arizona31-0.16.4P124
19Florida108.15.1SEC7
20Wisconsin203.94.7B102
21Michigan1753.9B103
22Miami FL261.63.4ACC4
23Stanford117.73.3P125
24Southern Cal155.53.2P126
25Arizona St222.73.2P127
26Northwestern290.71.9B104
27Texas Tech45-4.21B124
28Texas88.40.9B125
29Notre Dame165.50.8IND1
30Brigham Young41-20.5IND2
31Virginia Tech232.40.2ACC5
32Vanderbilt39-1.80.2SEC8
33Central Florida51-7.50.2AAC2
34TCU213.40B126
35Penn State33-0.6-0.1B105
36Nebraska194-0.5B106
37West Virginia46-5-0.9B127
38Missouri40-2-1.1SEC9
39North Carolina32-0.3-1.8ACC6
40Utah St55-7.9-2.7MWC1
41Auburn48-5.8-2.8SEC10
42Tennessee42-3.6-3.2SEC11
43Illinois89-14.9-3.3B107
44Oregon St251.7-3.4P128
45Navy75-12.5-3.5IND3
46Indiana67-11-3.6B108
47North Carolina St52-7.6-4ACC7
48Arkansas47-5.3-4.6SEC12
49Kansas St281.3-4.7B128
50Michigan St241.9-5B109
51Cincinnati43-4.1-5.3AAC3
52Mississippi St44-4.1-5.5SEC13
53Fresno St38-1.7-5.6MWC2
54Maryland49-7-5.8ACC8
55Washington St84-13.9-6.3P129
56Utah56-7.9-6.7P1210
57Boise St36-1.3-7MWC3
58Minnesota62-9.2-7.5B1010
59Rutgers59-8.2-7.5AAC4
60Pittsburgh53-7.6-8.1ACC9
61East Carolina64-9.4-8.3CUSA1
62Bowling Green63-9.3-8.8MAC1
63Syracuse50-7.1-9.1ACC10
64Houston80-13-10.4AAC5
65Virginia65-9.7-10.6ACC11
66Iowa57-8-10.8B1011
67Ball St68-11-10.9MAC2
68Rice78-12.8-11.6CUSA2
69Toledo79-12.9-12.2MAC3
70Duke74-12.5-12.4ACC12
71Colorado102-20.1-12.9P1211
72Boston College70-12-13ACC13
73Northern Illinois60-8.5-13.1MAC4
74California81-13.1-13.6P1212
75Marshall92-16.4-14.2CUSA3
76San José St86-14.3-14.5MWC4
77Louisiana-Monroe72-12.3-14.7SUN1
78Wyoming111-22.5-15MWC5
79Kentucky85-13.9-15.3SEC14
80SMU69-11.2-15.6AAC6
81Tulsa54-7.8-15.8CUSA4
82Purdue66-10.2-16.7B1012
83Hawai`i90-15.5-16.8MWC6
84Iowa St61-9.2-16.9B129
85Wake Forest73-12.5-17.2ACC14
86Louisiana-Lafayette77-12.8-17.5SUN2
87Middle Tennessee St87-14.8-17.6CUSA5
88North Texas110-22.5-18CUSA6
89Ohio U.91-15.5-18.1MAC5
90Arkansas St82-13.3-18.4SUN3
91Texas-San Antonio114-22.8-18.5CUSA7
92Kansas101-19.9-18.7B1210
93Akron117-25.5-18.9MAC6
94Colorado St94-18-19.7MWC7
95Temple95-18.2-19.8AAC7
96Texas St-San Marcos115-24.3-19.9SUN5
97San Diego St58-8.1-20.6MWC8
98UTEP96-18.8-20.6CUSA9
99Connecticut83-13.5-20.8AAC8
100Western Kentucky104-20.9-20.8SUN6
101Western Michigan112-22.6-20.9MAC7
102Memphis99-19.5-21.3AAC9
103Florida Atlantic118-26.9-21.6CUSA10
104Troy106-21.2-22.1SUN7
105Air Force76-12.5-22.2MWC9
106Kent St97-19.3-22.3MAC8
107New Mexico109-22.3-22.4MWC10
108Buffalo105-21-22.5MAC9
109Army107-21.5-22.7IND4
110Nevada88-14.8-22.7MWC11
111Louisiana Tech93-17.6-23.3CUSA11
112Alabama-Birmingham113-22.7-23.5CUSA12
113South Florida71-12.2-24.7AAC10
114Eastern Michigan108-21.6-25.2MAC10
115Southern Miss100-19.8-25.4CUSA13
116UNLV98-19.4-25.8MWC12
117Central Michigan103-20.4-29.2MAC11
118Florida Int'l116-25-32.4CUSA14
119Massachusetts121-36.6-35.3MAC12
120New Mexico St119-32.1-36.6IND5
121Miami OH120-33.9-40.8MAC13
122Idaho122-47.5-43.6IND6

To come up with the rankings, I placed a 50% weight on the preseason ratings and a 50% weight on the actual results. In a week or two, I’ll completely ignore the preseason ratings and calculate things the way I normally do. At that point, teams like Texas will really drop.

{ 7 comments }

Post-Week 3 College Football Ratings: Part I

With three weeks in the books, it’s time to unveil some college football ratings. This is part one — I plan to post Part II on Sunday afternoon.

It’s still too early to create meaningful SRS ratings, but there’s a workaround solution. You may recall that back in the summer, I created implied college football SRS ratings based on the Las Vegas spreads for 247 games. Those spreads were stale, but thanks to RJ Bell, founder of Pregame.com, I was able to get the final pre-game lines for those 247 games. I used those lines to build implied pre-season SRS ratings for 83 FBS teams, shown below:

RkTmGMOVSOSSRSConf
1Alabama1022.5-2.420.1SEC
2Oregon1121.7-5.416.3P12
3Georgia10110.311.2SEC
4Texas A&M78.62.611.2SEC
5Ohio State1016.7-5.611B10
6LSU94.14.88.8SEC
7South Carolina109.6-18.6SEC
8Texas1110-1.68.4B12
9Florida St913.2-5.18.1ACC
10Florida96.61.58.1SEC
11Stanford108.1-0.47.7P12
12Oklahoma St99.3-2.17.2B12
13Oklahoma107.3-0.17.2B12
14Clemson98.4-2.55.9ACC
15Southern Cal1110-4.55.5P12
16Notre Dame128.3-2.85.5IND
17Michigan95.9-0.95B10
18Mississippi6-2.87.14.3SEC
19Nebraska54.3-0.34B10
20Wisconsin63.50.43.9B10
21TCU91.91.53.4B12
22Arizona St103.7-12.7P12
23Virginia Tech620.42.4ACC
24Michigan St73.9-21.9B10
25Oregon St104.9-3.21.7P12
26Miami FL83.1-1.61.6ACC
27Louisville913.7-12.21.5AAC
28Kansas St82.4-1.11.3B12
29Northwestern94.1-3.40.7B10
30UCLA111.9-1.90P12
31Arizona105-5.1-0.1P12
32North Carolina5-10.7-0.3ACC
33Penn State81.6-2.2-0.6B10
34Washington100.9-1.5-0.6P12
35Baylor6-4.83.7-1.1B12
36Boise St36.2-7.5-1.3MWC
37Georgia Tech6-4.63.1-1.4ACC
38Vanderbilt5-8.16.3-1.8SEC
39Missouri4-11.89.8-2SEC
40Brigham Young80.1-2.2-2IND
41Tennessee7-8.54.9-3.6SEC
42Cincinnati24.3-8.4-4.1AAC
43Mississippi St6-11.37.2-4.1SEC
44Texas Tech3-10.56.3-4.2B12
45West Virginia8-6.31.3-5B12
46Arkansas7-11.46.1-5.3SEC
47Auburn8-8.93.1-5.8SEC
48Maryland1-2-5-7ACC
49Syracuse4-10.63.6-7.1ACC
50Central Florida2-12.55-7.5AAC
51North Carolina St3-12.24.6-7.6ACC
52Pittsburgh4-124.4-7.6ACC
53Tulsa1-157.2-7.8CUSA
54Utah7-12.14.2-7.9P12
55Iowa6-10.32.2-8B10
56San Diego St2-14.56.4-8.1MWC
57Rutgers2-6.3-1.9-8.2AAC
58Iowa St7-11.22.1-9.2B12
59Minnesota6-7.8-1.4-9.2B10
60Virginia5-14.54.8-9.7ACC
61Purdue3-15.55.3-10.2B10
62Indiana1-2211-11B10
63Boston College3-18.56.5-12ACC
64South Florida3-13.81.6-12.2AAC
65Wake Forest2-19.57-12.5ACC
66Navy2-4.5-8-12.5IND
67Air Force1-185.5-12.5MWC
68Houston1-14.51.5-13AAC
69California9-17.84.7-13.1P12
70Connecticut2-16.83.2-13.5AAC
71Washington St8-17.33.4-13.9P12
72Kentucky6-21.67.7-13.9SEC
73Nevada3-16.82-14.8MWC
74Illinois4-17.52.6-14.9B10
75Colorado St2-180-18MWC
76Temple3-19.21-18.2AAC
77UNLV3-9.5-9.9-19.4MWC
78Memphis1-211.5-19.5AAC
79Southern Miss1-18.5-1.3-19.8CUSA
80Kansas3-25.55.6-19.9B12
81Colorado7-21.31.2-20.1P12
82Central Michigan1-1-19.4-20.4MAC
83Army1-9-12.5-21.5IND

[continue reading…]

{ 7 comments }

Emerging From the Shadows

In 2008, the tightest division in college football was the ACC Atlantic. All six teams finished either 5-3 or 4-4. Boston College started 2-3 in conference play, but won the division after winning at Florida State, at Wake Forest, and against Maryland in the last three weeks of the regular season. The Eagles were not a very talented team; this was the year after Matt Ryan left for the draft, and the offense underwhelmed in his absence. As you can probably guess, it was the team’s defense that guided them to the ACC Championship Game:

Boston College did not have good quarterback play, but made up for decreased offensive production with a top-notch defense, whose three shutouts tied U.S.C. for the most in the F.B.S. All told, the 2008 B.C. defense ranked among the best in program history, ranking in the top 10 nationally in total defense (fifth), rush defense (seventh), pass efficiency (seventh), first downs allowed (sixth) and interceptions (first). It carried the team through the travails of an often average offense.

And there was no question who was the star of the 2008 Eagles defense: junior linebacker Mark Herzlich. After such a dominant season, he could have declared for the draft and been a first round pick; instead, Herzlich chose to return for his senior season. Then, tragedy stuck in mid-May: Herzlich was diagnosed with Ewing’s Sarcoma, a malignant tumor usually discovered in bone or soft tissue. Here was Matt Hinton’s article after hearing the news:

Even for relatively diehard fans, it might have been possible to get through the last couple seasons knowing Mark Herzlich only as “the guy with the crazy facepaint,” but that would be missing the lead: The 6’4″, 240-pound Boston College linebacker was the defensive player of the year in a conference that had six defenders picked in the first two rounds [1]The list: Raji, Aaron Curry, Alphonso Smith, Ron Brace, Clint Sintim, and Everette Brown. of this year’s draft, and might have joined teammate B.J. Raji in the top-10 if he hadn’t decided to come back for his senior season at B.C.

And here was how Paul Myerberg described Herzlich in the summer of 2009:

His accolades are numerous: 2008 A.C.C. defensive player of the year, Butkus Award finalist, first-team all-A.C.C. and third-team all-American; these awards come as a result of his team-leading 110 tackles (13 for loss), 3 sacks, 6 interceptions and 8 pass breakups. As great an all-around linebacker as you’ll find on the F.B.S. level, Herzlich will be sorely missed on the field and in the locker room.

[continue reading…]

References

{ 1 comment }

Vegas likes Alabama a lot more than it likes LSU

Vegas likes Alabama a lot more than it likes LSU.

The Simple Rating System is a set of computer rankings focused on only two variables: strength of schedule and margin of victory. I published weekly college football SRS ratings each week last season, and you can read more about the SRS there. Last month, Jason Lisk of the Big Lead took the Las Vegas point spread for each NFL game to come up with a set of power rankings; I stole Lisk’s idea and used the same point spreads to create implied SRS ratings for every NFL team. The idea is that if the 49ers are a 10.5-point neutral site favorite over the Jaguars, that’s one data point that implies that Las Vegas views San Francisco as 10.5 points better than Jacksonville. By taking every data point, and using Excel to iterate the ratings hundreds of times, you can create a set of implied team ratings.

Last week, the Golden Nugget released the point spreads for 248 college football games. By using the same process, those point spreads can help us determine the implied ratings that Las Vegas has assigned to each team.

We don’t have a full slate of games, but we do have at least 1 game for 83 different teams. Theoretically, this is different than using actual game results: one game can be enough to come up with Vegas’ implied rating for the team. That’s because once we’re confident in Oklahoma’s rating, Tulsa being 18-point underdogs in Norman gives us a good estimate for how Vegas views Tulsa. I assigned 3 points to the road team in each game in coming up with the implied SRS ratings. For example, Arizona is an 11-point favorite on the road against California. So for that game, we assume Vegas believes the Wildcats are 14 points better than the Golden Bears; if we do this for each of the other 247 games, and then iterate the results hundreds of times, we can come up with a set of power ratings.

Unsurprisingly, Alabama comes out as the highest-rated team. The Crimson Tide are being rated as 19.6 points better than “average,” although average isn’t really a concept with much meaning here. The SRS rating has little meaning in the abstract, but is useful to get a sense of the Crimson Tide’s rating relative to the rest of the teams. If Alabama is 10 points better in the SRS than a team, that means Alabama would be projected as a 10-point favorite on a neutral site. In the table below, I’ve included the number of games for which we have point spreads for each team on the far left. The “MOV” column shows the home field-adjusted average point spread for that team, the “SOS” column shows the average rating of each team’s opponent (for only the number of games for which we have lines), and the “SRS” column shows the school’s SRS rating.
[continue reading…]

{ 3 comments }

Quarterbacks wearing #12 have won 14 Super Bowls

Quarterbacks wearing #12 have won 14 Super Bowls.

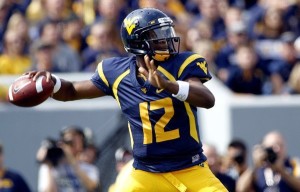
What does it mean that Geno Smith comes from a long line of Mike Leach/Dana Holgorsen star quarterbacks? I don’t know. At a minimum, it means he’s part of a very interesting and distinguished set of college quarterbacks. Because few players have dominated college football over the last 15 years like quarterbacks under Mike Leach and Dana Holgorsen.

Leach is one of the most fascinating characters in recent college football history, and he’s been one of the most influential coaches in the modern passing game. That’s what tends to happen when your quarterbacks produce video game numbers practically every season. Leach was the offensive coordinator under Hal Mumme at Kentucky in 1997 and 1998, which is when the Air Raid offense arrived on the national radar. At the time, there hadn’t been any Wildcats drafted in the first round since running back George Adams in 1985. Twenty-six months after Leach and Mumme arrived in Lexington, Tim Couch was the first pick in the NFL draft.

Leach then spent a year as the offensive coordinator for the Oklahoma Sooners with Josh Heupel at quarterback. Heupel led the conference with 3,460 passing yards and 30 touchdowns, and also sported the highest completion percentage (62.0%) in the conference. Those were big numbers in a conference where only four players threw for even 1900 yards, and was enough to land Leach the head coaching job at Texas Tech after only a season in Norman. When Leach moved to Lubbock, Texas in 2000, the quarterback cupboard appeared bare. He took unheralded sophomore quarterback Kliff Kingsbury and shaped him into the player that led the NCAA in pass attempts in 2000, 2001, and 2002. Klingsbury led the Big 12 in passing yards in both 2000 and 2001, and then as a senior, became just the third player in college football history to pass for 5,000 yards in a season (after Ty Detmer and David Klingler). Klingsbury went on to have an unremarkable career in the NFL before excelling as an assistant coach with the Houston Cougars. He followed then-head coach Mike Sumlin to Texas A&M after the 2011 season, and after turning Johnny Manziel into a Heisman Trophy winner, Kingsbury is now the new head coach at his alma mater.
[continue reading…]

{ 4 comments }

On Thursday, I looked at the increase in pick sixes per interception in the NFL. Brian Fremeau asked if that was also going on at the college level, so let’s take a look.

In 2012, there were 159 pick sixes according to cfbstats.com, matching the number provided at Sports-Reference.com. That’s right in line with previous numbers. The table below shows the number of pass attempts, interceptions, and pick sixes in major college football games since 2006, courtesy of cfbstats.com.

YearPick 6INTAttINT RatePick 6 Rt
20121591532545452.8%10.4%
20111591490513392.9%10.7%
20101591589497763.2%10%
20091581537498723.1%10.3%
20081621606498283.2%10.1%
20071671711529933.2%9.8%
20061631569460113.4%10.4%

It’s pretty interesting that the interception rates in college and the NFL are nearly identical. The interception rate in the NFL was 3.1% in 2007 and 2.9% in 2011, just about what it was in college football in those years. And with the exception of the crazy-high Pick Six rate in the NFL in 2012, both leagues see about 10% of all interceptions returned for touchdowns. Unfortunately, I don’t have the data to see if the Pick 6 rate was 5% in the ’50s in college football like it was in the NFL. But my guess is the trend would hold and that there’s an inverse relationship between interception rate and pick six rate.

{ 2 comments }

Wait, how many USC quarterbacks are starting?

Wait, how many USC quarterbacks are starting?

There was a streak in jeopardy in week 17 of the 2012 season. With former Trojan Carson Palmer injured, the Raiders skipped over his former USC teammate, Matt Leinart, and started ex-Ohio State Buckeye Terrelle Pryor at quarterback for the season finale. Since the Chiefs had previously benched Matt Cassel for Brady Quinn, if it wasn’t for Greg McElroy missing the Jets last game against the Bills — which reinserted Mark Sanchez into the starting lineup for New York — USC’s streak of consecutive weeks with a starting quarterback in the NFL would have ended. Instead, the streak is now up to 81 weeks with at least one of Sanchez, Palmer, Cassel and/or Leinart starting.

As impressive as that might sound, it’s not even halfway to the record. You can take a second to think about which school had the longest run with at least one of its former players starting at quarterback, but first, another bit of trivia: I noticed that in week 12 of the 2009 season, Matt Leinart, Matt Cassel, Mark Sanchez, and Carson Palmer all started. But believe it or not, that’s not a record, either.

In week 13 of the 2000 season, five quarterbacks from the University of WashingtonWarren Moon, Mark Brunell, Damon Huard, Chris Chandler, and Brock Huard — were starting in the NFL. Add in Washington State’s Drew Bledsoe and Ryan Leaf, and seven quarterbacks that played college in the Evergreen State were starting in the NFL that weekend.
[continue reading…]

{ 7 comments }

Griffin against the Sooners.

Griffin against the Sooners.

This week, I looked at the best college quarterback seasons in 2012 and over the last eight years. Today I’m going to do a quick data dump on the top passing performances by a college quarterback since 2005. I’ll be using the same formula as I did before, so check there if you want to read the fine print. As before, the data below is courtesy of cfbstats.com.

I’m not too surprised to see Geno Smith‘s game last year come in as the top game over the last eight years. And seeing Robert Griffin III come in with the third best passing game since 2005 isn’t too surprising, either. He threw for 479 yards and 4 touchdowns — including a memorable game-winner — on just 34 passes against the #5 team in the country. But #2 on the list is a game I doubt many remember. UCLA’s Drew Olson put together one of the craziest stat lines you’ll ever see in a 45-35 victory over Arizona State. Olson threw just 27 passes but racked up 510 passing yards and 5 touchdowns, en route to a ridiculous 21.5 ANY/A average. A future Jacksonville Jaguar had a big game for Olson, but it wasn’t Maurice Jones-Drew; Marcedes Lewis caught 7 passes for 108 yards and two touchdowns.

The full list of the top 400 games, below:
[continue reading…]

{ 0 comments }

Yesterday, I ranked every quarterback in college football last season. Today, I’ll do the same for every quarterback since 2005. If you read yesterday’s article, you can skip the next three paragraphs, which explain the system I used.

These guys were great in college.

These guys were great in college.

I start by calculating each quarterback’s Adjusted Net Yards per Attempt, done by starting with passing yards per attempt, adding 20 yards for each touchdown and subtracting 45 yards for each interception, and subtracting sack yards lost from the numerator and adding sacks to the denominator. Because the NCAA treats sack stats as rushing data, and because the game logs I have (courtesy of cfbstats.com) only show separate sack data on the team level, some estimation is involved in coming up with player sacks. Each quarterback is assigned X% of the sacks his team’s offense suffered in each game, with X equaling the number of pass attempts thrown by that player divided by his team’s total number of pass attempts.

Once I have calculate the ANY/A for each player, I then adjusted their ratings for strength of schedule. This involves an iterative process I described here and is virtually identical to how I calculate SRS ratings in college football on the team level. You adjust each quarterback’s ANY/A (weighted by number of pass attempts) for the qualify of the defense, which is adjusted by the quality of the quarterbacks it faced, which is adjusted by the quality of all the defenses all of those quarterbacks faced, and so on. After awhile, the ratings converge, and you come up with final, SOS-adjusted ANY/A ratings.
[continue reading…]

{ 4 comments }

The Chiefs play the Baylor game on an endless loop for the other 31 teams.

The Chiefs play the Baylor game on an endless loop for the other 31 teams.

A few weeks ago, I discovered cfbstats.com, which has made available for download an incredible amount of college football statistics from the last eight seasons. Thanks to them, I plan to apply some of the same techniques I’ve used on NFL numbers over the years to college statistics. If you’re a fan of college football, you’re probably already reading talented writers like Bill Connelly and Brian Fremeau, but hopefully I can bring something new to the table for you to enjoy.

There are many differences between college and professional football, but many of the same stats still matter. For quarterbacks, Adjusted Net Yards per Attempt is still the king of the basic stats [1]For the uninitiated, ANY/A is calculated by starting with passing yards per attempt, adding 20 yards for each touchdown and subtracting 45 yards for each interception, and subtracting sack yards lost … Continue reading, and it is arguably even more important in college where teams play at varying different paces.

There’s a small problem, however, if you want to calculate ANY/A at the college level: the NCAA counts sacks as rush attempts and sack yards lost as negative rushing yards. I manually overrode [2]Unfortunately, some estimation was involved. The player game logs at cfbstats do not identify quarterback sacks, but the team game logs do. So for each quarterback, we know how many passes he threw … Continue reading that decision in my data set, so going forward, all rushing and passing data will include sack data in the preferred manner (keep this in mind when you compare the statistics I present to the “official” ones).
[continue reading…]

References

References
1 For the uninitiated, ANY/A is calculated by starting with passing yards per attempt, adding 20 yards for each touchdown and subtracting 45 yards for each interception, and subtracting sack yards lost from the numerator and adding sacks to the denominator.
2 Unfortunately, some estimation was involved. The player game logs at cfbstats do not identify quarterback sacks, but the team game logs do. So for each quarterback, we know how many passes he threw in the game and how many times his team was sacked. For quarterbacks who threw 100% of their team’s passes in a game, this is easy. However, for quarterbacks who threw fewer than 100% of their team’s passes, they were assigned a pro-rata number of their team’s sacks.
{ 10 comments }

A year after having a sack in the BCS National Championship Game, Upshaw forced a key fumble in the Super Bowl.

A year after having a sack in the BCS National Championship Game, Upshaw forced a key fumble in the Super Bowl.

Aaron Wilson of the Baltimore Sun pointed out an interesting bit of trivia today: Courtney Upshaw has now won back-to-back titles in college and the NFL. Back in October 2009, the Minnesota Vikings were 5-0, and new additions Brett Favre and rookie Percy Harvin were a big part of their success. Harvin had won the national championship with Florida and Tim Tebow in 2008, and I wondered: how often does a player win a national championship in college and then win the Super Bowl the next season?

As of that post, only three players had won a college championship their last season in college and then were starters on a Super Bowl champion the following year: Randall Gay (LSU 2003, New England 2004), William Floyd (Florida State 1993, San Francisco 1994) and Tony Dorsett (Pittsburgh 1976, Dallas 1977).

So, has that changed? In 2009 the Saints won the Super Bowl, but they had no rookies from Florida. Alabama won the BCS Championship in 2009 and had seven players drafted in April 2010, but none of them landed on the Packers.  The next year Cam Newton and Nick Fairley helped the Auburn Tigers win the championship, but none of their players found themselves as New York Giants a year later. In 2011, the Crimson Tide won another national title, and Courtney Upshaw was named the Defensive MVP of the game.  Alabama defeated LSU in the Super Dome, the site of where Upshaw’s Ravens just won the Super Bowl.

With nine starts, Upshaw qualifies as a “starter” on the Ravens, so he joins Dorsett, Floyd, and Gay as the only players to to start for a Super Bowl champion a year after winning the national championship. In an odd twist, if we require a player to start for the two teams, Gay drops off the list: he was a nickel back on the 2003 LSU Tigers, behind future NFL cornerbacks Corey Webster and Travis Daniels. Dorsett has the most impressive two-year run, as he ran for for 1,948 yards and 21 touchdowns and won the Heisman Trophy for the Panthers in ’76 and then rushed for 1,007 yards and 12 touchdowns for the Cowboys a year later.
[continue reading…]

{ 2 comments }

Fourth and Harbaugh: Which coach is more aggressive?

The puns this week are harribaughl.

The puns this week are horribaughl.

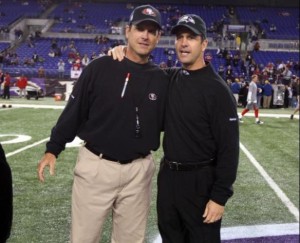
I’m going to hold off until Sunday morning to post my Super Bowl preview, but today, I’m going to look at a possible hidden key to the game. In most playoff games, each coach is faced with a critical fourth down decision. Often times the conservative coach delays the decision to go for it in favorable circumstances early in the game only to be forced to do so in less optimal situations in the final minutes. We also know that in general, coaches frequently fail to go for it early in games when the down and distance dictate a more aggressive approach: even Bill Belichick has been known to cost his team points with conservative fourth-down decisions, as he did in the AFC Championship Game. Which leads to today’s post: Is one Harbaugh more or less aggressive than the other?

Let’s start with how each coach has performed in the regular season, beginning with Jim.
[continue reading…]

{ 3 comments }
Next Posts Previous Posts