≡ Menu

Week 15 College Football SRS Ratings

I didn’t publish my college football SRS ratings last week, but with the conclusion of yesterday’s Army-Navy game, the college football regular season is over. But before we turn our attention to the Bowls, here is a look at the final regular season SRS ratings.

RkTeamConfConf RkGMOVSOSSRSREC
1OregonP1211223.741.465.111-1
2AlabamaSEC11322.841.364.112-1
3Texas A&MSEC21218.242.460.610-2
4Kansas StB1211216.543.259.711-1
5FloridaSEC31213.144.457.511-1
6Notre DameIND--1214.742.857.512-0
7GeorgiaSEC41315.841.557.311-2
8OklahomaB1221213.543.757.310-2
9StanfordP122131045.455.411-2
10South CarolinaSEC51212.541.954.410-2
11LSUSEC61211.442.854.110-2
12Oregon StP123129.64453.69-3
13Oklahoma StB1231211.142.553.67-5
14Southern CalP124127.944.552.47-5
15Florida StACC11319.332.65211-2
16Ohio StateB1011213.738.351.912-0
17BaylorB124125.145.9517-5
18TexasB125126.144.550.68-4
19WisconsinB102139.940.750.68-5
20ClemsonACC21215.135.550.610-2
21Arizona StP125129.241.350.57-5
22UCLAP126137.942.650.59-4
23Utah StWAC11217.732.149.810-2
24MichiganB10312940.349.28-4
25Fresno StMWC1121633.249.29-3
26Brigham YoungIND--1211.736.147.87-5
27ArizonaP127122.444.6477-5
28NebraskaB104137.339.546.910-3
29Texas TechB126124.442.246.67-5
30TCUB127124.941.446.47-5
31Penn StateB105128.737.546.28-4
32San José StWAC21212.733.446.110-2
33VanderbiltSEC7129.336.645.98-4
34West VirginiaB128122.343.545.87-5
35Boise StMWC21213.831.845.710-2
36Northern IllinoisMAC11318.52745.512-1
37NorthwesternB106127.637.4459-3
38Iowa StB129120.844.144.96-6
39MississippiSEC8121.243.744.96-6
40Mississippi StSEC912638.344.38-4
41Michigan StB10712341.344.36-6
42WashingtonP128120.543.644.17-5
43CincinnatiBgE11212.331.243.59-3
44MissouriSEC1012-3.346.743.45-7
45Louisiana TechWAC31211.831.343.19-3
46Central FloridaCUS11311.431.542.99-4
47San Diego StMWC3129.832.642.49-3
48North CarolinaACC3121131.342.48-4
49UtahP1291204241.95-7
50SyracuseBgE2123.53841.57-5
51TulsaCUS2139.33241.310-3
52Arkansas StSun1129.731.441.19-3
53Miami FLACC4121.639.340.97-5
54TennesseeSEC1112-0.440.740.45-7
55PittsburghBgE3126.333.840.16-6
56LouisvilleBgE4127.132.94010-2
57Georgia TechACC5132.936.939.86-7
58RutgersBgE5128.131.639.79-3
59Louisiana-MonroeSun2127.232.239.48-4
60Louisiana-LafayetteSun3127.33239.38-4
61Kent StMAC21310.129.239.311-2
62PurdueB10812038.438.36-6
63ArkansasSEC1212-5.944.138.24-8
64North Carolina StACC6123.234.537.77-5
65CaliforniaP121012-9.146.437.33-9
66Virginia TechACC7120.836.437.26-6
67Ball StMAC3124.931.836.79-3
68IowaB10912-440.536.54-8
69ToledoMAC4125.530.936.49-3
70SMUCUS312234.1366-6
71MinnesotaB101012-2.737.534.86-6
72NevadaMWC4123.331.234.47-5
73Western KentuckySun4122.731.3347-5
74NavyIND--122.731.233.98-4
75AuburnSEC1312-9.643.333.63-9
76DukeACC812-336.233.36-6
77Bowling GreenMAC5127.625.533.18-4
78IndianaB101112-4.337.3334-8
79Middle Tennessee StSun5120.531.832.28-4
80TroySun612-0.332.3325-7
81East CarolinaCUS4121.430.531.98-4
82Washington StP121112-11.843.531.73-9
83VirginiaACC912-6.137.331.24-8
84KansasB121012-16.147.131.11-11
85South FloridaBgE612-737.9313-9
86KentuckySEC1412-12.443.3312-10
87RiceCUS5120.230.630.76-6
88ConnecticutBgE712-2.532.830.35-7
89Ohio U.MAC6125.224.729.98-4
90Air ForceMWC5120.429.429.86-6
91MarylandACC1012-6.435.929.44-8
92TempleBgE811-6.735.528.84-7
93Boston CollegeACC1112-9.438.228.82-10
94HoustonCUS612-3.53228.55-7
95MarshallCUS712-2.430.327.95-7
96Texas St-San MarcosWAC412-431.927.94-8
97WyomingMWC612-6.834.427.64-8
98Western MichiganMAC712-1.829.227.44-8
99Colorado StMWC712-8.635.526.94-8
100UTEPCUS812-7.834.426.63-9
101Florida Int'lSun712-6.833.326.53-9
102Florida AtlanticSun812-8.735.126.43-9
103North TexasSun912-6.332.726.44-8
104New MexicoMWC813-4.830.525.64-9
105Wake ForestACC1212-11.537.125.65-7
106Central MichiganMAC812-3.528.625.16-6
107IllinoisB101212-14.739.324.62-10
108BuffaloMAC912-731.124.14-8
109MemphisCUS912-629.923.94-8
110Texas-San AntonioWAC5122.62123.58-4
111Alabama-BirminghamCUS1012-8.63223.43-9
112UNLVMWC913-10.633.823.22-11
113Miami OHMAC1012-9.832.322.54-8
114ColoradoP121212-22.944.621.81-11
115Hawai`iMWC1012-12.333.921.63-9
116ArmyIND--12-11.633.121.52-10
117South AlabamaSun1013-10.830.519.62-11
118AkronMAC1112-1029.419.41-11
119Eastern MichiganMAC1212-14.63419.42-10
120TulaneCUS1112-15.533.818.32-10
121Southern MissCUS1212-17.834.216.40-12
122IdahoWAC612-21.636.715.11-11
123New Mexico StWAC712-18.532.513.91-11
124MassachusettsMAC1312-22.332.19.91-11

I’ve also updated the NCAA Games page, which displays every game in major college football this season.

The table below lists the Bowl matchups along with some SRS data squeezed in: the last four columns show the SRS rating of the favorite and the underdog, along with the difference between the two ratings (i.e., a projected point spread) and the average of the two ratings (essentially a ranking of how good the game is).
[continue reading…]

{ 7 comments }

My college football playoff system

We need a playoff system to see more games between great teams like Alabama and LSU.

If Friday (or sometimes Thursday) is rant day at Football Perspective, then perhaps the first Tuesday in December can be fantasy day. Since everyone else does it, allow me to describe to you my preferred college playoff system.

  • A modified 8-team playoff that’s actually a 10-team playoff with a four-team “play-in” round. A playoff system should not undermine the regular season, and my system places significant emphasis on success in the regular season: the most-accomplished teams get to clear the lowest hurdles due to byes, home-field, and weaker opponents.
  • Notre Dame and the conference champions from the SEC, B12, P12, B10, and ACC earn automatic berths to the playoffs but only if they finish in the top 14.
  • A selection committee (or a BCS-style ranking system) is used to select the remaining teams. There is a limit of 4 teams per conference. The “play-in” round and the first round of the playoffs are held at the higher seed’s location the week after the conference championship games (i.e., next weekend).

Therefore, Alabama (#2 in the BCS), Kansas State (#5), Stanford (#6), and Florida State (#12) would be guaranteed spots by virtue of being conference champions. Notre Dame (#1) is also guaranteed a slot.

That leaves five at-large selections:

— Florida (#3)
— Oregon (#4)
— two of Georgia (#7), LSU (#8), Texas A&M (#9), and South Carolina (#10)
— Oklahoma (#11)

Basically the only teams that could complain about this system are the leftover SEC teams, but I’m okay with that since they would be considered the 5th and 6th best teams from their conference. I suppose 12-1 MAC Champion Northern Illinois might be bothered, but they lost to Iowa and had a cupcake schedule. Had Nebraska defeated Wisconsin, or had Ohio State been eligible, Oklahoma or a 4th SEC team would have been left out.

For purposes of this post, I will say Georgia and A&M would be the committee’s picks.

Here’s how the playoff system would work. The three highest-ranked conference champions (Alabama, K-State, Stanford) get byes along with the next three highest-ranked teams — Notre Dame, Florida, and Oregon. The other four teams play at the site of the higher ranked team [1]I would have the committee involved in this step of the process as well and instruct them to avoid rematches if possible. This year it is not an issue. this Saturday (December 8th). So we would have:

Play-in round

#13 Florida State @ #7 Georgia
#11 Oklahoma @ #9 Texas A&M

— Had UGA beaten Alabama, the Bulldogs would have earned a bye followed by a home playoff game. By losing, they have to play a play-in game and then win a road playoff game. So the SEC Championship was a critical game — and there’s a good chance the committee would have simply selected LSU instead because of the loss.
— Had Florida State beaten Florida, they would have had likely received a bye and possibly a home playoff game. Now they have to win two road games. Of course, the ACC Championship Game, which no one cared about on Saturday night, would have been significantly more relevant.
— Ditto the Big 10 Championship Game, well, at least for the first half. Meanwhile, Oklahoma would have known they would have needed to run the table to get in after losing to Notre Dame. Instead of the season essentially being meaningless, think how much more exciting the Sooners last-second wins over West Virginia and Oklahoma State would have been?
— And of course, think how much more exciting the rest of the season for A&M and Johnny Manziel would have been if they had a chance to make the playoffs?

First round of the playoffs:

The three conference winners and the top-seeded at large receive home playoff games, which would be played on Saturday, December 15th:

#1 Notre Dame hosts the worst remaining seed (either FSU or the A&M/Oklahoma winner)
#2 Alabama hosts the 2nd worst seed remaining (Georgia or the A&M/Oklahoma winner).
#5 Kansas State hosts the 3rd worst seed remaining (Florida)
#6 Stanford hosts the 4th worst seed remaining (Oregon)

[Note: If you want to have the committee switch the bottom two games so that Stanford does not “have to beat Oregon again” I am fine with that. KSU-Oregon and Stanford-Florida are just as acceptable to me, and I am willing to do the same to avoid a UGA or A&M rematch with Alabama if events unfolded that way.]

Notre Dame and Alabama had the best two regular seasons, and look at their rewards: they get a bye, they get a home game, and they play a team coming off a play-in game.

KSU and Stanford both won their conferences, so they are rewarded with byes and home playoff games. Florida State won their conference but their lackluster regular season did not merit the same reward. Wisconsin won the Big 10 and got nothing. So the regular season remains vitally important. Oregon and Florida had great regular seasons, and thanks to a second bite at the apple (which is instead only reserved for Alabama this year), their seasons weren’t meaningless after one loss. And the lowest two seeds played their win into the playoff.

This playoff format makes the regular season much more meaningful for many more teams, while only slightly taking away from the value of certain games (admittedly, the Kansas State and Oregon upsets on November 17th would have been less meaningful in this format; I’m okay with that — the perfect should not be the enemy of the good.)

The Final Four

We now break until the first weekend of January. At this point, we have four very deserving teams. They would play in a four-team playoff, rotated among the bowl sites, as currently envisioned. We might see Notre Dame and Oregon in the Rose Bowl and Alabama and Kansas State in the Sugar Bowl. Or perhaps A&M and Oregon in the Cotton Bowl and Florida and Notre Dame in the Orange Bowl. Who knows. The good news is that unless there are 11 deserving teams, everyone gets a shot (and even if all 5 autobids finish in the top 14, 4 non-conference champs are still eligible; no worthy undefeated team should get left out in this system).

References

References
1 I would have the committee involved in this step of the process as well and instruct them to avoid rematches if possible. This year it is not an issue.
{ 14 comments }

Previewing the Conference Championship Games

There are six conference championship games this weekend. Here’s a short preview breaking down this weekend’s action. All times Eastern.

MAC Championship (Detroit, MI)

Friday, 7PM: Kent State vs. Northern Illinois (-6.0)

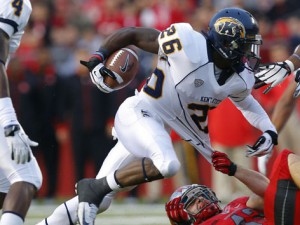
What is inside of Dri Archer?

Weeknight MACtion doesn’t get better than this, and this is one of just two conference championship games featuring two 11-1 teams. The SRS hit the nail on the head, telling us that NIU is 6.2 points better than Kent State on a neutral field. The stars here are Northern Illinois’ quarterback Jordan Lynch and KSU’s running back Dri Archer. Lynch leads the MAC in Y/A, AY/A, TD/INT Ratio, and Passer Rating, and oh by the way leads the conference with 1,611 rushing yards and ranks third with 16 rushing touchdowns.

Archer, meanwhile, leads the MAC with 1,795 yards from scrimmage has scored 18 touchdowns. But here’s the killer stat: he averaging 9.7 yards per carry, the highest average of any player with at least 100 carries since at least 2000. In his spare time, Archer averages 38.2 yards per kick return, the highest average of any player with at least 12 returns since at least 2000.

Kent State lost to Kentucky, which didn’t seem odd at the time — because we’re talking about Kent State — but looks absurd in retrospect. The Golden Flashes received an SRS grade of 4.4 for that game. Northern Illinois’ one loss was on opening weekend against Iowa, an 18-17 loss in Chicago where NIU led most of the game.

My pick: NIU -6

Pac 12 Championship (Stanford, CA)

Friday, 8PM: UCLA @ Stanford (-8.5)

If we looked at the SRS standings from a week ago, we would set this line at Stanford -5.6. But the current projected SRS spread would be 8.6, mirroring the actual line. So how much do we take away from last week’s game, where Stanford had everything to play for and UCLA seemed content to walk away unscathed?

It’s tough to say. Jim Mora’s Bruins have been an exciting team to watch this year, but Stanford’s defense is well-equipped to stop any rushing attack. Runing backs Johnathan Franklin (UCLA) and Stepfan Taylor (Stanford) have been workhorse backs, each rushing for 11 touchdowns, ranking third and fourth in the conference in rushing, and chipping in in the passing game. And while freshman quarterback Brett Hundley has been outstanding for UCLA, I have a feeling he’s going to wind up very frustrated on Friday night.

My pick: Stanford -8.5

CUSA Championship (Tulsa, OK)

Saturday, 12PM: Central Florida @ Tulsa (-1.5)

These are the two best teams in Conference USA, but that isn’t saying too much. The SRS puts UCF as 3.1 points better than Tulsa, so this game should be a push in Oklahoma. The Golden Hurricane handed UCF their only conference loss two weeks ago in Tulsa, but UCF has the more impressive resume this year losing to just Ohio State and Missouri out of conference. Tulsa lost to Iowa State and Arkansas, and just lost on the road to SMU. So why am I going with the Golden Hurricane? Because Tulsa has gone 16-2 at home the last three years, with the only losses coming to teams ranked, at the time, 8th in the country (Oklahoma State and Houston, in 2011). The final score two weeks ago was misleading, as Tulsa outgained UCF by well over 100 yards rushing, average 1.9 more yards per pass, and won the first downs battle, 26-14.

My pick: Tulsa -1.5

SEC Championship (Atlanta, GA)
[continue reading…]

{ 5 comments }

I’ve got a real post ready for tomorrow, so Thursday is Rant Day this week. There’s been a lot of talk this week about how this would be a great year to implement the four-team playoff that’s coming to college football for the 2014 season. I suspect part of that reason is because people are recognizing that Florida boasts a more impressive resume than either Alabama or Georgia, and that Oregon is an elite team that lost an overtime game to a division rival. Therefore, a four-team playoff featuring Notre Dame, the eventual SEC Champion, Florida, and Oregon would be great.

On one hand, of course it would be great. I’d love to watch Notre Dame face Oregon and perhaps see Alabama and Florida face off (no, you couldn’t make me watch Florida-Georgia II). But that’s only because college football is great. In fact, this year — like almost every year — stands as a good example of why the four-team playoff system is doomed to create controversy and do little to increase fairness. Let’s start with…

Winning your division = Bad

We saw this last year, when Alabama ended the year as BCS #2 and therefore had locked up its spot in the national championship game, while LSU still had to go play in the SEC Championship Game. In this particular case, I don’t feel too bad about the fact that Florida would be given a free pass to the four-team playoff while Georgia has to go play Alabama, but only because Florida has faced a much tougher schedule.

But what if instead of what actually happened — Florida beating South Carolina, South Carolina beating Georgia, and Georgia beating Florida — the order was reversed, and Georgia beat South Carolina, South Carolina beat Florida, and Florida beat Georgia? In that case, Florida would likely be #2 or #3 in the BCS, while Georgia would sit pretty at 4. And Florida would go play Alabama for the right to win the SEC… with the loser being left out of the playoffs. That’s patently unfair. Being the third best team in your conference could be preferable to being the second best team. This is a lock to happen at some point during a four-team playoff. This is also going to be a bigger problem generally as conferences get bigger, because conference schedules will become unbalanced. The Big 12 has a round robin where everyone plays everyone, but in a 14-team conference, you can easily see a better team end up with a worse record than an inferior team due purely to scheduling.

Oregon-Stanford

It is being conveniently forgotten that Stanford actually won the Pac-12 North. In fact, we have an exact reversal of what happened last year, which many screamed was unfair to Oregon. Lest you forget….

In 2011, both Oregon and Stanford went 8-1 in the Pac-12. Oregon beat Stanford head-to-head in Palo Alto (but lost to USC), so they won the division and then the conference. Stanford had a soft nonconference schedule while Oregon traveled to Dallas to play and lose to LSU in the season opener. So Oregon was 11-2 (but Pac-12 champs) while Stanford was 11-1. After the regular season, Stanford was 4th and Oregon was 5th in the AP, Harris, and Coaches Polls, and also in the BCS. This struck many as unfair, because the Ducks were essentially the better team but had a brutally hard non-conference game, a de facto road game against the #1 team in the country.

Fast forward to 2012. Oregon and Stanford both went 8-1 in the Pac-12. This time, Stanford beat Oregon head-to-head — in Eugene — so they won the division and perhaps the conference (we’ll find out on Saturday.) Oregon had a soft nonconference schedule while Stanford went to South Bend to play the #1 team in the country. Stanford will finish 11-2 if they beat UCLA, while Oregon finished 11-1.

Should Oregon go to the hypothetical four-team playoff instead of Stanford? If not, why not?
[continue reading…]

{ 4 comments }

McKayla Maroney is not impressed.

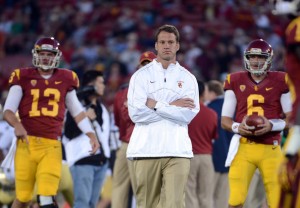
Lane Kiffin is not a very good coach, and that’s putting it mildly. He’s one of the most hated men in college football and he’s the face of a USC team that has had the worst season of any preseason favorite since at least 1964. With a 7-5 record, no one is defending Lane Kiffin. And given the various ways he mismanaged the clock against Notre Dame, nobody can defend his performance in that game.

But let’s puts everything aside — Kiffin for being Kiffin, the fact that USC had 1st and goal from the Notre Dame 2 with over 5 minutes remaining and then proceeded to waste over 150 seconds of clock — and look at one particular decision. Facing 4th and goal from the Notre Dame 1-yard line, trailing by 9 points with 2:33 left, Kiffin decided to go for it.

This clearly defies conventional wisdom, and when the move failed, it opened him up to even more criticism. But was it the right call? According to Brian Burke, if this had been an NFL game, the correct call would have been to kick the field goal.

That may not surprise traditionalists, but readers of this blog and Advanced NFL Stats may be surprised to find that, according to the 4th Down Calculator, when trailing by 9 with 2:33 remaining, you need an 87% chance of converting to make going for it the correct call. (I will note that if you are trailing by 10, things change dramatically and going for it is the correct play.)

But this was not an NFL game. Burke’s model is based on two assumptions that are relevant here: one, the team has an average number of timeouts remaining, and two, that the clock will stop with 2:00 to go. USC had one timeout left (which is probably below average for this situation) and there is no two-minute warning in college football. So it’s likely that using 2:33 is not the correct number to use the 4th down calculator for college.

If you use 2:33 remaining, you need an 87% chance of converting to make going for it the correct call.

But, according to the same model, if you use 2:03, it drops to 64%.

If you use 1:33, it drops to 13%.

Obviously figuring out which input to use is very important. However, let’s think about it in a different context.

If USC scores a touchdown and does not onside kick (which I don’t think they do), ND gets the ball at roughly the 25-yard line with 2:25 left. On 1st and 10, they run, USC calls timeout, and there is 2:20 left. On second down, Notre Dame runs, 40 seconds tick off, and there is 1:35 left. Rinse, repeat, and Notre Dame punts with 50 seconds left. This means USC gets the ball with roughly 40 seconds left at say, their own 45.

Here college football’s rules benefit the Trojans because the clock stops momentarily on first downs. At this point, it comes down to this:
[continue reading…]

{ 5 comments }

Checkdowns: FCS ratings and the FCS playoffs

In connection with calculating my college football SRS ratings at the FBS level, I also calculate them at the FCS level but rarely publish them. But with the FCS playoffs underway, I figured, why not? Here are the FCS ratings as of November 25th, 2012:

RkTeamGMOVSOSSRSRECTeam
1North Dakota St1118.923.542.410-1North Dakota St
2Sam Houston St111919.838.88-3Sam Houston St
3NW Missouri St1322.115.93810-3NW Missouri St
4Montana St1114.521.736.210-1Montana St
5Minn St-Mankato1217.418.335.712-0Minn St-Mankato
6Minnesota-Duluth1220.315.435.610-2Minnesota-Duluth
7South Dakota St129.325.7359-3South Dakota St
8Georgia Southern1111.522.834.28-3Georgia Southern
9Missouri Western1318.614.833.312-1Missouri Western
10Cal Poly SLO1113.22033.29-2Cal Poly SLO
11Eastern Washington118.124.732.99-2Eastern Washington
12Northern Iowa116.226.432.75-6Northern Iowa
13Central Arkansas1112.419.431.89-2Central Arkansas
14Indiana St117.422.6307-4Indiana St
15Illinois St115.724.129.88-3Illinois St
16Towson116.323.529.87-4Towson
17Wofford1110.41929.48-3Wofford
18Ashland12227.329.211-1Ashland
19Eastern Kentucky1110.11929.28-3Eastern Kentucky
20Southern Illinois112.526.629.16-5Southern Illinois
21Youngstown St114.224.528.77-4Youngstown St
22Henderson St1123.74.528.210-1Henderson St
23Appalachian St11424.128.18-3Appalachian St
24Old Dominion1113.814.328.110-1Old Dominion
25McNeese St118.91927.97-4McNeese St
26Sioux Falls1110.717.227.99-2Sioux Falls
27Winona St119.91827.99-2Winona St
28Chattanooga115.622.227.86-5Chattanooga
29Stony Brook1217.79.827.410-2Stony Brook
30Villanova128.518.927.48-4Villanova
31Northern Arizona117.119.9278-3Northern Arizona
32Harvard1017.39.126.48-2Harvard
33Samford114.221.425.67-4Samford
34Southern Utah11-2.127.725.65-6Southern Utah
35Richmond1110.415.125.48-3Richmond
36Tennessee-Martin114.42125.48-3Tennessee-Martin
37West Texas A&M1318.36.524.811-2West Texas A&M
38Michigan Tech1013.111.724.87-3Michigan Tech
39Montana112.921.624.55-6Montana
40Eastern Illinois121.123.224.37-5Eastern Illinois
41Missouri St11-7.531.624.23-8Missouri St
42St Cloud St117.416.6247-4St Cloud St
43Coastal Carolina128.215.8248-4Coastal Carolina
44The Citadel112.820.623.47-4The Citadel
45James Madison115.817.523.37-4James Madison
46New Hampshire116.916.323.28-3New Hampshire
47Albany NY1111.411.723.19-2Albany NY
48Stephen F. Austin110.821.722.65-6Stephen F. Austin
49Murray St11-123.522.55-6Murray St
50North Dakota11-123.522.55-6North Dakota
51Bemidji St104.417.822.26-4Bemidji St
52Wayne St NE114.517.722.26-5Wayne St NE
53Jacksonville St11-2.924.922.16-5Jacksonville St
54Harding1114.97.222.19-2Harding
55Tennessee St11616228-3Tennessee St
56UC-Davis11-224224-7UC-Davis
57Sacramento St11-0.222.2226-5Sacramento St
58Bethune-Cookman129.812.121.89-3Bethune-Cookman
59Portland St11-2.32421.73-8Portland St
60Central Missouri106.514.921.46-4Central Missouri
61Pittsburg St10813.321.27-3Pittsburg St
62Maine113.917.321.15-6Maine
63Grand Valley St111011.121.18-3Grand Valley St
64Valdosta St1117.33.7219-2Valdosta St
65Colgate128.712.120.88-4Colgate
66Emporia St119.311.320.79-2Emporia St
67Augustana SD111.918.720.55-6Augustana SD
68Shippensburg1317.3320.311-2Shippensburg
69Ohio Dominican1115.24.619.88-3Ohio Dominican
70Colorado St-Pueblo1218.7119.712-0Colorado St-Pueblo
71Northern St SD114.215.219.46-5Northern St SD
72Hillsdale117.611.619.27-4Hillsdale
73Midwestern St1112.96.219.19-2Midwestern St
74Winston-Salem St1224.4-5.41912-0Winston-Salem St
75Indiana PA1319.7-0.71912-1Indiana PA
76Lehigh118.79.718.410-1Lehigh
77Saginaw Valley St116.511.918.48-3Saginaw Valley St
78Furman11-624.218.23-8Furman
79Lindenwood MO1199.118.18-3Lindenwood MO
80Trinity CT819.1-0.918.18-0Trinity CT
81Delaware110.417.6185-6Delaware
82Northern Colorado11-3.721.8185-6Northern Colorado
83Princeton106.511.117.65-5Princeton
84William & Mary11-3.120.217.12-9William & Mary
85Weber St11-10.327.417.12-9Weber St
86South Dakota11-12.429.4171-10South Dakota
87Ferris St114.511.916.47-4Ferris St
88Wagner125.810.616.49-3Wagner
89Southern Arkansas1014.81.316.18-2Southern Arkansas
90Liberty113.711.615.36-5Liberty
91Brown105.8914.87-3Brown
92Fordham112.811.714.56-5Fordham
93Chadron St129.4514.49-3Chadron St
94SE Louisiana St11-10.925.314.45-6SE Louisiana St
95Elon11-6.620.914.33-8Elon
96New Haven1120.2-614.210-1New Haven
97Indianapolis1314.8-0.714.210-3Indianapolis
98West Alabama129.34.914.28-4West Alabama
99North Carolina A&T118.25.8147-4North Carolina A&T
100Mary Hardin-Baylor1227.2-13.313.912-0Mary Hardin-Baylor
101Dartmouth104.29.713.86-4Dartmouth
102Findlay105.5813.57-3Findlay
103Pennsylvania10-0.213.613.46-4Pennsylvania
104Northwestern St11-6.819.913.24-7Northwestern St
105Drake117.55.212.88-3Drake
106New Mexico Highlands1111.41.312.78-3New Mexico Highlands
107Middlebury814.6-212.67-1Middlebury
108SW Minnesota St11-6.819.412.64-7SW Minnesota St
109Washburn110.512.112.57-4Washburn
110Southern Oregon1216.8-4.212.59-3Southern Oregon
111Tennessee Tech11-719.612.53-8Tennessee Tech
112Lenoir-Rhyne1215.6-3.312.39-3Lenoir-Rhyne
113Delaware St111.211.112.36-5Delaware St
114SE Missouri St11-7.419.612.23-8SE Missouri St
115Shepherd1113-1128-3Shepherd
116Florida A&M11-1.913.511.74-7Florida A&M
117Abilene Christian1165.511.57-4Abilene Christian
118Western Carolina11-15.626.911.31-10Western Carolina
119Alabama St119.41.911.37-4Alabama St
120Mount Union1235.5-24.211.312-0Mount Union
121Northwood112.3911.25-6Northwood
122Concordia-St Paul11-8.319.511.22-9Concordia-St Paul
123West Chester11101.211.27-4West Chester
124California PA118.42.811.28-3California PA
125Monmouth NJ1029.111.15-5Monmouth NJ
126San Diego107.53.6117-3San Diego
127Carson-Newman1113-2.110.99-2Carson-Newman
128South Carolina St11-5.816.610.85-6South Carolina St
129Wayne St MI10-2.613.410.85-5Wayne St MI
130St Francis PA11-0.911.610.75-6St Francis PA
131Tuskegee1116.5-610.510-1Tuskegee
132Tarleton St104.65.810.46-4Tarleton St
133Missouri Southern11-0.410.810.46-5Missouri Southern
134Bloomsburg1291.410.410-2Bloomsburg
135Western Illinois11-16.426.4103-8Western Illinois
136North Carolina Central110.59.19.76-5North Carolina Central
137Morningside1227-17.59.512-0Morningside
138Kutztown119.6-0.19.57-4Kutztown
139Lamar12-7.216.69.44-8Lamar
140Duquesne111.18.19.25-6Duquesne
141Mary11-7.216.294-7Mary
142Ouachita Baptist106396-4Ouachita Baptist
143Jackson St113.55.38.77-4Jackson St
144Lafayette11-2.611.38.75-6Lafayette
145Arkansas-Pine Bluff118.40.18.59-2Arkansas-Pine Bluff
146Northeastern St OK10-7.315.78.44-6Northeastern St OK
147TAMU-Kingsville110.488.46-5TAMU-Kingsville
148North Alabama101.96.48.35-5North Alabama
149Linfield1120.3-12.47.911-0Linfield
150Holy Cross11-7.415.17.72-9Holy Cross
151Howard11-310.67.77-4Howard
152Central Washington119.3-1.97.47-4Central Washington
153Amherst88.7-1.47.36-2Amherst
154Dayton1125.37.36-5Dayton
155Cornell NY10-4.611.77.24-6Cornell NY
156Missouri S&T1119-11.97.210-1Missouri S&T
157UW-Oshkosh1222-15712-0UW-Oshkosh
158Mercyhurst119.9-2.979-2Mercyhurst
159Northern Michigan11-8.915.974-7Northern Michigan
160Jacksonville FL114.926.87-4Jacksonville FL
161Colorado Mines1110.6-3.96.76-5Colorado Mines
162Upper Iowa10-12.618.96.32-8Upper Iowa
163Alabama A&M112.93.56.37-4Alabama A&M
164UW-Platteville1018.4-12.16.38-2UW-Platteville
165Adams St1110.7-4.46.38-3Adams St
166Charleston WV1112.1-5.96.29-2Charleston WV
167St Xavier1219.1-12.96.211-1St Xavier
168Nicholls St10-14.120.26.11-9Nicholls St
169Slippery Rock113.32.86.16-5Slippery Rock
170East Central OK11-0.56.45.96-5East Central OK
171Minot St11-12.318.35.93-8Minot St
172Cumberlands KY1218.5-12.65.910-2Cumberlands KY
173Georgetown KY1123.8-17.95.910-1Georgetown KY
174Georgetown DC11-4.2105.85-6Georgetown DC
175Fort Hays St11-5.411.25.85-6Fort Hays St
176Robert Morris PA11-6.412.25.74-7Robert Morris PA
177Miles1112.9-7.35.68-3Miles
178Montana Tech118.5-3.15.48-3Montana Tech
179Nebraska-Kearney11-611.25.23-8Nebraska-Kearney
180Marian IN1117-12.24.710-1Marian IN
181Carroll MT119.2-4.54.77-4Carroll MT
182Butler115.2-0.64.78-3Butler
183Wesley1117.9-13.24.710-1Wesley
184Glenville St113.31.34.66-5Glenville St
185North Central1218-13.44.69-3North Central
186Central Oklahoma10-11.516.14.62-8Central Oklahoma
187Angelo St11-2.574.55-6Angelo St
188Marist105.5-1.24.34-6Marist
189Norfolk St11-4.58.74.34-7Norfolk St
190Morehead St1140.14.14-7Morehead St
191Concord113.50.547-4Concord
192Truman St11-4.78.53.94-7Truman St
193Bates85.3-1.43.95-3Bates
194Wesleyan85.4-23.45-3Wesleyan
195Bucknell11-912.23.23-8Bucknell
196Williams82.20.93.14-4Williams
197Walsh11-3633-8Walsh
198Humboldt St115.3-2.337-4Humboldt St
199Hampton10-7.310.12.93-7Hampton
200Sacred Heart11-7.710.52.82-9Sacred Heart
201Western Oregon112.70.12.86-5Western Oregon
202Gardner-Webb11-13.716.42.83-8Gardner-Webb
203SW Baptist11-6.99.42.53-8SW Baptist
204Columbia10-10.713.12.43-7Columbia
205Bryant11-7.59.82.34-7Bryant
206SE Oklahoma St10-24.22.24-6SE Oklahoma St
207Morgan St11-7.910.12.23-8Morgan St
208Edinboro10-0.932.14-6Edinboro
209Charleston Southern11-6.68.41.85-6Charleston Southern
210Mars Hill102.5-0.81.76-4Mars Hill
211Georgia St11-19.921.51.61-10Georgia St
212Austin Peay11-16.918.31.42-9Austin Peay
213UW-Whitewater1012.8-11.31.47-3UW-Whitewater
214Bentley109.6-8.41.18-2Bentley
215Missouri Valley1222.6-21.51.112-0Missouri Valley
216St Thomas1219.4-18.31.112-0St Thomas
217Minn St-Moorhead11-17.818.70.91-10Minn St-Moorhead
218Delta St10-5.96.70.93-7Delta St
219East Stroudsburg101.5-0.90.65-5East Stroudsburg
220St Francis IN1213.6-13.20.49-3St Francis IN
221Yale10-12.913.10.22-8Yale
222UNC-Pembroke103-2.80.26-4UNC-Pembroke
223Urbana1110.7-10.50.17-4Urbana
224Central Conn St10-14.113.9-0.12-8Central Conn St
225West Georgia10-4.44.2-0.23-7West Georgia
226Wingate113.4-3.8-0.46-5Wingate
227Hobart1221-21.4-0.412-0Hobart
228American Int'l103.4-4-0.77-3American Int'l
229Prairie View A&M11-5.54.7-0.83-8Prairie View A&M
230Fort Valley St123.8-4.7-0.98-4Fort Valley St
231Southern U.11-4.53.5-14-7Southern U.
232MidAmerica Nazarene1116-17.5-1.58-3MidAmerica Nazarene
233Mississippi Valley St11-1.5-0.1-1.65-6Mississippi Valley St
234SW Oklahoma St10-9.77.9-1.83-7SW Oklahoma St
235Pacific Lutheran1010.7-12.8-2.17-3Pacific Lutheran
236St Ambrose1111.8-14-2.19-2St Ambrose
237Idaho St11-25.623.5-2.11-10Idaho St
238Salisbury1213.3-15.4-2.29-3Salisbury
239Widener1125.2-27.4-2.211-0Widener
240Wheaton1018.8-21.1-2.38-2Wheaton
241VMI11-16.614.3-2.42-9VMI
242Minnesota-Crookston11-19.817.2-2.62-9Minnesota-Crookston
243Hardin-Simmons109.7-12.5-2.86-4Hardin-Simmons
244St Augustine's102.5-5.3-2.86-4St Augustine's
245Merrimack106.4-9.2-2.86-4Merrimack
246Louisiana College117.4-10.4-38-3Louisiana College
247Presbyterian11-16.313.1-3.22-9Presbyterian
248McMurry104.8-8-3.37-3McMurry
249Arkansas Tech11-7.94.5-3.35-6Arkansas Tech
250Simon Fraser11-1.1-2.5-3.65-6Simon Fraser
251Western New Mexico11-5.21.2-44-7Western New Mexico
252Newberry11-0.7-3.3-45-6Newberry
253Tiffin11-12.78.6-4.13-8Tiffin
254Gannon11-7.33-4.33-8Gannon
255Notre Dame OH11-149.7-4.33-8Notre Dame OH
256Johns Hopkins1216.9-21.3-4.410-2Johns Hopkins
257Willamette1012.3-16.7-4.58-2Willamette
258Rocky Mountain112.8-7.3-4.56-5Rocky Mountain
259Lake Erie11-12.98.1-4.73-8Lake Erie
260Belhaven1111.4-16.3-4.96-5Belhaven
261Rhode Island11-25.720.8-4.90-11Rhode Island
262West Liberty11-0.3-4.8-56-5West Liberty
263Colorado Mesa11-8.23.2-5.14-7Colorado Mesa
264C.W. Post10-5.50.3-5.23-7C.W. Post
265Elizabeth City St112-7.2-5.37-4Elizabeth City St
266Incarnate Word11-12.16.8-5.32-9Incarnate Word
267Coe1121.7-27.1-5.410-1Coe
268Stonehill101.2-6.6-5.45-5Stonehill
269Northwestern IA1216.5-22.4-5.89-3Northwestern IA
270Azusa Pacific11-7.61.7-5.94-7Azusa Pacific
271Shorter11-1-5-66-5Shorter
272Concordia-Moorhead1013.5-19.8-6.38-2Concordia-Moorhead
273Cal Lutheran1014.5-20.9-6.48-2Cal Lutheran
274Johnson C. Smith103.6-10.2-6.66-4Johnson C. Smith
275TAMU-Commerce10-169.3-6.71-9TAMU-Commerce
276Black Hills St11-5.7-1-6.84-7Black Hills St
277Eastern New Mexico10-13.96.9-73-7Eastern New Mexico
278Morehouse100.7-7.7-7.13-7Morehouse
279Chowan105.3-12.5-7.26-4Chowan
280Assumption10-0.4-6.8-7.23-7Assumption
281St John Fisher1110.2-17.5-7.38-3St John Fisher
282William Penn1212.8-20.3-7.59-3William Penn
283Catawba11-2.7-4.9-7.64-7Catawba
284Lincoln MO11-1810.3-7.71-10Lincoln MO
285Grand View116.9-14.6-7.77-4Grand View
286Virginia Union104.7-12.7-8.15-5Virginia Union
287Bethel MN128.7-16.8-8.19-3Bethel MN
288Birmingham-Southern1012.2-20.3-8.27-3Birmingham-Southern
289Montana St-Northern10-3.7-4.6-8.23-7Montana St-Northern
290Alcorn St11-14.76.4-8.24-7Alcorn St
291Elmhurst1210-18.3-8.310-2Elmhurst
292Rowan1012.7-21.1-8.47-3Rowan
293Shaw10-3.4-5.1-8.44-6Shaw
294Clarion11-10.52-8.44-7Clarion
295Montana-Western10-7.1-1.6-8.74-6Montana-Western
296Bethel TN134.7-13.4-8.79-4Bethel TN
297St Francis IL115.8-14.6-8.86-5St Francis IL
298Baker1110.2-19.2-98-3Baker
299Malone10-19.110.1-91-9Malone
300Savannah St11-23.514.4-9.11-10Savannah St
301Trinity TX108.5-17.6-9.27-3Trinity TX
302Heidelberg1116.3-25.5-9.29-2Heidelberg
303Faulkner116.5-15.7-9.26-5Faulkner
304WV Wesleyan11-5.4-3.8-9.23-8WV Wesleyan
305Augsburg1010-19.5-9.67-3Augsburg
306UW-Eau Claire10-4.2-5.4-9.64-6UW-Eau Claire
307Albany St GA100.7-10.4-9.76-4Albany St GA
308Bowie St10-1-8.7-9.75-5Bowie St
309Fairmont St10-5.2-4.6-9.84-6Fairmont St
310UW-La Crosse10-6.9-3-9.84-6UW-La Crosse
311Grambling St11-13.23.3-9.91-10Grambling St
312Alfred106.7-16.7-106-4Alfred
313McKendree10-6.2-3.9-10.13-7McKendree
314Utica105-15.1-10.16-4Utica
315Redlands913.4-23.7-10.26-3Redlands
316Bowdoin8-11.40.9-10.51-7Bowdoin
317Eastern Oregon10-9.3-1.2-10.54-6Eastern Oregon
318Cortland St118.8-19.3-10.59-2Cortland St
319Colby8-9.7-0.9-10.63-5Colby
320Sul Ross St100.6-11.5-10.95-5Sul Ross St
321Springfield1112.5-23.5-118-3Springfield
322Dixie St11-12.21.2-113-8Dixie St
323Huntingdon AL99.4-20.5-11.16-3Huntingdon AL
324Central St OH11-5.1-6-11.14-7Central St OH
325Arkansas-Monticello10-18.87.5-11.30-10Arkansas-Monticello
326Bacone107-18.6-11.66-4Bacone
327Endicott1117.5-29.2-11.79-2Endicott
328Hamilton8-15.13.4-11.71-7Hamilton
329Stillman11-3.2-8.5-11.86-5Stillman
330Ithaca104.3-16.1-11.86-4Ithaca
331Delaware Valley1115.1-26.9-11.88-3Delaware Valley
332Langston100.7-12.6-11.96-4Langston
333Union NY106.7-18.5-11.96-4Union NY
334Millikin109.1-21-11.95-5Millikin
335Davidson11-13.31.3-122-9Davidson
336Washington and Lee1110.2-22.3-12.18-3Washington and Lee
337North Greenville11-9-3.1-12.15-6North Greenville
338Virginia St10-2.3-10-12.34-6Virginia St
339Benedictine KS1110.1-22.6-12.57-4Benedictine KS
340Southern Nazarene10-10.8-1.8-12.61-9Southern Nazarene
341Buffalo St10-0.1-12.5-12.66-4Buffalo St
342Muhlenberg1112.1-24.7-12.68-3Muhlenberg
343Kentucky Christian111.6-14.4-12.77-4Kentucky Christian
344Cumberland TN116.1-19.2-13.18-3Cumberland TN
345St Joseph's IN11-5.2-7.9-13.16-5St Joseph's IN
346Tusculum11-11.7-1.5-13.22-9Tusculum
347St John's MN104.5-17.7-13.25-5St John's MN
348Quincy11-11.7-1.9-13.63-8Quincy
349Doane109-22.5-13.67-3Doane
350Gettysburg1013.9-27.6-13.77-3Gettysburg
351Texas Southern11-20.97.2-13.72-9Texas Southern
352Framingham St1216.9-30.8-13.910-2Framingham St
353Wittenberg1217-30.9-13.910-2Wittenberg
354Thomas More1013.8-27.7-13.97-3Thomas More
355Western St CO11-18.74.7-13.91-10Western St CO
356Salve Regina1115.9-29.9-149-2Salve Regina
357Fayetteville St10-10.6-3.6-14.22-8Fayetteville St
358Millsaps108.3-22.6-14.37-3Millsaps
359Franklin1214.8-29.1-14.39-3Franklin
360Illinois Wesleyan106.8-21.3-14.56-4Illinois Wesleyan
361Brockport St108.7-23.3-14.66-4Brockport St
362Southern Conn St11-10.9-3.8-14.63-8Southern Conn St
363Lycoming1014-28.7-14.78-2Lycoming
364Robert Morris IL1116.8-31.5-14.88-3Robert Morris IL
365Menlo9-0.1-14.9-153-6Menlo
366Millersville11-19.74.6-152-9Millersville
367Concordia AL8-0.5-14.7-15.24-4Concordia AL
368UW-Stevens Point10-9.4-5.9-15.22-8UW-Stevens Point
369Hampden-Sydney1010.8-26-15.26-4Hampden-Sydney
370Wabash1015.5-31-15.58-2Wabash
371Tufts8-18.93.4-15.50-8Tufts
372Lock Haven11-19.64-15.51-10Lock Haven
373Whitworth104.8-20.4-15.67-3Whitworth
374St Olaf104.8-20.6-15.87-3St Olaf
375Lane10-2.7-13.3-165-5Lane
376Otterbein108.1-24.1-168-2Otterbein
377NW Oklahoma St10-17.81.6-16.23-7NW Oklahoma St
378Tabor1019.4-35.6-16.28-2Tabor
379Texas Lutheran100.4-16.7-16.34-6Texas Lutheran
380UW-Stout10-7.9-8.6-16.53-7UW-Stout
381John Carroll107.9-24.7-16.86-4John Carroll
382RPI93.6-20.5-16.95-4RPI
383Baldwin-Wallace108.6-25.6-177-3Baldwin-Wallace
384Brevard11-12.3-4.9-17.22-9Brevard
385Dubuque103.1-20.6-17.55-5Dubuque
386Nebraska Wesleyan103.2-20.7-17.56-4Nebraska Wesleyan
387Ottawa1111.3-28.9-17.78-3Ottawa
388Evangel111-18.7-17.87-4Evangel
389Bridgewater St MA1110.2-28-17.89-2Bridgewater St MA
390Franklin & Marshall114.2-22.1-17.87-4Franklin & Marshall
391Wartburg109.4-27.2-17.96-4Wartburg
392Kean93.9-22.1-18.25-4Kean
393Albright119.4-27.7-18.38-3Albright
394Valparaiso11-21.73.3-18.41-10Valparaiso
395Siena Heights10-2.4-16.3-18.75-5Siena Heights
396Augustana IL10-0.1-18.7-18.75-5Augustana IL
397Trinity Int'l112.1-21.1-194-7Trinity Int'l
398St Anselm11-13.7-5.5-19.22-9St Anselm
399East Texas Baptist10-7.3-12-19.33-7East Texas Baptist
400Waynesburg118.5-27.9-19.310-1Waynesburg
401Ursinus104.5-23.8-19.36-4Ursinus
402Concordia NE111.5-21.1-19.55-6Concordia NE
403Pacific OR9-4.4-15.2-19.63-6Pacific OR
404Taylor10-0.7-19.2-19.94-6Taylor
405Lindsey Wilson11-5.9-13.9-19.93-8Lindsey Wilson
406Seton Hill11-17.1-2.8-19.90-11Seton Hill
407Virginia U-Lynchburg9-14.6-5.5-201-8Virginia U-Lynchburg
408Valley City St106.2-26.2-207-3Valley City St
409Chapman99.3-29.4-20.16-3Chapman
410Centre102.8-23-20.26-4Centre
411William Jewell11-16.8-3.5-20.32-9William Jewell
412Wash & Jeff113.7-24-20.38-3Wash & Jeff
413Clark Atlanta10-15.2-5.2-20.42-8Clark Atlanta
414West Virginia St11-20.90.4-20.52-9West Virginia St
415Edward Waters11-4-16.4-20.55-6Edward Waters
416Gustavus Adolphus10-3.5-17-20.53-7Gustavus Adolphus
417Campbell11-21.40.7-20.61-10Campbell
418Randolph-Macon104.1-24.8-20.77-3Randolph-Macon
419Bridgewater VA109-30-217-3Bridgewater VA
420Fort Lewis10-26.95.7-21.20-10Fort Lewis
421Rochester9-1.4-19.9-21.24-5Rochester
422Adrian118.9-30.7-21.89-2Adrian
423OK Panhandle St9-2.9-18.9-21.83-6OK Panhandle St
424Western New England109.9-31.7-21.86-4Western New England
425UW-River Falls10-14.4-7.5-21.82-8UW-River Falls
426Benedict10-13-9-221-9Benedict
427Concordia IL1113.7-36-22.310-1Concordia IL
428Dickinson St11-18.3-4-22.42-9Dickinson St
429Susquehanna101.3-23.7-22.56-4Susquehanna
430Central IA10-1.6-20.9-22.55-5Central IA
431Trine106.9-29.6-22.77-3Trine
432Simpson103.3-26.4-23.16-4Simpson
433Rhodes90.1-23.3-23.36-3Rhodes
434Sewanee10-3.9-19.5-23.43-7Sewanee
435Hastings10-2-21.5-23.56-4Hastings
436Cheyney11-24.50.9-23.51-10Cheyney
437Norwich1010.5-34-23.57-3Norwich
438Campbellsville11-10.1-13.6-23.73-8Campbellsville
439Dakota Wesleyan10-2.4-21.5-23.96-4Dakota Wesleyan
440Lebanon Valley105-28.9-23.96-4Lebanon Valley
441Olivet Nazarene11-11.4-12.6-243-8Olivet Nazarene
442Ferrum108.7-33-24.37-3Ferrum
443Gallaudet1012-36.5-24.57-3Gallaudet
444South Dakota Tech11-18.2-6.7-24.92-9South Dakota Tech
445Emory & Henry100.2-25.1-24.96-4Emory & Henry
446Albion105.8-30.8-256-4Albion
447Pikeville11-9.9-15.1-25.13-8Pikeville
448Kentucky St10-15.2-9.9-25.12-8Kentucky St
449Midland U.10-3.9-21.5-25.34-6Midland U.
450Maryville104.4-29.8-25.46-4Maryville
451Ohio Wesleyan109.8-35.3-25.59-1Ohio Wesleyan
452Montclair St10-2.3-23.3-25.65-5Montclair St
453Grove City104.8-30.4-25.66-4Grove City
454Texas College11-13.8-11.8-25.63-8Texas College
455Carroll WI1016.5-42.2-25.88-2Carroll WI
456Washington U.10-1.3-24.6-25.85-5Washington U.
457Webber Int'l10-3.1-22.7-25.84-6Webber Int'l
458Ohio Northern10-1.3-24.6-25.94-6Ohio Northern
459Union KY11-9.1-17-26.14-7Union KY
460St Mary KS113.6-29.7-26.16-5St Mary KS
461Carnegie Mellon113.2-29.3-26.16-5Carnegie Mellon
462Livingstone10-17.9-8.8-26.62-8Livingstone
463Kentucky Wesleyan11-17.4-9.3-26.72-9Kentucky Wesleyan
464Muskingum10-4.3-22.5-26.83-7Muskingum
465New Jersey10-1.3-25.8-27.14-6New Jersey
466Friends113-30.1-27.16-5Friends
467Jamestown10-3.4-23.8-27.24-6Jamestown
468Mount Ida115.7-33-27.38-3Mount Ida
469Virginia-Wise11-14-13.7-27.63-8Virginia-Wise
470McPherson93.8-31.5-27.65-4McPherson
471Illinois College1013.1-40.9-27.88-2Illinois College
472Mass Maritime96.9-34.8-27.95-4Mass Maritime
473Mississippi College10-17.6-10.3-27.92-8Mississippi College
474Wisconsin Lutheran1011.8-39.7-287-3Wisconsin Lutheran
475Bethany WV10-2.5-25.5-283-7Bethany WV
476Concordia WI106.7-34.8-28.17-3Concordia WI
477Central Methodist10-7.3-20.9-28.22-8Central Methodist
478Christopher Newport11-3-25.2-28.26-5Christopher Newport
479Case Western Reserve105.2-33.5-28.36-4Case Western Reserve
480Geneva10-4-24.5-28.53-7Geneva
481Whittier9-0.4-28.4-28.84-5Whittier
482Hartwick10-6-22.9-28.93-7Hartwick
483Macalester1010.8-39.8-296-4Macalester
484Hope10-0.6-28.7-29.35-5Hope
485Buena Vista10-11.9-17.4-29.34-6Buena Vista
486Peru St11-4-25.4-29.45-6Peru St
487Lewis & Clark9-8.1-21.3-29.44-5Lewis & Clark
488Merchant Marine10-7.6-22.1-29.75-5Merchant Marine
489Lake Forest107.3-37-29.78-2Lake Forest
490Coast Guard92.6-32.6-305-4Coast Guard
491Carthage10-12.6-17.7-30.33-7Carthage
492Southern Virginia10-6.6-23.7-30.34-6Southern Virginia
493Kansas Wesleyan11-1-29.4-30.46-5Kansas Wesleyan
494Castleton St111-31.5-30.47-4Castleton St
495Methodist100.5-31.2-30.75-5Methodist
496Juniata10-7.6-23.1-30.73-7Juniata
497Frostburg St10-15.2-15.9-31.13-7Frostburg St
498Curry102-33.1-31.16-4Curry
499St Scholastica119.5-40.7-31.28-3St Scholastica
500St Norbert114.5-35.7-31.38-3St Norbert
501William Paterson10-1.3-30.1-31.45-5William Paterson
502Thiel10-5.1-26.3-31.43-7Thiel
503Westminster PA9-1.7-29.8-31.53-6Westminster PA
504Lincoln PA10-22.1-9.5-31.61-9Lincoln PA
505Hanover106.6-38.3-31.76-4Hanover
506Dickinson10-12-19.9-31.84-6Dickinson
507Graceland11-12.5-19.6-32.15-6Graceland
508Iowa Wesleyan11-12.5-19.7-32.23-8Iowa Wesleyan
509Pace9-31.6-0.8-32.30-9Pace
510Avila11-10-22.5-32.52-9Avila
511Point U.10-14.5-18.2-32.62-8Point U.
512Point U.10-14.5-18.2-32.62-8Point U.
513Carleton10-13.8-19-32.73-7Carleton
514La Verne9-7.9-24.8-32.84-5La Verne
515Northwestern MN1111.6-44.4-32.88-3Northwestern MN
516Worcester St100.8-33.6-32.86-4Worcester St
517Benedictine IL102-34.9-32.95-5Benedictine IL
518Guilford10-5.7-27.4-33.15-5Guilford
519Catholic10-8.3-25.4-33.63-7Catholic
520Waldorf11-8-25.8-33.74-7Waldorf
521Lindenwood-Belleville10-6.3-27.7-344-6Lindenwood-Belleville
522Manchester105.7-39.7-346-4Manchester
523Aurora100.9-35.1-34.25-5Aurora
524Austin10-13.7-20.9-34.62-8Austin
525Oberlin100.4-35-34.64-6Oberlin
526St Lawrence10-17.7-17-34.70-10St Lawrence
527Monmouth IL103.4-38.1-34.75-5Monmouth IL
528SW Assem of God10-4.5-30.4-34.93-7SW Assem of God
529Shenandoah10-10-25-351-9Shenandoah
530Westfield St10-2.9-32.2-353-7Westfield St
531Luther10-16.5-18.6-35.10-10Luther
532Denison10-3.6-31.6-35.24-6Denison
533WPI10-14.1-21.3-35.42-8WPI
534LaGrange10-9.4-26.2-35.63-7LaGrange
535Wilkes10-6.5-29.5-365-5Wilkes
536Chicago10-4.5-31.5-364-6Chicago
537MIT9-4-32.1-36.15-4MIT
538Ave Maria8-17.5-18.7-36.21-7Ave Maria
539Moravian10-15.7-20.6-36.32-8Moravian
540Stevenson10-8.1-28.5-36.62-8Stevenson
541Capital10-15.8-21-36.72-8Capital
542Kalamazoo10-3.7-33.2-36.95-5Kalamazoo
543SUNY-Maritime9-1.1-36.1-37.23-6SUNY-Maritime
544Greenville104.4-42-37.78-2Greenville
545Briar Cliff11-16.5-21.2-37.71-10Briar Cliff
546Kenyon101.4-39.7-38.36-4Kenyon
547Sterling10-8.4-30.2-38.62-8Sterling
548Allegheny10-6.2-32.6-38.85-5Allegheny
549Howard Payne10-23.9-15-38.91-9Howard Payne
550DePauw10-11.6-27.4-392-8DePauw
551Ripon10-0.6-38.6-39.25-5Ripon
552Cornell IA10-2.9-36.3-39.24-6Cornell IA
553North Park10-20-19.3-39.31-9North Park
554North Carolina Wesleyan10-11.1-28.3-39.43-7North Carolina Wesleyan
555Wooster10-6-33.6-39.52-8Wooster
556King's PA10-11.7-27.9-39.62-8King's PA
557Greensboro10-7.7-32.1-39.85-5Greensboro
558Rose-Hulman9-3.4-36.4-39.84-5Rose-Hulman
559Southwestern KS11-7.7-32.2-39.94-7Southwestern KS
560Wayland Baptist9-20.6-19.6-40.12-7Wayland Baptist
561Pomona-Pitzer9-14.6-25.6-40.21-8Pomona-Pitzer
562Dakota St11-14.5-25.8-40.32-9Dakota St
563Bluffton10-2-38.6-40.66-4Bluffton
564Averett10-11.5-29.2-40.71-9Averett
565Culver-Stockton11-23.3-17.7-411-10Culver-Stockton
566McDaniel10-18.8-22.3-41.10-10McDaniel
567Dordt11-20.1-21-41.21-10Dordt
568Mt St Joseph10-1.9-39.4-41.34-6Mt St Joseph
569Western Conn St9-21.3-20.2-41.41-8Western Conn St
570Mayville St9-7-34.6-41.63-6Mayville St
571Bluefield11-26.6-15-41.60-11Bluefield
572Bluefield11-26.6-15-41.60-11Bluefield
573Concordia MI9-30.6-11.3-41.90-9Concordia MI
574Occidental9-17.8-24.3-422-7Occidental
575Hamline10-24.2-18.1-42.31-9Hamline
576Apprentice8-19.8-22.8-42.60-8Apprentice
577Bethany KS11-10.8-32.1-42.93-8Bethany KS
578UMass-Dartmouth10-16.8-26.3-43.11-9UMass-Dartmouth
579Alma10-19.6-23.6-43.21-9Alma
580Puget Sound9-28.3-15.1-43.30-9Puget Sound
581Morrisville St10-19.3-24.2-43.51-9Morrisville St
582St Vincent10-17.6-25.9-43.50-10St Vincent
583Plymouth St10-12-31.8-43.72-8Plymouth St
584Fitchburg St9-15.4-28.8-44.22-7Fitchburg St
585Loras10-21.1-23.5-44.52-8Loras
586Marietta10-23.4-21.6-44.90-10Marietta
587FDU-Florham10-15.2-29.8-452-8FDU-Florham
588Claremont-Mudd-Scripps9-19.3-25.9-45.20-9Claremont-Mudd-Scripps
589Nichols10-18.2-27.8-461-9Nichols
590Grinnell10-9-37.2-46.22-8Grinnell
591Lakeland10-10.4-36.2-46.62-8Lakeland
592Minnesota-Morris10-0.4-46.6-46.96-4Minnesota-Morris
593Defiance10-10.1-37.1-47.12-8Defiance
594Becker9-12.6-34.9-47.62-7Becker
595Westminster MO10-1.5-47.7-49.24-6Westminster MO
596Olivet10-17.6-31.8-49.40-10Olivet
597Eureka10-6.2-43.7-49.94-6Eureka
598Martin Luther10-1.8-48.6-50.44-6Martin Luther
599Wilmington10-28.1-22.3-50.41-9Wilmington
600Knox10-11.6-39-50.52-8Knox
601Lawrence10-14.6-38.3-52.92-8Lawrence
602Husson10-19.2-33.8-52.92-8Husson
603Anna Maria10-15.1-38.5-53.62-8Anna Maria
604Maine Maritime9-23-33.2-56.20-9Maine Maritime
605MacMurray10-14.2-42.4-56.52-8MacMurray
606Rockford10-16.6-40.1-56.72-8Rockford
607Presentation10-12.3-44.6-56.92-8Presentation
608Hiram10-25.5-32.2-57.60-10Hiram
609Crown10-14.8-44-58.82-8Crown
610Misericordia10-34.8-24.2-590-10Misericordia
611Beloit10-20.7-38.4-59.10-10Beloit
612Haskell9-28.4-32-60.41-8Haskell
613Earlham9-22.6-38.2-60.81-8Earlham
614Bethel KS10-34.2-27.4-61.60-10Bethel KS
615Anderson10-26.1-35.5-61.60-10Anderson
616Trinity Bible8-23.4-42-65.41-7Trinity Bible
617Maranatha Baptist10-27-39.4-66.40-10Maranatha Baptist

[continue reading…]

{ 0 comments }

Florida-Florida State.

Georgia-Georgia Tech.

South Carolina-Clemson.

And, as a technical matter, Vanderbilt-Wake Forest.

I’m not exactly breaking any news when I tell you this, but the ACC is not having a very good year. In the abstract, it might seem like any other elite conference. It has two 10-1 teams and each team has at least four wins other than Boston College. The problem is that the ACC, like all conferences not named the SEC, is measured by how it does in non-conference play. And it has had a miserable year in that regard.

Each team in the conference plays four non-conference games; with four games remaining, that means 44 have been played, although 13 of those games — including three by the two powerhouses of the conference, Florida State and Clemson — were against FCS schools. How has the ACC fared in its first 31 games against other FBS foes? The table below lists each non-conference game, sorted first by quality of the ACC team (that’s the SRS grade on the left) and second by the SRS grade of the opponent:

DateSRSTmPFOppPAH/RW/LDiffMOVConf_OppSOSSRS
09-29-201255.3Florida St30South Florida17RoadWin1316BgE34.650.6
09-08-201253.4Clemson52Ball St27HomeWin2522MAC38.860.8
09-01-201253.4Clemson26Auburn19NeutWin77SEC35.242.2
09-15-201244.5North Carolina34Louisville39RoadLoss-5-7BgE42.235.2
09-22-201244.5North Carolina27East Carolina6HomeWin2118CUS32.950.9
09-29-201244.5North Carolina66Idaho0HomeWin6643.5WAC15.959.4
09-08-201242.6Miami FL13Kansas St52RoadLoss-39-30B1259.929.9
10-06-201242.6Miami FL3Notre Dame41NeutLoss-38-31IND57.926.9
11-17-201242.6Miami FL40South Florida9HomeWin3126BgE34.660.6
10-27-201242Georgia Tech17Brigham Young41HomeLoss-24-25.5IND48.823.3
09-29-201242Georgia Tech28Middle Tennessee St49HomeLoss-21-24Sun36.212.2
09-29-201239.3Virginia Tech24Cincinnati27NeutLoss-3-7BgE4437
09-15-201239.3Virginia Tech17Pittsburgh35RoadLoss-18-15BgE37.722.7
09-22-201239.3Virginia Tech37Bowling Green0HomeWin3729MAC33.862.8
08-31-201238.9North Carolina St21Tennessee35NeutLoss-14-14SEC40.326.3
09-08-201238.9North Carolina St10Connecticut7RoadWin37BgE30.837.8
09-15-201238.9North Carolina St31South Alabama7HomeWin2421Sun21.942.9
09-08-201235.2Duke13Stanford50RoadLoss-37-29P1255.526.5
09-01-201235.2Duke46Florida Int'l26HomeWin2017Sun27.744.7
09-22-201235.2Duke38Memphis14HomeWin2421CUS24.445.4
09-08-201232.1Virginia17Penn State16HomeWin10B1047.447.4
09-22-201232.1Virginia7TCU27RoadLoss-20-17B1245.528.5
09-29-201232.1Virginia38Louisiana Tech44HomeLoss-6-9WAC44.735.7
11-10-201231Boston College6Notre Dame21HomeLoss-15-18IND57.939.9
09-15-201231Boston College13Northwestern22RoadLoss-9-7B1045.738.7
10-06-201231Boston College31Army34RoadLoss-30IND22.722.7
09-22-201230.4Maryland21West Virginia31RoadLoss-10-7B1243.736.7
09-08-201230.4Maryland36Temple27RoadWin912BgE3143
09-15-201230.4Maryland21Connecticut24HomeLoss-3-7BgE30.823.8
11-17-201228.1Wake Forest0Notre Dame38RoadLoss-38-29.5IND57.928.4
09-22-201228.1Wake Forest49Army37HomeWin129IND22.731.7

Both FSU and Clemson at least gave it the old college try: the Seminoles scheduled West Virginia and one FCS opponent, but when the Mountaineers joined the Big 12 they backed out of the game, leaving FSU to place a second FCS school on its schedule. Clemson scheduled Auburn – two years removed from a national championship – in Atlanta on opening weekend. But at the end of the day, neither FSU nor Clemson played any team out of conference – or in conference, excluding each other – that remotely impressed anybody. Of course, these two teams face huge tests this weekend against their in-state, SEC rivals.

UNC scheduled Louisville, a terrible team just two years ago that now may win the Big East. But that game did not go according to ACC script.

Miami certainly couldn’t have expected that they’d face two teams who would be ranked 1st in the country at some point this year when they scheduled Kansas State and Notre Dame. The results were, in hindsight, predictably bloody, with Miami losing by the combined score of 93-16.

Georgia Tech saved its worst games of the year for nonconference play. While Georgia Tech embarrassed UNC (68 points scored), Virginia (36 point win) and Maryland (33-13 on the road), the Yellow Jackets’ worst two games of the season were inexplicable 21- and 24-point losses to BYU and Middle Tennessee State. BYU scored 6 points against Boise State, 6 points against Utah State, and 14 points against San Jose State, but exploded for 41 points in Atlanta. MTSU lost by 42 to Mississippi State and lost to McNeese State – an FCS school – but somehow won on the road against the Yellow Jackets 49-28. And Georgia Tech is going to be your Coastal Division champs.

The sixth and seventh best schools – Virginia Tech and NC State – didn’t fare any better. Virginia Tech shockingly lost to both Cincinnati and Pittsburgh, while North Carolina State lost by 14 points to a Tennessee team that may set a school record for losses.

This is why Florida State gets no love from the BCS computers. Out of conference this season, the ACC has been a joke. Consider:

  • Overall, the ACC is currently 14-17 in non-conference games against other FBS schools. This is the most impressive stat you will read about the ACC today.
  • Against Conference USA, the MAC, the Sun Belt, and the WAC, the ACC is 7-2. Against miserable Army — the 114th team in the SRS — the conference is 1-1. That means against the other BCS schools (the SEC, B10, B12, P12, Big East, Notre Dame, and BYU), the conference went a pitiful 6-14.
  • This is not a joke: Ball State is the second best team an ACC school has beaten this year. Virginia’s upset over Penn State — a one-point home win when the Nittany Lions missed an extra point and four field goals — is the conference’s best win of the year. After PSU and Ball State, at least according to the SRS, the best teams defeated by ACC schools were Auburn, South Florida (twice), Bowling Green, East Carolina, Temple, and Connecticut.
  • To put a bow on it, the ACC lost to the best six teams it faced out of conference, and according to the SRS, to 13 of the 14 schools they faced that have SRS ratings over 40.
  • I don’t know if much is going to change tomorrow, but for a conference that has zero signature wins this year, tomorrow is the only chance the conference gets. Clemson is a 4-point home favorite to a Marcus Lattimore-less South Carolina team; the SRS would make Clemson 2.2-point favorites, so that line seems appropriate. Florida State is a 6-point home favorite against Florida, while the SRS would make UF just a one-point dog. Florida State has beaten up on creampuffs while Florida struggles with everyone (but still defeated Texas A&M, LSU, and South Carolina). Because Florida State’s offense is very good and Florida’s offense is offensive, most expect the Seminoles to win. I think the safe bet is to expect a very ugly game.

    Georgia is 15 points better in the SRS than Georgia Tech, and with the game in Athens, should be 18-point favorites. In fact, the Bulldogs are favored by only 13 points, perhaps a sign that Vegas doesn’t want to penalize the Yellow Jackets as harshly as the SRS for losing to MTSU. Vanderbilt is an 11.5-point favorite on the road against an awful Wake Forest team; the SRS would project the line to be 14.6 points.

    The ACC is not in a particularly enviable situation. No one expects Wake Forest or Georgia Tech to win, because odds are they will get creamed. And while the Clemson and Florida State games favor the ACC squad, both should be very close. That’s a lot of downside for a conference that with a few bad bounces, could go 0-4 on the day. That would be a fitting finish to a dreadful season. For the conference to save any face, it will need victories by both of its heavy hitters and a respectable performance by Georgia Tech.

{ 4 comments }

Week 12 College Football SRS Ratings

Your assumptions are no longer valid.

Kansas State entered the weekend as the most balanced team in college football. Through 11 weeks, Baylor ranked 120th in yards allowed and 118th in points allowed. But last night in Waco, the Wildcats were unable to do much of anything on offense. Collin Klein had never thrown more than one interception in a game in his career; he threw 3 against the Bears. Kansas State was averaging 213 rushing yards per game, but Baylor limited them to just 76 rushing yards. The Wildcats hadn’t allowed more than 30 points in a game this year; Baylor scored 52 points in the first three quarters and ended the game with 580 yards of offense. The most balanced and consistent team in the country was demolished by one of the most one-dimensional teams in college football.

Who needs Andrew Luck?

At the same time, another surprise was happening in Eugene. If there was one thing we knew in 2012, it was that the Oregon offense was unstoppable. This has been the case for years — since Chip Kelly arrived in 2007, the Ducks had scored at least 24 points in every home game. Against Stanford, the Ducks were held to just 14 points in an overtime loss.

In their first years in the post-Andrew Luck and post-Robert Griffin III, the Stanford and Baylor programs dominated the college football headlines on the most important weekend of the season. For the first time in five years, the #1 and #2 teams in the BCS fell on the same day, rendering all of our national championship game assumptions moot.

This much is clear: if Notre Dame defeats USC at the Coliseum on Saturday, the Fighting Irish are going to the BCS National Championship Game. The winner of the SEC Championship Game is going there as well, barring an upset by Georgia Tech in Athens this weekend. [1]No, we’re not getting into hypotheticals that involve Auburn beating Alabama. I maintain that Georgia is far less deserving of its spot in Atlanta than Florida, who has the most impressive trio of wins this year by defeating LSU, Texas A&M, and South Carolina. Georgia lost to South Carolina but beat Florida, which gave them the tiebreaker and the division crown. But the real key for Bulldogs was that they faced Mississippi and Auburn in the West, not LSU and A&M; as a result, they are the SEC East Champions.

But now is the time for more relevant debates. Assuming an upset — either by USC, or by Georgia Tech coupled with a Georgia upset against Alabama — who is next in line? At that point, four teams will have legitimate claims for the other golden ticket: Florida, Florida State, Oregon, and Kansas State. Fortunately, the Gators and Seminoles play each other on Saturday, which would leaves us with just three promising candidates.

If they defeat Florida State, Florida is the clear “next team up” following a slip-up by Notre Dame or in the event of a two-loss SEC Champ. The computers would love them due to their strength of schedule, and the voters should love them for the same reason and the bump they would get for defeating Florida State.

If FSU wins, their case is much weaker. The computers hate them, and for good reason: they haven’t beaten any good teams. Defeating the Gators would give them a big bump, and they’ll get a chance to beat mediocre team in the ACC Championship Game, but consider: Outside of 10-1 Clemson, each of FSU’s other 9 victories have come against ACC, Big East, or FCS schools that have at least 5 losses. And how good is Clemson? Yes, they have a nice record, but their 10 wins have come against Ball State (#64 in the SRS), and ACC, SEC, or FCS teams with at least five losses.

According to the SRS, North Carolina is the 3rd best team in the conference and they rank 45th. FSU lost to a bad N.C. State team, while while Oregon (in particular) and Kansas State have much more palatable losses. FSU’s argument would be two parts “we lost earliest” and one part “we beat Florida and Clemson, even if Clemson hasn’t beaten anybody.” Florida State’s overall strength of schedule is far inferior to that both Oregon’s and Kansas State’s. In my opinion, even with a win over Florida, the Seminoles likely do not jump both Oregon and Kansas State in the BCS, nor should they.

And consider: if Stanford defeats UCLA this weekend, the Cardinal — and not Oregon — would win the Pac-12 North, which would deal a significant blow to Nike University. Kansas State still needs to get by Texas, but tonight might not end up being a season killer. At this point, they need to root for USC and Florida State, which is historically not a bad position to be in. My guess is Kansas State is next in line after an undefeated Notre Dame, a one-loss SEC Champ, and a one-loss Florida team. It’s possible only one of those three exist by the end of the season.

Let’s take a look at the SRS ratings after 11 weeks. As always, thanks to Dr. Peter R. Wolfe. [continue reading…]

References

References
1 No, we’re not getting into hypotheticals that involve Auburn beating Alabama.
{ 8 comments }

Checkdowns: College Team Efficiency Ratings

Note: There are many things theoretical issues with this post. That said, if I had to write down and explain all the drawbacks of the data I’m about to present, I wouldn’t have the time to make quick posts like this. So….

I thought it would be cool to take a slightly (emphasis on slightly) more nuanced look at team rushing and passing stats so far in 2012.

The first table shows how many “rushing yards over average” each team has this year. First, I calculated each team’s “Adjusted Yards per Carry” which is simply Yards per Carry with a 20-yard bonus for each touchdown. On average, teams are averaging 5.31 AYPC in 2012; to calculate rushing yards over average, I multiplied the number of carries for each team by the difference between their AYPC average and 5.31. As expected, Oregon ranks first.
[continue reading…]

{ 0 comments }

Should Notre Dame be ranked in the Top 2?

Before I get to the question of the day, below is a quick roundup of some good college football articles I read this week:

  • Bill Connelly, of Football Outsiders and SB Nation, argues that Texas A&M’s victory proves head coach Kevin Sumlin was the right man for the job and that the spread works — even in the SEC.
  • You may recall that Alabama’s last chance to win the game was ruined when they fell for a hard count on a 4th down play with Texas A&M lined up to punt. Chris Brown highlighted how Sumlin has a history of success with the hard count — the day before the game.
  • Dan Wetzel, writing for Yahoo!, argues that the BCS is screwing over Notre Dame because of the Irish’s preseason ranking.
  • Stewart Mandel over at Sports Illustrated discusses the far-reaching impact of the Aggies’ upset victory
  • Matt Hinton at SB Nation provides us with the latest and greatest on the BCS race, including a terrifying-but-not-unrealistic theory on how we might get another All-SEC BCS title game.

As we move towards the final few weeks of the regular season, the picture is almost in place. We know that Oregon and Kansas State are atop the BCS standings, and if both remain undefeated, will end up facing off in the BCS National Championship Game. That would leave Notre Dame, as a potential 12-0, left out in the cold. Is this fair?

Of course not. Any system that is designed around a two-team playoff format is not going to be equitable when you have three teams finish a season undefeated. That’s basic math. Unfortunately, we’re stuck with the BCS for another 14 months. So the real question isn’t whether an undefeated Notre Dame would be getting screwed — they would be, just like countless other teams before them. No, the more interesting question is, assuming we are absurdly limited to the ridiculousness of choosing two out of three undefeated teams, should Notre Dame be one of those two teams?

The cast of characters in this case can easily be plotted a continuum, with “margin of victory” champs on one side and “strength of schedule” warriors on the other. On the left, a dominant offense; on the right, a dominant defense. It’s a case of “beauty contest winners” vs. “resume champs.” Or, if you prefer, the best predictive teams vs. the best retrodictive teams. In any event, you’ve got Oregon on one side, Notre Dame on the other, and Kansas State square in the middle. We’re left trying to magnify miniscule differences to figure out which two teams belong.

The case for Oregon

The Ducks lead the country in points per game and rushing yards per carry, giving them the most explosive offensive attack in college football. The Ducks are so prolific that they’ve managed to achieve these milestones despite largely shutting things down for large stretches of the game nearly every week: Oregon has had a lead of at least 32 points in nine of ten games, and in 8 of those games, they scored at least 4 straight touchdowns at one point (of the exceptions, in one they had two runs of three straight touchdowns and in the other, they broke USC’s school records for yards and points allowed).
[continue reading…]

{ 1 comment }

I’m a big fan of Mike Tanier, an excellent writer formerly of Football Outsiders and now with Sports on Earth. Yesterday, Tanier threw cold water on the idea that Chip Kelly is going to be the next great NFL coach. Tanier labeled him him this generation’s Steve Spurrier, and argued that it is lazy and unsophisticated to simply assume that “great NCAA coach = great NFL coach.” Unfortunately, his analysis only required the expenditure of one extra ounce of effort and intelligence:

Kelly is an offensive mastermind. He is guru of the modern college spread option. Marcus Mariota, his current quarterback, fakes a shotgun handoff, stands in the pocket while a file downloads, then floats passes to receivers who are open by five yards. Or, Mariota hands off to Kenjon Barner, who busts off 300-yard games against overtaxed defenses. Or, Mariota keeps the football himself. There are trick plays, wildcat packages, fake field goals, bells, whistles, onion rings and shakes. It’s fun, and the quarterback is always in the gun. Is your SpurriDar beeping yet?

Kelly runs an explosive college offense, but like Spurrier’s fun ‘n’ gun, it is distinctly and uniquely a college offense. It is built on the principle of littering the field with speedy young men who can outrun the opponent’s speedy young men in the wide-open spaces that only exist at a level of play where everyone is a step slower, an inch shorter and 15 pounds lighter.

Kelly’s offense is often mischaracterized as gimmicky, but Chris Brown did an excellent job explaining how traditional football principles are the key to Kelly’s offense at Grantland yesterday. Brown has also written a bit about Kelly’s zone-read running game, the way the Ducks teach reading the defensive tackle, and how Oregon’s attack compares to Nebraska’s old rushing offense over at his website, Smart Football; alternatively, you can read about Kelly’s offense straight from the horse’s mouth.

Can Kelly simply pack his playbook, spend a training camp with an NFL team, and turn them into the pro version of the Ducks? Of course not; even if his running game works perfectly, his runs will mostly go for 8-yard gains, not 40-yard sprints (unless he’s playing the Raiders). But reducing Kelly to an X’s and O’s guru incapable of adaption is unfairly harsh. Tanier credits the great Nike machine with providing Oregon with superior talent, but that’s not a fair criticism. Oregon has never had a top-ten recruiting class under Kelly, and Rivals generally ranks Oregon’s classes in the teens or early twenties. Spurrier, coaching in talent-rich Florida, not remote Oregon, was playing with a decked more favorably stacked than Kelly ever has. But more importantly, Kelly’s offenses were unstoppable when he coached at New Hampshire without any recruiting edge, and his success at Oregon happened immediately, even before Oregon truly became the nouveau riche of college football.
[continue reading…]

{ 3 comments }

Week 11 College Football SRS Ratings

Johnny Football, with his shirt on (for now).

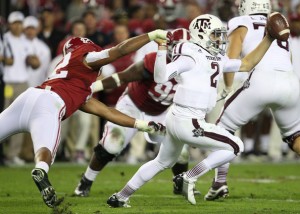
For the second straight season, the game of the year took place in Tuscaloosa. A week after Alabama eeked out a victory over LSU, and 53 weeks after Alabama loss to LSU in last year’s “Game of the Century”, Johnny Manziel produced one of the performances of the season in leading Texas A&M to an incredible upset victory. I have been a believer in the Aggies — they ranked 4th in my SRS ratings last week and remain there this week — but make no mistake, this was still an incredible upset. For a true freshman, on the road, against a Nick Saban defense, to go 24/31 for 253 yards and 2 TDs and to run 18 times for 92 yards is outstanding.

For now, the upset means we’re likely headed towards an SEC-free national championship game. This will anger some in the South, so I’ll take this time to remind you that the SEC’s record this year against the other BCS conferences is an incredibly dominant 4-5. Yes, the SEC has a losing record against the other top conferences in college football in 2011.

The bottom of the SEC has struggled considerably both in and out of conference — Auburn lost to Clemson, Vanderbilt to Northwestern, Kentucky to Louisville (and also to Western Kentucky), Ole Miss to Texas, and Arkansas to Rutgers (and also Louisiana-Lafayette). The positive side of the ledger isn’t all that impressive, unfortunately. Sure, Tennessee beat N.C. State, which would be impressive if not for the fact that the Wolfpack are 68th in the SRS. Yes, LSU beat Washington at home, but it’s LSU against the 8th best team in the Pac-12. Missouri over Arizona State and Alabama over Michigan are basically the two nonconference games the SEC can hang its hat on.

If Oregon wins out, they seem assured of getting one of the two golden tickets to Miami. Who will get the other? Obviously an undefeated Kansas State or Notre Dame would take one of the other spots. For now, K-State is ahead in the polls and the BCS standings, and gets the benefit of playing a streaking Texas team after the Fighting Irish have hung up their cleats for the year. According to the BCS Guru, Notre Dame is the clear third wheel.

But what if both Kansas State and Notre Dame lose? At that point, a one-loss SEC Champ — presumably Alabama — likely rises to number two. To that end, Alabama’s biggest friend right now is Lane Kiffin, who could knock off both Oregon and Notre Dame if USC wins out, setting up a Kansas State-Alabama title game.

And with that, a look college football’s SRS ratings after 11 weeks:
[continue reading…]

{ 6 comments }

A guide to Saturday’s games

The game of the day is in Tuscaloosa, as the #4 team in the SRS tries to ruin the perfect season of the best team in the country. Here’s a look at the weekly results for Alabama and Texas A&M, sorted from highest to lowest SRS score:

DateTeamPFOppPAH/RW/LDiffMOVSOSSRS
09-15-2012Alabama52Arkansas0RoadWin5239.542.782.2
09-01-2012Alabama41Michigan14Arlington TXWin2725.551.877.3
09-29-2012Texas A&M58Arkansas10HomeWin4834.542.777.2
10-13-2012Alabama42Missouri10RoadWin3229.547.376.8
09-15-2012Texas A&M48SMU3RoadWin453638.674.6
10-27-2012Alabama38Mississippi St7HomeWin312647.773.7
11-03-2012Texas A&M38Mississippi St13RoadWin252647.773.7
10-20-2012Alabama44Tennessee13RoadWin312944.773.7
10-27-2012Texas A&M63Auburn21RoadWin4234.537.672.1
09-08-2012Alabama35Western Kentucky0HomeWin352839.867.8
11-03-2012Alabama21LSU17RoadWin4757.164.1
09-29-2012Alabama33Mississippi14HomeWin191647.163.1
09-22-2012Alabama40Florida Atlantic7HomeWin332729.456.4
09-08-2012Texas A&M17Florida20HomeLoss-3-761.854.8
10-13-2012Texas A&M59Louisiana Tech57Shreveport LAWin2747.554.5
10-06-2012Texas A&M30Mississippi27RoadWin3747.154.1
09-22-2012Texas A&M70South Carolina St14HomeWin5638.514.553
10-20-2012Texas A&M19LSU24HomeLoss-5-857.149.1

Both teams blew out Arkansas in September and then embarrassed Mississippi State the last two weeks. Both Alabama and Texas A&M played their worst games of the year against LSU. The Aggies are a 13.5-point underdog, and it seems absurd to think that college football’s version of what it would look like if the Eagles and Chargers could have a baby could upend the mighty Crimson Tide, but it’s November. That generally means expect the unexpected.

Louisville @ Syracuse

The Cardinals look to keep their dream season alive in what looks to be an easy matchup on paper. Louisville is 9-0 and Syracuse is 4-5, so this should be a gimme, right? Except in Vegas, the line is just Syracuse -1.5. Many college football fans are calling this the oddest line of the week, but fans of the SRS would disagree. The SRS is predictive and doesn’t care about your record; it is intended to tell us how well teams will play in the future, and as a result, often mirrors the point spread in a game. Well, the SRS says Louisville should be favored by just 2.4 points despite the much more impressive record. You can view every college football game score here, which helps explain why Syracuse isn’t the pushover you might expect them to be. Syracuse has lost just one home game this season, a 42-41 game against Northwestern that ended in controversial fashion. Against the other cream of the conference, the Orange lost on the road by 8 against Rutgers and 11 against Cincinnati.

Meanwhile, Louisville beat Cincinnati at home by 3, and defeated North Carolina two months ago, but otherwise, doesn’t have any impressive wins on its resume. And it was only three weeks ago that Louisville was trailing in the final two minutes, at home, to South Florida. The Cardinals have played just three road games this season, against teams that are a combined 6-22. I think Vegas has this line appropriately placed; it’s close to a toss-up game, although I’d obviously favor the Cardinals.
[continue reading…]

{ 1 comment }

There were close calls in Baton Rouge and in South Bend, but all six undefeated teams escaped week 10 without a blemish. Ohio State is now the first team to win 10 games in 2012, although the Buckeyes are not eligible to participate in postseason play. Louisville ran its record to 9-0 yesterday, with winnable games against Syracuse and Connecticut before a season-defining finale in Piscataway on November 29th.

However, the eyes of the country are now focused on Notre Dame, Kansas State, Oregon, and Alabama. Last weekend, I said there was only a 10% chance that Oregon, Kansas State, and Notre Dame would finish the season undefeated. That was with 13 games left for those teams to win; now those odds are close to 17%. Kansas State has the easiest remaining path, although all three of its remaining opponents have realistic chances of pulling an upset. Oregon has a relatively easy game against Cal this week while Notre Dame shouldn’t have any problem with Boston College.

Alabama has another tough challenge this week in Texas A&M, although it is hard to imagine college football’s most inconsistent team of the last two years winning a close match-up against the country’s most consistent and brutal opponent. If Alabama can defeat the Aggies this weekend, a perfect regular season is all but assured, with the Crimson Tide’s final two games coming against Western Carolina (SRS of 11.6) and Auburn (37.6). The Iron Bowl this year should be more coronation than battle, which leaves just Texas A&M and Georgia — the likely opponent in the SEC Championship Game — as the two remaining hurdles for Alabama to clear.

Here are the week 10 SRS ratings: [continue reading…]

{ 2 comments }

November 3rd has been circled on the calendars of college football fans for nearly a year. Unfortunately, the two biggest games of the day — Alabama/LSU and Oregon/USC — will compete for the eyeballs of the nation. The Ducks and Trojans kick off at 7PM on the East Coast, with the Crimson Tide stealing our attention one hour later. Making matters worse, the #3 team in the country will be playing in the 8PM time slot, too, as Kansas State hosts Oklahoma State. So with a lot of interesting games this weekend, I thought I’d take a look at my thoughts on each game involving an eligible, undefeated team on Saturday in relation to two key metrics: the SRS ratings and the Vegas lines. I’ll also make heavy use of the Game Scores page, which lists every game from this season for all FBS teams.

Temple at Louisville, 12PM (all times Eastern)

Louisville SRS: 43.7
Temple SRS: 31.5
Projected SRS line: Louisville -15.2
Actual line: Louisville -16.5

Temple had been respectable early this year (minus an ugly home loss to Maryland) but has been miserable the last two weeks, likely driving this line up. The Owls were up 10-0 at halftime being being routed 35-10 by Rutgers at home two weeks ago, and then last week lost by 30 at a terrible Pittsburgh team. Louisville is not great, but they should be able to handle Temple with ease. No thoughts on the point spread, though, which seems right to me.

Pittsburgh at Notre Dame, 3:30PM

Notre Dame SRS: 63.1
Pittsburgh SRS: 37.5
Projected SRS line: Notre Dame -28.6
Actual line: Notre Dame -16.5

Why is this line the same as Louisville-Temple? The only explanations I can think of are: (1) Pittsburgh just played its best game of the week (SRS score of 57.0) in a win over Temple and (2) Notre Dame hasn’t earned the public’s trust just yet. But with the exception of a squeaker over Purdue in week two, the Fighting Irish have been very good each week. They beat Michigan State by 17 (SRS score of 67.5), Michigan by 7 (58.2), Miami by 38 (73.0), Stanford by 7 (60.8), BYU by 3 (51) and Oklahoma by 17 (82.9). Maybe some of those scores are a little inflated — the Hurricanes have several drops and an injured quarterback, the Stanford game was in overtime, the Oklahoma game was closer than the score — but that’s picking nits, in my opinion. This is a ridiculously good defense playing a Pittsburgh team that scored 20 points in its last road game, which was at Buffalo. The Panthers were horrrrrrrrible with probably more Rs than that the first two weeks of the season, losing to FCS Youngstown State and Cincinnati by a combined 38 points. But even if we threw those games out, the SRS would still say the Fighting Irish should be favored by at least three touchdowns.

The pick: Notre Dame -16.5

[continue reading…]

{ 1 comment }

Neil once pointed out, that you can approximate a team’s odds of winning a game by using the point spread and the following formula:

p(W) = 1 – (1-NORMDIST(0.5,SPREAD,13.86,TRUE))+0.5*(NORMDIST(0.5,SPREAD,13.86,TRUE)-NORMDIST(-0.5,SPREAD,13.86,TRUE))

For college football games, there is research by Wayne Winston and Jeff Sagarin that the standard deviation in the above formula should be 16 instead of 13.86. One of the nice things about the SRS is that it comes very close to approximating the point spread in each game. If we give 3 points to the home team, we can then approximate each team’s likelihood of winning in their remaining games.

For example, here is a look at Oregon’s remaining schedule and their likelihood of winning each game. Note that for now, I am assuming that the Ducks host the Trojans in the Pac-12 Championship Game:

TmOppLocSRS TmSRS OppProj SpreadWin Prob
OregonSouthern CalRoad65.953.9-8.971.2%
OregonCaliforniaRoad65.942.3-20.690.1%
OregonStanfordHome65.953.8-1582.6%
OregonOregon StRoad65.955.2-7.768.4%
OregonSouthern CalHome65.953.9-14.982.5%
Total29.9%

Winning five games in a row isn’t easy, even for a team as good as Oregon. With four difficult games left, the odds of them going 5-0 are just 29.9%. Things are much more favorable for Kansas State:

TmOppLocSRS TmSRS OppProj SpreadWin Prob
Kansas StOklahoma StHome66.352.5-16.985.4%
Kansas StTCURoad66.346.2-17.185.7%
Kansas StBaylorRoad66.346-17.486.1%
Kansas StTexasHome66.352.1-17.285.9%
Total54.1%

The Big 12 has some good teams, but Kansas State appears to be an elite one. My gut tells me the SRS is underrating the likelihood of one of those teams pulling off an upset, but there’s no doubt that Kansas State would be a double-digit favorite against each of those teams right now. Of course, one thing the SRS ignores in all of these instances is the possibility of a key injury affecting any team.

Notre Dame has a history of dropping games to bad teams, but I don’t think there’s much of a chance the Fighting Irish lose any of their next three games. That means the USC game should have national title implications:

TmOppLocSRS TmSRS OppProj SpreadWin Prob
Notre DamePittsburghHome63.137.2-28.996.5%
Notre DameBoston CollegeRoad63.131.1-29.196.5%
Notre DameWake ForestHome63.127.9-38.399.2%
Notre DameSouthern CalRoad63.153.9-6.265.1%
Total60.1%

There is only a 10% chance (29.9% * 54.1% * 60.1%) that Oregon, Kansas State and Notre Dame all finish the season undefeated, at least according to the assumptions in this post. If you want to look at how all three teams got here, you can check all the NCAA game scores here.

{ 7 comments }

Week 9 SRS Ratings: When Will Oregon Stop Scoring?

Oregon’s offense is ridiculous, and its defense and special teams aren’t far behind. Entering this weekend, Oregon had outscored opponents 234-46 … in the first half. Prior to their game against Colorado, Bill Connelly ranked Oregon as the third best defense in college football. Against the horrible Buffaloes, the Ducks didn’t disappoint.

Oregon jumped out to a 28-0 lead after the first quarter, and led 56-0 by halftime. Backup quarterback Bryan Bennett led the team with three touchdowns in the 70-14 rout. De’Anthony Thomas rushed for 97 yards on five carries and scored on a 73-yard punt return. Kenjon Barner had 9 carries for 104 yards and 2 touchdowns, and if not for the one-yard score, would have averaged 12.9 yards per carry; he also caught a 48-yard pass.

For the Ducks, this was a going-through-the-motions victory against a very overmatched opponent. Soon, though, we’ll find out a little more about the Ducks. On Saturday, they go to Los Angeles to face a talented but inconsistent USC team. And while California isn’t a serious threat, the Ducks close with games against Stanford and Oregon State, who may at least be able to slow down the mighty Ducks offense. For now, though, Oregon looks like the one hope to make for an exciting BCS National Championship Game.

We can assume Alabama will take one spot, with Oregon, Kansas State and Notre Dame battling for the other golden ticket. The odds of another all-SEC title game dropped with the Florida loss to Georgia. That’s because the Bulldogs now have the inside track on winning the SEC East, with a head-to-head victory over Florida. South Carolina beat Georgia, but UGA will essentially win the division due to luck of the draw. South Carolina drew Arkansas and LSU in Baton Rouge from the SEC West this year, while Georgia gets to play Ole Miss and Auburn — their final two conference opponents. Assuming the Bulldogs can take care of business against Ole Miss next week, their ticket to Atlanta should be secure. Considering Florida could have boosted their SOS against Florida State — and also faced and defeated LSU — replacing Florida with Georgia as the SEC East champion lowers the odds of that division sending a team to Miami.

Without further ado, below are the week 9 SRS ratings. As always, thanks to Dr. Peter R. Wolfe for publishing his game results.
[continue reading…]

{ 3 comments }

I didn’t think this was possible.

In 2009, Alabama had an incredible defense, ranking 1st or 2nd in points allowed, yards allowed, first downs allowed, completion percentage allowed and rushing yards allowed en route to a 14-0 season and a national title. In the 2010 draft, Rolando McClain and Kareem Jackson went in the first round, Javier Arenas and Terrence Cody in the second, and Marquis Johnson and Brandon Deaderick in the seventh. In 2010, a young Alabama defense wildly exceeded all expectations — how could they lose so much talent and still dominate? — but the team did regress and finished the year 10-3.

Last year, as the younger defense matured, Alabama had one of the greatest defenses in the history of college football. The Crimson Tide allowed a miniscule 8.2 points per game, by far the fewest in college football. Alabama’s defense also ranked 1st by large margins in rushing yards per game, passing yards per game, and first downs per game. But then Mark Barron, Dre Kirkpatrick, Dont’a Hightower, and Courtney Upshaw were top 35 picks in the NFL draft this year, while cornerback DeQuan Menzie and defensive tackle Josh Chapman were fifth round picks. With six defensive starters for the Crimson Tide getting drafted in 2012 — including five members of the first- or second-team All-SEC defense from 2011 [1]Upshaw and Barron were All-SEC first team selections by the AP, and Chapman, Hightower and Kirkpatrick earned second-team honors. — 2012 should have represented a significant step backwards for what was a historically dominant defense.

But the Crimson Tide death star is at full throttle now. After winning on the road at Tennessee and sucking the life out of another offense — and the Vols have one of the most explosive offenses in the SEC — Alabama continues to look invincible. While every other team in college football has question marks, Alabama has allowed just 8.3 points per game this year and has a mercilessly efficient offense. Quarterback A.J. McCarron still hasn’t thrown an interception in 2012.

Here’s a look at the SRS ratings after eight weeks. As a technical matter, two 7-0 teams square off in Tuscaloosa next week. But according to the SRS, Alabama should be expected to win by about 24 points.

[continue reading…]

References

References
1 Upshaw and Barron were All-SEC first team selections by the AP, and Chapman, Hightower and Kirkpatrick earned second-team honors.
{ 8 comments }

Week 7 NCAA SRS Ratings and the B12 lovefest may be back

Hey Bob, did you know the fate of the conference is in your hands?

Last year, the computers loved the Big 12. The first BCS Standings will be released tonight, and I suspect the B12 will again be viewed favorably by the computers. As a whole, B12 teams have just three nonconference losses, and two of them were by Kansas (to Rice and Northern Illinois). As long as the other nine teams in the conference keep crushing the Jayhawks, those losses won’t matter. The other loss came by Oklahoma State in Arizona, which looks bad in retrospect but again the damage may be limited. With the exception of a blowout over Lousiana-Lafayette, OSU simply hasn’t looked good this season, falling short of a single-game SRS score of 50 in every other game. Yesterday, OSU won by just six points in Manhattan. For the purposes of Kansas State, Oklahoma, Texas Tech and West Virginia, as long as they also beat down on Oklahoma State (and Texas has already handed them one conference loss), I suspect the computers will continue to love them. And for purposes of the BCS computers, a win over the Cowboys is all they will need (as margin of victory is not included).

On the other side, the conference doesn’t really have any landmark victories, either. Mississippi (via Texas), Louisiana-Monroe (Baylor), Tulsa and Iowa (Iowa State), and Miami (Kansas State) are the most impressive heads hanging in the conference’s living room. We might not learn a lot about the Big 12 conference teams as they relate to the rest of college football — the 10 teams have already played 29 of their 30 nonconference games this season. Fortunately for us, that last remaining game is in two weeks, when Notre Dame travels to Oklahoma. If the Sooners win that game, the computers will likely love the Big 12 for the rest of the season.

Below are the SRS Ratings after seven weeks. As always, thanks to Dr. Peter Wolfe.
[continue reading…]

{ 1 comment }

College Football BCS odds

Before today’s games, I figured we could take a second to look at the latest odds to win the BCS Championship:

TeamOddsPerc
Alabama7/529.2%
Oregon7/215.6%
West Virginia6/110%
South Carolina7/18.8%
Florida8/17.8%
USC8/17.8%
Kansas State15/14.4%
LSU18/13.7%
Notre Dame20/13.3%
Oklahoma50/11.4%
Georgia50/11.4%
Florida State50/11.4%
Louisville100/10.7%
Field (Any Other Team)100/10.7%
Texas100/10.7%
Clemson200/10.3%
Baylor300/10.2%
Mississippi State300/10.2%
Stanford500/10.1%
Tennessee500/10.1%
BYU500/10.1%
Oklahoma State500/10.1%
Arizona State500/10.1%
Michigan500/10.1%
Wisconsin500/10.1%
Michigan State500/10.1%
TCU500/10.1%
Texas A&M500/10.1%
Nebraska500/10.1%
Washington500/10.1%
North Carolina State500/10.1%
Iowa500/10.1%
Boise State500/10.1%
UCLA500/10.1%
Cincinnati500/10.1%

[continue reading…]

{ 4 comments }

NCAA SRS Ratings: Week 6

We're 1 spot away from being in Chase's top six!

For the last couple of weeks, I noted that the SEC East was inching its way back towards respectability. In 2009, the West went 12-7 against the East; in 2010, the dominance was much more pronounced, with the West going 16-3, and Ole Miss being responsible for two of the three losses. Last year, the SEC West went 13-6 against the East, with Ole Miss and MSU being responsible for five of the losses. In all three years, the West was the clear dominant division: any uncertainly was eliminated in the SEC Championship Game, as the West won the three games by a combined 130-40.

But with Florida’s victory over LSU this weekend, the plate tectonics in the Southeastern Conference appear to have shifted. The Gators also beat Texas A&M, leaving the East Division 2-1 so far this season against the mighty West, with Mississippi State’s win over Kentucky being the West’s first interdivision win of 2012. But more importantly, according to the SRS, three of the best five teams in the conference reside in the East, along with two of the three highest ranked teams in all the polls. The two worst teams have been Auburn and Arkansas, both West members. Alabama may be the class of the conference, but we may not find out much more until the SEC Championship Game. In 2012, the Crimson Tide only face Tennessee and Missouri from the East, which may make it difficult to judge the conference’s elite until December. Florida already won both of its two interdivision games, leaving South Carolina’s trip to LSU being perhaps the last referendum on the top of the two divisions until the championship game (USC’s other East opponent is Arkansas).

Anyway, here are the SRS Ratings after six weeks. As always, thanks to Dr. Peter Wolfe.
[continue reading…]

{ 2 comments }

Five weeks in, there’s no stopping the Crimson Tide

Like everyone else, the SRS now has Alabama atop its standings. Here are the full SRS ratings after five weeks [1]Note that I called the Oregon-Washington State game when Oregon was up 51-19 late in the 4th quarter.

RkTeamConfGMOVSOSSRSREC
1AlabamaSEC527.237.364.55-0
2TexasB12422.341.263.44-0
3Texas TechB12427.335.762.94-0
4Texas A&MSEC425.535.5613-1
5South CarolinaSEC522.138.860.95-0
6GeorgiaSEC522.336.859.15-0
7FloridaSEC416.642.258.94-0
8OregonP12526.429.956.35-0
9Notre DameIND414.841.556.24-0
10West VirginiaB12417.338.956.14-0
11Arizona StP12519.336.155.44-1
12Kansas StB12420.134.9554-0
13Florida StACC528.625.554.15-0
14BaylorB12412.84153.73-1
15PurdueB1041736.253.23-1
16LSUSEC521.731.453.15-0
17Oregon StP1235.747.352.93-0
18Oklahoma StB12414.43751.32-2
19OklahomaB12316.833.950.82-1
20ClemsonACC512.937.450.34-1
21UCLAP12515.334.549.84-1
22Ohio StateB10514.135.749.85-0
23StanfordP1247.342.549.73-1
24MissouriSEC51.946.848.73-2
25Iowa StB1248.140.448.53-1
26Southern CalP12412.835.748.43-1
27ArizonaP1254.343.347.63-2
28NebraskaB10517.33047.34-1
29San José StWAC513.132.545.64-1
30North CarolinaACC519.226.445.63-2
31NorthwesternB10511.833.745.55-0
32Fresno StMWC511.43445.43-2
33Mississippi StSEC418.826.144.84-0
34Utah StWAC513.431.444.84-1
35Brigham YoungIND516.328.444.73-2
36MississippiSEC5440.544.53-2
37Louisiana-MonroeSun49.834.744.52-2
38WisconsinB105341.444.43-2
39TCUB12420.923.644.44-0
40MichiganB1042.541.744.22-2
41NevadaMWC512.630.943.54-1
42Michigan StB1054.738.643.33-2
43Louisiana TechWAC415.627.643.24-0
44TulsaCUS512.330.642.94-1
45TennesseeSEC56.93642.93-2
46Boise StMWC4636.642.63-1
47WashingtonP1243.638.842.43-1
48Central FloridaCUS46.136.242.42-2
49LouisvilleBgE512.729.642.35-0
50Miami FLACC54.537.5424-1
51Penn StateB1059.331.7413-2
52AuburnSEC4-7.348.240.91-3
53Western KentuckySun59.431.440.84-1
54RutgersBgE415.824.340.14-0
55North Carolina StACC57.332.639.93-2
56Louisiana-LafayetteSun41029.939.93-1
57VanderbiltSEC4-1.941.739.81-3
58CincinnatiBgE313.726.139.83-0
59Middle Tennessee StSun411.827.839.53-1
60Ohio U.MAC515.723.739.45-0
61ToledoMAC57.831.339.14-1
62UtahP124-0.439.138.72-2
63MinnesotaB105731.538.54-1
64CaliforniaP125-5.844.238.41-4
65IowaB1053.234.8383-2
66TroySun54.433.437.83-2
67KentuckySEC5-9.747.437.71-4
68South FloridaBgE5-2.239.2372-3
69MarylandACC4-0.537.5372-2
70TempleBgE3234.936.91-2
71San Diego StMWC52.434.436.82-3
72Georgia TechACC56.829.636.42-3
73Ball StMAC5036.336.33-2
74SMUCUS4-9.645.936.31-3
75East CarolinaCUS5-1.737.936.23-2
76Northern IllinoisMAC511.524.435.94-1
77Boston CollegeACC4-2.538.135.61-3
78IndianaB1045.330.135.42-2
79New MexicoMWC5-3.839.135.32-3
80ConnecticutBgE55.829.435.23-2
81MarshallCUS5-2.137.1352-3
82SyracuseBgE4-4.839.334.61-3
83Kent StMAC42.332.134.43-1
84Virginia TechACC5727.334.33-2
85WyomingMWC4-639.633.61-3
86DukeACC59.623.933.54-1
87Air ForceMWC48.924.433.32-2
88Texas St-San MarcosWAC4-6.639.933.32-2
89Alabama-BirminghamCUS4-16.547.831.30-4
90UTEPCUS5-839311-4
91North TexasSun5-2.433.4312-3
92VirginiaACC5-6.737.530.82-3
93Western MichiganMAC5-2.232.930.72-3
94PittsburghBgE42.528.230.72-2
95ArkansasSEC5-14.244.530.31-4
96HoustonCUS4-8.837.7291-3
97KansasB124-533.928.91-3
98Arkansas StSun5-3.130.627.52-3
99Bowling GreenMAC5-2.129.427.32-3
100Florida AtlanticSun5-13.740.126.41-4
101BuffaloMAC4-6.532.926.41-3
102IllinoisB105-6.932.9262-3
103Washington StP125-934.425.42-3
104UNLVMWC5-8.834.225.41-4
105NavyIND4-10.435.625.31-3
106Southern MissCUS4-16.841.624.90-4
107Texas-San AntonioWAC520.34.524.85-0
108Colorado StMWC5-12.236.824.61-4
109RiceCUS5-12.637.224.61-4
110Eastern MichiganMAC4-17.64224.40-4
111Wake ForestACC5-7.531.5243-2
112Florida Int'lSun5-12.336.123.81-4
113Miami OHMAC5-5.328.3233-2
114AkronMAC5-4.42722.61-4
115Central MichiganMAC4-10.430.4202-2
116Hawai`iMWC4-15.935.8201-3
117South AlabamaSun5-12.432.219.81-4
118New Mexico StWAC5-9.728.819.11-4
119ColoradoP125-13.131.818.71-4
120MemphisCUS4-1430.516.50-4
121IdahoWAC5-22.537.314.80-5
122TulaneCUS4-2943140-4
123ArmyIND4-16.830.413.60-4
124MassachusettsMAC5-22.535.412.90-5

[continue reading…]

References

References
1 Note that I called the Oregon-Washington State game when Oregon was up 51-19 late in the 4th quarter.
{ 3 comments }

It’s still too early to really put a lot of faith into the SRS ratings, but hey, we’ve got enough games to at least give it the old college try. As always, thanks to Dr. Peter Wolfe for providing the game scores for all of college football. As a reminder, here’s the system.

1) For each game not played at a neutral site, 3 points are given to the road team. After that adjustment, all wins and losses of between 7 and 24 points are scored as however many points the team won by. So a 24-10 road win goes down as +17 for the road team, -17 for the home team.

2) With one exception, wins of 7 or fewer points are scored as 7-point wins and losses of 7 or fewer points are scored as 7 point losses. So three 4-point home wins (+3 before the adjustments, +21 after) is worth more than two 10 point road wins and a 1 point home loss (+19 before, +19 after). The one exception is that road losses of 3 or fewer and home wins of 3 or fewer are graded as 0 point ties. So a 21-20 home victory goes down as a tie for both teams.

3) Wins/Losses of more than 24 points are scored as the average between the actual number and 24. This is to avoid giving undue credit to teams that run up the score. So a 67-point home win goes down as a 44-point win.

After four weeks, what are the results?

[continue reading…]

{ 2 comments }

A futile twist on SRS scores for college football teams

Can you imagine Rambo without his knife? Well, I can't imagine not being able to use the SRS.

As a guy who loves the Simple Rating System, the start of the college football season can be frustrating. Until we get a few weeks in, we can’t really use the Simple Rating System to analyze results. A similar problem affects all computer rating systems. Jeff Sagarin notes in his rankings that that for the first few weeks of the season — until the teams are “well connected” — he uses a starting weight to help match the results to our expectations. By “well connected” Sagarin simply means we need the teams to play each other more frequently so we can have more confidence in our results.

So while it’s fun to watch the games, part of me is disappointed that I can’t run all the teams through the simple rating system. If only we could double the sample size of the games played — after six weeks, teams are fairly well connected — we’d be in business.

Well, I thought of a cheat to do just that. Each game has a point spread, a quantitative expectation of how each team will perform according to the best minds in the betting community. So when Florida plays Tennessee, there are two games that are happening. One is the result of the actual game, Florida winning by 17. The other is what we expected to happen, which is Tennessee winning by 3.

It might seem odd to use projected results as inputs into the SRS. And maybe it is. But why not? It’s similar in ways to using preseason projections, and I generally have faith in the betting community. Plus, what else I am supposed to do until a few more weeks.

So here’s what I did. I took every game where the point spread was less than 35 points (under the assumption that games with ridiculous betting lines or that don’t even have a line are just tune ups) and counted it twice. Once for the actual results, and once for the point spread.

Washington, for example, has played 3 games this year. They played San Diego State, were favored by 15, and won by 9 points. They played LSU, were 22.5 point underdogs, and lost by 38 points. And they played Portland State, were 32-point favorites, and won by 39 points. As a result, in six “games” this year, Washington won by an average of 5.8 points. Their strength of schedule was pretty tough, too — iterated, of course — so they will fare pretty well. How does the rest of college football look?
[continue reading…]

{ 4 comments }

The last few years, first at the PFR Blog and later at Smart Football, I’ve tracked the college football season with a modified version of the Simple Rating System. The SRS thrives on interconnectivity — we need each of the teams to play each of the other teams as many times as possible. You can’t create a predictive version of the SRS until after several weeks of results: an objective strength of schedule can’t be created until the system seems how teams perform against multiple teams.

But we can see how teams performed in week 1 compared to expectations, by comparing the actual results to what the SRS would have predicted if the same teams had instead met at the end of the 2011 regular season. For example, the 2011 Pittsburgh Panthers had an SRS of 39.9, while the 2011 Youngstown State Penguins — an FCS team but a very good one — had an SRS of 28.0. With YSU heading to Pittsburgh, we would project Pittsburgh to win by 14.9 points, factoring in three points for home field.

Kevin Sumlin explains to Case Keenum the plot of Over the Top.

As it turns out, the Penguins beat the Panthers by 14 points, meaning YSU surpassed “expectations” by 28.9 points. At least according to this unusual definition of expectations. But that wasn’t the biggest upset of the weekend, and not just because Pittsburgh was mediocre last year. In 2011, YSU handed eventual FCS National Champion North Dakota State their only loss of the season — in Fargo — last November. No, the biggest upset of the weekend came at the expense of the 13th best team in the SRS last year…. to a team playing its first game at the FBS level.

You may recall that the Houston Cougars started last season 12-0, and were in the running for a BCS Bowl berth before losing in the Conference USA Championship Game to Southern Mississippi. Since then, Cougars coach Kevin Sumlin jumped to Texas A&M while star quarterback Case Keenum finally exhausted his eligibility. Regression was expected — assumed, even — but to see the Cougars lose to Texas State was astonishing. Texas State plays in San Marco, Texas, located roughly halfway between San Antonio and Austin, and joined college football’s highest ranks this season. The Texas State Bobcats were an FCS school last year and went 6-6; against their only non-FCS opponents in 2011, the Bobcasts lost 50-10 to Texas Tech and 45-10 to Wyoming. And coming into the game, Texas State was a 34.5 point underdog. Update: This morning, Houston offensive coordinator Mike Nesbitt “resigned”, and head coach Tony Levine announced that Travis Bush will now handle the play-calling duties.

Here were the biggest “upsets” of week 1 according to the 2011 SRS. The final column shows the difference between the actual results and the expected score:

TeamPFOppPALocTmConfOppConfEXP MOVDiff
Texas St-San Marcos30Houston13RoadWACCUS-40.257.2
Youngstown St31Pittsburgh17RoadfcsBgE-14.928.9
Ohio U.24Penn State14RoadMACB10-12.122.1
Duke46Florida Int'l26HomeACCSun-1.521.5
Eastern Washington20Idaho3RoadfcsWAC-0.217.2
Nevada31California24RoadMWCP12-8.315.3
Colorado St22Colorado17Denver COMWCP12-6.411.4
Troy39Alabama-Birmingham29RoadSunCUS-0.210.2
Arizona24Toledo17HomeP12MAC-2.89.8
McNeese St27Middle Tennessee St21RoadfcsSun-3.89.8
Texas-San Antonio33South Alabama31RoadWACSun-4.76.7
Michigan St17Boise St13HomeB10MWC-1.75.7

Again, obviously not all of these were upsets. Boise State was expected to decline following the loss of Kellen Moore and a stellar senior class, and actually covered the spread in their loss to Michigan State. But this helps to at least give a hint of what were some possible upsets. The Pac-12 only went 2-2 in their games against the Mountain West this weekend, as Colorado and California came out flat against Colorado State and Nevada. In addition to McNeese State’s victory over MTSU, there was a 4th victory by an FCS school over an FBS team: but it doesn’t register as an upset on the SRS meter. Tennessee-Martin defeated Memphis 20-17 on a field goal in the final seconds; while UT-Martin was a 9.5 point underdog according to Las Vegas, they actually finished 6 points higher than Memphis in the SRS last year.

Impressive wins by Favorites

We can use the same formula to look at the most impressive wins by the SRS favorites in FBS games. Subjectively, it’s hard to top what Alabama did to Michigan on Saturday Night; if it’s possible for the #1 or #2 team in the country to look better than we thought, the Crimson Tide did just that this weekend. But looking at simple arithmetic…

TeamPFOppPALocTmConfOppConfEXP MOVDiff
Ohio State56Miami OH10HomeB10MAC15.430.6
Notre Dame50Navy10Dublin IrelandINDIND14.225.8
Nebraska49Southern Miss20HomeB10CUS6.622.4
Central Florida56Akron14RoadCUSMAC21.620.4
UCLA49Rice24RoadP12CUS6.618.4
Alabama41Michigan14Arlington TXSECB108.818.2
West Virginia69Marshall34HomeB12CUS17.317.7
Connecticut37Massachusetts0HomeBgEMAC20.216.8
Baylor59SMU24HomeB12CUS19.715.3
Brigham Young30Washington St6HomeINDP129.514.5
Iowa St38Tulsa23HomeB12CUS0.514.5
Southern Cal49Hawai`i10HomeP12MWC26.112.9
Illinois24Western Michigan7HomeB10MAC6.310.7

Urban Meyer’s debut was about as good as he could have hoped, thumping a Miami of Ohio team that was solid in 2011. Notre Dame, excellent at disappointing its fan base, destroyed Navy in Saturday’s early game in Dublin. Nebraska’s Taylor Martinez had perhaps the best passing game of his career over Southern Miss, who is replacing head coach Larry Fedora (now in North Carolina). Baylor was only a 7-point favorite against SMU in its first game After RGIII; based on their success last year, the SRS projected Baylor as a 20-point favorite. Still, the Bears blew out Southern Methodist 59-24, in an effort to prove that they weren’t a one-man program. Not every school was as fortunate…

Honorable Mentions

San Jose State, a projected 32-point loser in Palo Alto, nearly pulled off a huge upset in Stanford’s first game After Luck. The Cardinal needed a last second fourth-quarter field goal to win, 20-17. Northern Iowa, a 25-point projected loser to Wisconsin, lost 26-21, a sign that the Panthers should be in for a good year. Maryland needed a 4th quarter touchdown to defeat William & Mary, 7-6, despite being a projected 15.5 point winner. In other depressing ACC news, Wake Forest got a scare from Liberty — a team they were projected to beat by 16.7 points — but won 20-17.

{ 5 comments }

Bill Barnwell wrote an interesting article where he tried to identify the best running back in football. His article made me wonder: which player will gain the most rushing yards over the next decade?

It probably makes sense to start with a look at history. I suspect you would have been able to guess that LaDainian Tomlinson had the most rushing yards from 2002 to 2011, but what about from 1982 to 1991? Or from 1960 to 1969? The table below shows each leader in rushing yards for every ten year period, along with their age and NFL experience during their first season during the relevant period.

YearsRush YdsPlayerBeg AgeBeg Exp.
1932--19413860Clarke Hinkle231
1933--19423529Clarke Hinkle242
1934--19433132Tuffy Leemans22--
1935--19443132Tuffy Leemans23--
1936--19453132Tuffy Leemans241
1937--19462529Pug Manders24--
1938--19472813Steve Van Buren18--
1939--19483758Steve Van Buren19--
1940--19494904Steve Van Buren20--
1941--19505533Steve Van Buren21--
1942--19515860Steve Van Buren22--
1943--19525860Steve Van Buren23--
1944--19535860Steve Van Buren241
1945--19545416Steve Van Buren252
1946--19554817Joe Perry19--
1947--19565337Joe Perry20--
1948--19575791Joe Perry21--
1949--19586549Joe Perry22--
1950--19597151Joe Perry233
1951--19606599Joe Perry244
1952--19616597Joe Perry255
1953--19627459Jim Brown17--
1954--19639322Jim Brown18--
1955--196410768Jim Brown19--
1956--196512312Jim Brown20--
1957--196612312Jim Brown211
1958--196711370Jim Brown222
1959--19689843Jim Brown233
1960--19698514Jim Brown244
1961--19707257Jim Brown255
1962--19716074Leroy Kelly20--
1963--19726885Leroy Kelly21--
1964--19737274Leroy Kelly221
1965--19747262Leroy Kelly232
1966--19758123O.J. Simpson19--
1967--19769626O.J. Simpson20--
1968--197710183O.J. Simpson21--
1969--197810776O.J. Simpson221
1970--197910539O.J. Simpson232
1971--198010051O.J. Simpson243
1972--198110339Franco Harris221
1973--198210204Walter Payton19--
1974--198311625Walter Payton20--
1975--198413309Walter Payton211
1976--198514181Walter Payton222
1977--198614124Walter Payton233
1978--198712805Walter Payton244
1979--198811410Walter Payton255
1980--198911226Eric Dickerson20--
1981--199011903Eric Dickerson21--
1982--199112439Eric Dickerson22--
1983--199213168Eric Dickerson231
1984--199311451Eric Dickerson242
1985--19949346Eric Dickerson253
1986--199510172Barry Sanders18--
1987--199611725Barry Sanders19--
1988--199713778Barry Sanders20--
1989--199815269Barry Sanders211
1990--199913963Emmitt Smith211
1991--200014229Emmitt Smith222
1992--200113687Emmitt Smith233
1993--200212949Emmitt Smith244
1994--200311719Emmitt Smith255
1995--200413366Curtis Martin221
1996--200512614Curtis Martin232
1997--200611462Curtis Martin243
1998--200711607Edgerrin James20--
1999--200812121Edgerrin James211
2000--200912490LaDainian Tomlinson21--
2001--201013404LaDainian Tomlinson221
2002--201112448LaDainian Tomlinson232

Steve Van Buren in the middle of his most famous performance.

Tomlinson entered the league in 2001, but he was so productive in his first nine years that he also led the league in rushing yards gained from 2000 to 2009. O.J. Simpson, Eric Dickerson and Barry Sanders each led the league in rushing yards for ten year periods … when they spent the first three seasons of those decades playing college ball. Jim Brown was even more impressive, as he led the NFL in rushing yards from 1953 to 1962, even though he was just 17 years old in 1953 and did not enter the league until 1957.

But Steve Van Buren has them all beat: he entered the league in 1944, but led all players in rushing from 1938 to 1947. As you may recall, he’s still the Eagles franchise leader in rushing touchdowns. We can also look at the leaders over the last nine seasons, although obviously the ten-year windows are not closed in these cases:

YearsRush YdsPlayerBeg AgeBeg Exp.
2003--201110765LaDainian Tomlinson243
2004--20119120LaDainian Tomlinson254
2005--20118420Steven Jackson222
2006--20117374Steven Jackson233
2007--20116752Adrian Peterson221
2008--20115645Chris Johnson231
2009--20114417Chris Johnson242
2010--20112930Maurice Jones-Drew255
2011--20111606Maurice Jones-Drew266

So what can we make of the results? The average running back was just a hair under 22 at the start of his ten year period. Nearly half of all running backs were not yet in the NFL at the start of their ten year run, although that is likely to change now. Those players were in other football leagues, serving their country, or in college, but all three of those factors are less prevalent now. Star running backs leave college a year or two earlier than they did a generation ago, which will make it slightly less likely that a player will not be in the NFL at the start of the next ten-year run.

Fourteen players were rookies at the start of their great stretch, and another 10 were second year players, making nearly 80% of the players having just one year or less of experience in the summer before the start of their streak. What does that mean for the stretch from 2012 to 2021? Trent Richardson is the ideal candidate, as the new Browns running back just turned 21. Last year’s Alabama running sensation, Mark Ingram, was 22 in 2011, while Dion Lewis and Jacquizz Rodgers were the top 21-year-old running backs last season.

The rushing champ from 2012 to 2021?

No running back started his 10-year stretch atop the leaderboard at the age of 26, and only Hall of Famers Steve Van Buren, Joe Perry, Jim Brown, Walter Payton, Eric Dickerson and Emmitt Smith were 25 at the start of a streak. That makes it pretty easy to rule out Maurice Jones-Drew, Matt Forte, Adrian Peterson and Chris Johnson, all of whom will be 27 in 2012. Ray Rice (25 in 2012), Arian Foster (26), Marshawn Lynch (26) and Ryan Mathews (25) are probably suckers’ bets, too.

LeSean McCoy, Beanie Wells and DeMarco Murray all are entering their age 24 season, making them perhaps the best hope among the young runners with NFL experience. On the other hand, along with Richardson, Doug Martin, David Wilson, Ronnie Hillman and Lamar Miller made the 2012 draft strong at the position. In the NFC West, Isaiah Pead and Kendall Hunter (or LaMichael James) could be the future for their teams for the next decade. As always, it’s too early to say.

In the collegiate ranks, South Carolina’s Marcus Lattimore is expected to be the cream of the 2013 class, with Auburn transfer Michael Dyer and Wisconsin’s Montee Ball also in the mix. And based on past history, we can’t count out sophomores Malcolm Brown or De’Anthony Thomas. If you had to pick which player will lead the league in rushing yards from 2012 to 2021, Trent Richardson is the obvious choice. After him, I’d probably be pretty evenly split among McCoy, Martin and Lattimore.

{ 6 comments }

This was not how I expected to introduce the “college” category to Football Perspective.

Following the release of the Freeh Report, the depth of college football’s ugliest scandal appears deeper and darker than ever before. For those who have not followed the story closely, Matt Hinton does his typical excellent job bringing us up to speed.

The full report into Penn State’s response to allegations of sexual abuse by longtime defensive coordinator Jerry Sandusky, following an eight-month investigation overseen by former FBI director Louis Freeh, fills 267 excruciating pages. But to put the finishing touches on the obliteration of a half-century of goodwill, it only took 163 words:

The evidence shows that these four men also knew about a 1998 criminal investigation of Sandusky relating to suspected sexual misconduct with a young boy in a Penn State football locker room shower. Again, they showed no concern about that victim. The evidence shows that Mr. Paterno was made aware of the 1998 investigation of Sandusky, followed it closely, but failed to take any action, even though Sandusky had been a key member of his coaching staff for almost 30 years, and had an office just steps away from Mr. Paterno’s.

At the very least, Mr. Paterno could have alerted the entire football staff, in order to prevent Sandusky from bringing another child into the Lasch Building. Messrs. Spanier, Schultz, Paterno and Curley also failed to alert the Board of Trustees about the 1998 investigation or take any further action against Mr. Sandusky. None of them even spoke to Sandusky about his conduct. In short, nothing was done and Sandusky was allowed to continue with impunity.

That is an excerpt from the seven-page press release summarizing the findings in the full report. It is a bombshell. The four men in question are former Penn State president Graham Spanier, former athletic director Tim Curley, former administrator Gary Schultz and former head coach Joe Paterno. All four lost their jobs and their reputations last November over their apparently negligent reaction to an allegation against Sandusky in 2001; Curley and Schultz also face serious criminal charges stemming from that incident. Now, in light of confirmation that the most powerful men on campus had been confronted with the same charges against one of their own at least three years earlier, negligence is the least of their sins.

First, the facts. In 1998, an allegation by the mother of an 11-year-old boy (later identified in court documents as “Victim 6”) who claimed Sandusky had sexually assaulted him in a locker room shower led to an investigation by Penn State campus police and local law enforcement. That investigation resulted in a 95-page police report – but no charges against Sandusky.

Crucially, Spanier, Curley and Paterno later claimed to have no knowledge of the 1998 investigation into Sandusky, nor of the accusation that prompted it. By their accounts, they had no reason to suspect Sandusky of any wrongdoing (criminal or otherwise) prior to his retirement from Paterno’s staff in 1999. Freeh said today there is no evidence that Sandusky was forced out, and e-mails cited in the report indicate Paterno had no problem with his former player and longtime colleague continuing to serve as defensive coordinator. Following his retirement, Sandusky maintained “emeritus” status and regular access to university facilities. By all outward appearances, he remained a respected coach and upstanding citizen, venerated for his decades of work with troubled kids, and no one at Penn State – certainly not Joe Paterno, the most venerated man in American sports – had any reason to suspect otherwise. At least, until 2001.

Even by that account, the one in which everyone around Sandusky is completely oblivious to who he really was, there is no defense for the inaction that followed the 2001 accusation by then-graduate assistant Mike McQueary, who claims he personally witnessed Sandusky raping a young boy in a locker room shower. McQueary subsequently reported the incident to Paterno; Paterno ran it up the ladder to Curley, who consulted with Shultz, spoke with McQueary and ultimately let Sandusky off with a warning.

According to the Freeh Report, “the only known, intervening factor between the decision made on February 25, 2001, by Messrs. Spanier, Curley and Schulz to report the incident to the Department of Public Welfare, and then agreeing not to do so on February 27th, was Mr. Paterno’s February 26th conversation with Mr. Curley.” In short, nothing was done and Sandusky was allowed to continue with impunity. What could possibly be more damning than that?

Only this: That Penn State had already allowed Sandusky to operate with impunity for years even before McQueary came forward. If today’s report is correct – if “the evidence shows that Mr. Paterno was made aware of the 1998 investigation of Sandusky, followed it closely, but failed to take any action” – Paterno had had every reason to suspect that Sandusky was a violent predator for at least three years when McQueary walked into his office. Yet did nothing when those suspicions were confirmed, and did nothing for the next decade. The report could not have leveled a more devastating charge. The old man already knew.

In a sober, well-crafted response to the Freeh Report released this morning, Paterno’s family describes Sandusky as “a great deceiver,” and maintains that “many people didn’t fully understand what was happening and underestimated or misinterpreted events.” But after the report, there is only one possible interpretation. Joe Paterno and other Penn State officials continued to tolerate and to some extent shelter an alleged sex offender despite multiple, credible accusers over the course of more than a decade.

[continue reading…]

{ 5 comments }
Next Posts