≡ Menu

Antonio Brown has 1,586 receiving yards, most in the NFL, which puts him on pace for 1,813 receiving yards this season.

Adrian Peterson has 1,314 rushing yards, most in the NFL, which puts him on pace for 1,502 rushing yards in 2015.

That’s pretty weird.  In general, the rushing leader usually gains more rushing yards than the receiving yardage leader picks up through the air.  From 1970 to 2014, the receiving yards leader  “outgained” the rushing yards leader in only 10 of 45 seasons.  And in only three of those years did the receiving leader “win” by more than 100 yards: in 1999 (Marvin Harrison had 1663 receiving yards; his teammate Edgerrin James had 1553 rushing yards), 1990 (Jerry Rice over Barry Sanders, 1502 to 1304), and 1982 (Wes Chandler over Freeman McNeil in the strike-shortened season, 1032to 786). On a per-game basis, it’s tough to beat what Chandler did, but Brown is on pace to become the first receiving leader since the merger (in fact, the first in the NFL since 1952) to “outgain” the rushing leader by over 300 yards. [continue reading…]

{ 7 comments }

In 2014, the Denver Broncos ranked 4th in Adjusted Net Yards per Attempt; in case you forgot, Peyton Manning‘s “struggles” last year were really confined to the back end of the season. This year, the Broncos rank 31st in ANY/A, as Manning has been terrible and Brock Osweiler has been far below average. The Broncos ANY/A has dropped from 7.67 to 4.90, a decline of 2.77 ANY/A.

But that’s not even the biggest decline of 2015. Last year, the Dallas Cowboys ranked 2nd in ANY/A at 7.96; this year, without Tony Romo, the team is dead last at 4.76, for a decline of 3.20 ANY/A. Here is the full list of how passing offenses have improved/declined from 2014, which also shows why Carson Palmer is a pretty good choice for MVP: [continue reading…]

{ 7 comments }

A great article from Bill Barnwell this week, as he chronicled the rise of the improving Oakland Raiders.  At 6-7 and not playing in the NFC East or AFC South, the Raiders are not in the playoff hunt, but that’s not the only measure of a team’s success. Remember, Oakland started 0-10 last year.  Even that may be a bit of an understatement of where the team was, because the Raiders also lost their final six games of the 2013 season. [continue reading…]

{ 1 comment }

Pre-Week 15 WP: Carolina’s 13-0 Record

This week at the Washington Post,  a look at the other nine teams to begin a season 13-0.

The Carolina Panthers are 13-0. The team leads the NFL in points scored, with 411, and in points differential, at 168. Carolina has won an incredible 17 consecutive regular season games, and boasts arguably the best pass defense in the NFL, the most productive running game, and maybe even the best quarterback. In short, if you want to make an interesting comparison between the Panthers and another team, you’re going to need a time machine.

There have been 10 teams to begin a season 13-0. And, at least among those teams, Carolina falls near the bottom of the pack. The Panthers’ plus-168 points differential ranks ninth in that group, ahead of only the 2009 Colts that won seven of its first 13 games by eight or fewer points (the Panthers have won six such games).

You can read the full article here.

{ 0 comments }

The 2007 Patriots set all sorts of records, and are as good as you remember.  In fact, that New England team was even great when compared among great teams.  Through 13 games, the Patriots outscored opponents by 281 points, by far the best differential among teams since 1970.  Carolina’s +168 points differential, while good enough to lead the league in 2015, looks downright unimpressive by comparison.

But what’s often forgotten about that New England team is that it slowed down considerably during the season, perhaps due to age (the Patriots were the third oldest team in the NFL that year, by AV).  In case you forgot:

  • The 2007 Patriots outscored opponents by 25.4 points per game in New England’s first 10 games.
  • In the team’s final six games, the Patriots outscored opponents by 10.2 points per game.
  • In three playoff games, New England outscored opponents by 5.7 points per game.

We think of the ’07 Patriots as a dominant team, and they of course were.  But they were also a team that ran out of gas as the season went along, culminating in the Super Bowl loss.  New England covered the point spread, often by large amounts, in nine of the team’s first ten games. Then, the Patriots covered the spread in just one of New England’s final nine games.   While the ’07 Patriots were one of the greatest teams in football history, it’s also true that their story was a tale of two halves: an absurdly dominant first half, and a less-than-overwhelming second half, that failed to meet expectations. [continue reading…]

{ 20 comments }

2015 And Unique Scores

A fun couple of articles for you to read today, courtesy of Eldorado (@eldo_co) (with a hat tip to Football Outsiders).

Part I

Part II

The full articles are worth your read, but the premise: a record number of made field goals, a high number of missed extra points, and a ton of successful two-point conversions have lead to a record low number of “Football Scores.”

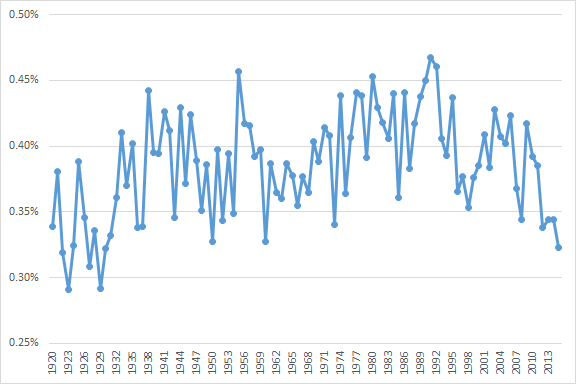
I wanted to run my own numbers on this, and while the effect using my methodology isn’t quite as extreme, 2015 does still stand out. I looked at the likelihood of every score occurring in NFL history (for example, (20-17 has occurred 1.6% of the time throughout NFL history, 17-14 and 27-24 1.3%, 23-20 and 13-10 at 1.1%, and so on). I then took the average likelihood of each score in each season, plotted below:
unique scores

From 1995 to 2014, the “average” final score score had a 0.38% likelihood of occuring; this year number has dropped to 0.32%. Again, that’s not quite as extreme as Eldorado’s results, but it is consistent in direction: 2015 is having some very unusual scores. In fact, the last time the average rate was at 0.32% was in 1930. This year, Tennessee beat Jacksonville 42-39, Pittsburgh beat San Francisco 43-18, and Pittsburgh beat Seattle 39-30; in each instance, those scores had never occurred before in NFL history.

{ 1 comment }
GronkSmash

GronkSmash

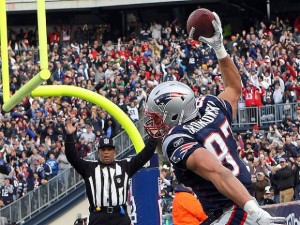
Rob Gronkowski is in a scoring slump. It’s one of the worst scoring slumps of his career. But more on that in a bit.

Jerry Rice once [1]Well, he actually did it three times, although the same 55 games were in all three stretches. caught 67 touchdowns over a 57-game period. This stretch was during all of 1987, 1988, and 1989 (including playoffs) and the start of the 1990 season. That pro-rates to an insane 19-touchdown per-season average for three-and-a-half seasons. Then again, the weirder thing is when Rice doesn’t top a receiving category.

Lance Alworth once caught 55 touchdowns [2]Three times, like Rice, with 55 of the same games. over one 57-game stretch from 1963 to 1967.

Only three other players since 1960 have ever had more than 50 touchdowns in any 57-game stretch (including playoffs): Randy Moss, Terrell Owens, and Art Powell, each of whom topped out at 53 touchdowns in 57 games. Cris Carter, Sonny Randle, Sterling Sharpe were at 49, Larry Fitzgerald was at 58, and Gary Collins, Anthony Freeman, Marvin Harrison, and Andre Rison were at 47.  Calvin Johnson topped out at 46 at one point in 2013.  Dez Bryant hit 46 in his last 57 after the Lions playoff game, but then went three straight games without a touchdown catch. [continue reading…]

References

References
1 Well, he actually did it three times, although the same 55 games were in all three stretches.
2 Three times, like Rice, with 55 of the same games.
{ 9 comments }

Antonio Brown caught caught 17 passes (on 23 targets) for an incredible 284 yards today against the Raiders. He also had two carries for 22 yards. But while 306 yards from scrimmage is insane, Brown wasn’t a one-man show: DeAngelo Williams rushed 27 times for 170 yards and two touchdowns, while catching two passes for 55 yards. Together, the duo combined for an insane 531 yards from scrimmage. That’s the most in the NFL by any duo since at least 1960… by a whopping 50 yards!

TeamOppYearDuo YFSPlayer 1YFSPlayer 2YFSBoxscore
PITOAK2015531Antonio Brown306DeAngelo Williams225Boxscore
OAKHOU1963481Art Powell247Clem Daniels234Boxscore
DETDAL2013451Calvin Johnson329Reggie Bush122Boxscore
PHIDET2007442Kevin Curtis221Brian Westbrook221Boxscore
BUFMIA1991422Thurman Thomas268Andre Reed154Boxscore
PITATL2002421Plaxico Burress253Hines Ward168Boxscore
INDBAL1998420Marshall Faulk267Torrance Small153Boxscore
CLENYG1965414Ernie Green222Jim Brown192Boxscore
PHISTL1962411Timmy Brown249Tommy McDonald162Boxscore
RAMMIA1976410Ron Jessie220Lawrence McCutcheon190Boxscore
WASDEN1987402Timmy Smith213Ricky Sanders189Boxscore
NYJBAL1972401Rich Caster204Eddie Bell197Boxscore
CHIMIN2013400Alshon Jeffery249Matt Forte151Boxscore
STLWAS2006400Steven Jackson252Isaac Bruce148Boxscore

But hey, Cleveland fans: the Steelers duo still wasn’t quite as good as Jerome Harrison and Josh Cribbs.

{ 2 comments }

This week at the New York Times, a look at how it’s a season for old quarterbacks:

Through eight weeks this season, over half of all passing yards have come from quarterbacks who are on the “wrong” side of 30. The same is true of passing touchdowns. What’s more incredible is that 55 percent of all wins this season have come from quarterbacks who are 30 years or older. Peyton Manning and Tom Brady are the two oldest starting quarterbacks in the N.F.L., but are two of the four quarterbacks on 7-0 teams. The top four leaders in passing touchdowns are 34 or older: Brady, Carson Palmer, Philip Rivers and Eli Manning. And the seven leaders in passing yards through eight weeks were 30 or older, too: Rivers, Brady, Matt Ryan, Palmer, Drew Brees, Joe Flacco and Eli Manning.

You can read the full article here.

{ 0 comments }

This week at the Washington Post, a look at one of the most surprising ten-game winning streaks in NFL history.

The 2014 Panthers entered December with a 3-8-1 record, and had not won a game in two months. Suffice it to say, they are one of the least likely teams to ever go on a 10-game winning streak. Prior to Carolina, there had been 140 teams since 1970 to go on a 10-game winning streak. On average, those teams had won 7.2 games in their previous 10 regular season games*, while all teams other than the 1975-76 Colts (who went 2-8 before going on an 11-game winning streak) had won at least four of their previous 10 games. The Panthers? They had gone an ugly 1-8-1 prior to ripping off 10 straight regular season wins.

You can full the article here.

{ 3 comments }

Young Jaguars Could Power Next Great Offense

The Broncos, Bengals, Falcons, and Packers won in week 5 to get to 5-0, while New England blew out Dallas to reach a 4-0 mark. So why, today, would I write about a Jaguars team that is now 1-4?

Because while Jacksonville is again in the NFL cellar, it’s anything but business as usual. I’m not quite sure how long it is going to take, but it feels like the next great NFL offense could be germinating in northern Florida. That’s because a young trio that has emerged this year while the team generally flies under the radar.

Blake Bortles has thrown for 1,299 yards and 10 touchdowns this year, against just 4 interceptions. As a rookie, Bortles threw for over 270 yards just twice; he’s done it three times in five games this year. As a rookie, Bortles had multiple touchdown passes in a game twice; he’s also done that three times in five games in 2015 so far, including a career high four on Sunday. Bortles is on pace to complete 346 passes for 605 yards (57.1%) for 4,157 yards, with a 6.87 Y/A average and an impressive 12.03 yards per completion rate. He’s also on pace for 32 touchdowns and 13 interceptions, along with 45 sacks (but for only 198 yards). He’s averaging 6.19 ANY/A — that’s right around league average, a pretty big jump from his 3.81 ANY/A average as a rookie. [continue reading…]

{ 5 comments }

Last year, the Cardinals started the season 8-1, but did so in a fashion that screamed, “UNSUSTAINABLE!” Here is what I wrote at the time last year:

The Cardinals have scored 223 points and allowed 170. That translates to just a 0.668 Pythagenpat winning percentage. That’s easily the worst of any team since 1990 to start 8-1 or 9-0.

The Cardinals promptly followed that up by going 3-2 over their next five games despite being outscored by 10 points! But then Ryan Lindley took over, and Arizona lost their final three games of the year.

This year, the Cardinals started the season in a fashion not-too-dissimilar from what we saw from them last year: Arizona defeated New Orleans, 31-19, but only thanks to a 55-yard touchdown to David Johnson in the final two minutes.

But since then, Arizona won 48-23 against the Bears and 47-7 against the 49ers yesterday. Through three weeks, the Cardinals have outscored opponents by a whopping 77 points, which is tied for the 13th best margin through three weeks among all teams since 1950. The good news for Arizona fans: the first 12 all made the playoffs, three won it all, and five more lost in the title game. [continue reading…]

{ 2 comments }

Brees may not be throwing for awhile

Brees may not be throwing for awhile

Ian Rapoport is reporting that Drew Brees may miss several games with a shoulder injury. That’s tough news for all involved, including those who will now have to watch a bad Saints team led by Luke McCown (or Garrett Grayson). But it also could mark the end of a weird bit of trivia.

Believe it or not, Marques Colston and Brees have connected for 72 touchdowns, tied with Philip Rivers and Antonio Gates for the 5th most in NFL history by any receiver/quarterback combination. I’ve written about that streak before, but here’s something else unique to consider: Colston has never caught a touchdown pass from anyone other than Brees. [continue reading…]

{ 4 comments }

Guest Post: How Good Was The Super Bowl Champ Last Year?

Longtime commenter Jason Winter has chimed in with today’s guest post. Jason is a part-time video game journalist and full-time sports fan. You can read more of him at his blog: https://jasonwinter.wordpress.com/, and follow him on twitter at @winterinformal.

As always, we thank Jason for contributing. He submitted this article a couple of weeks before the season began, but I was a bit tardy in posting. But hey, it’s still relevant.


A couple of months ago, I happened upon Peter King’s NFL power rankings, where he listed Baltimore as his #1 team. “Really?” I thought. I mean, they were pretty good last year, going 10-6, but they were the #6 seed in the AFC and hadn’t done anything really notable in the offseason. Surely you wouldn’t rank them above obvious powerhouses like Seattle, New England, Green Bay, Indianapolis, or Denver, right?

We know that the best teams in any given year rarely are the best the next year. And sometimes teams can have complete turnarounds – for better (like the 1998-1999 Rams) or worse (like the 1993-1994 Oilers). But how uncommon would it be for a team like the 2014 Ravens to actually be the best team – or at least the Super Bowl winner – the next year?

Excluding the years following the two strike-shortened years, I took every Super Bowl-winning team in the NFL in the 16-game-season era and looked at how good they were the year before winning it all. I charted each team’s wins and SRS the previous year, as well as their league-wide rank in wins and SRS in those years. In case of ties, I averaged out the ordinal rankings, which is why you’ll see several fractional rankings in the table below. [continue reading…]

{ 3 comments }

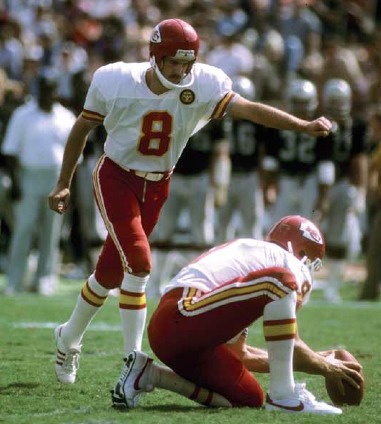
Nick the Kick

Nick the Kick

On Tuesday, I explained the formula used in my system of grading field goal kickers, which is based on field goal success rate adjusted for distance and era.  Yesterday, I looked at the single-season leaders using that methodology. Today, we look at the best field goal kickers since 1960 on the career level.

And frankly, it’s not much of a question as to who is the best kicker ever. Until presented with evidence to the contrary, that honor belongs to Nick Lowery (you can tell him about that here). The table below shows the top field goal kickers ever; let’s walk through Lowery’s line as an example.

Lowery played from 1978 to 1996. The length of his average field goal attempt was 36.6 yards, and the length of his average made field goal was 34.8 yards. Lowery attempted 479 field goals in his career; based on the distance of those kicks and the era in which he played, we would expect an average kicker to have made about 337.6 of those attempts. Instead, Lowery made 383 of them, a whopping 45.4 field goals above expectation. Thought of another way, Lowery’s expected field goal rate was 70.5%, while his actual was 80.0%, so he was successful an extra 9.5% of the time he lined up to kick. That’s remarkable. In short, Lowery was the most valuable field goal kicker in NFL history. [continue reading…]

{ 76 comments }

In 1983, there were 46 field goal attempts of 52 yards or longer. That year, just 17 of them were successful… and four of them came from Baltimore Colts rookie kicker Raul Allegre. But that’s just the highlight for perhaps the best kicking season ever.

During the Colts last year in Baltimore, fans voted Allegre the team’s most valuable player. And with good reason: Allegre attempted 35 field goals, but given the distances of those kicks and the kicking environment in 1983, we would have expected Allegre to make 21.2 of those attempts. Instead, Allegre connected on 30 field goals, giving him 8.8 more field goals above average. That’s the highest rate in any single season ever. Yesterday, I unveiled a methodology for ranking kickers, based on two factors: the length of each field goal attempts and the year in which they kick was attempted. Using that formula, I then was able to grade every field goal kicking season since 1960.

Let’s use Nick Lowery’s 1985 season to walk through the table below. That year, playing for the Chiefs, Lowery went 4/4 on kicks from 20-29 yards, 10/11 from 30-39 yards, 7/7 from 40-49 yards, and 3/5 from over 50 yards. (Note that while I have the data on the specific distance of each attempt, it made sense to present it for consumption in this way.) He attempted 27 kicks, and given the distances and the era, was expected to be successful on 17.2 of them. Instead, he made 24, giving him 6.8 field goals above average. If you prefer to think in terms of rates, Lowery was expected to be true on 63.7% of kicks, but actually made 88.9% of his attempts; that’s 25.2% above expectation, the highest rate by any kicker with at least 25 attempts. The table below shows the top 300 seasons since 1960: [continue reading…]

{ 13 comments }

Six years ago, I took my first crack at analyzing field goal kickers. I have been meaning to update that article for each of the last three offseasons, and with the sun setting on the 2015 offseason, I didn’t want to let this slip yet again.

Ranking field goal kickers is not difficult conceptually, but it can be a bit challenging in practice. One thing I’ve yet to refine is the appropriate adjustments for playing surface, stadium, time of game, temperature, and wind. That’s a lot of adjustments to deal with, all on top of the most obvious adjustment: for era.

But as I understand it, Rome was not built in a day; further, I believe that a journey of a thousand miles begins with one step. As a result, I’m okay with only getting part of the way there for now, and punting (which is very, very different from kicking) the rest of this process to next offseason.

Let’s begin with the obvious: era adjustments are really, really, important.  To provide some examples, I looked at the field goal rates at four different increments: 22-24 yard kicks, 31-33 yard attempts, kicks from 40-42 yards away, and finally, field goal attempts from 49-51 yards.  In the graph below, I’ve plotted the success rate at those four distances for each year since 1960, along with a “best-fit” curve at each distance. Take a look: [continue reading…]

{ 5 comments }

Most Memorable Plays For Each NFC Team

Yesterday, we looked at the most memorable plays for each AFC team. Today, we switch to the NFC, and let’s begin in the NFC East.

Dallas Cowboys: Emmitt Smith, with one good shoulder, runs for 10 yards to put Dallas in field goal range against the Giants in week 17, 1993

For a franchise with as proud a history as the Cowboys, there are some painful memories to consider: the Tony Romo bobbled snap against the Seahawks, Leon Lett against the Bills (and Dolphins), the ending of the Ice Bowl, the Tom Brown end zone interception of Don Meredith to clinch the 1966 NFL championship game, the Dez Bryant “incomplete” pass last year, and Jackie Harris starring in the Sickest Man in America.

But when it comes to the Cowboys, the mind immediately goes to the dynasty built in the ’90s. That team cemented its place in the game’s history by repeating as Super Bowl champions in 1993, and much of the credit for the title goes to winning in week 17 against the Giants. A loss in that game would have made the Cowboys a Wild Card team, while a win gave Dallas the number one seed. And that game turned out to be the most memorable of Emmitt Smith’s career. Playing much of the game on shoulder, he totaled a career high 41 touches. Here’s the play in question, and Smith carrying Dallas to victory that day remains the most iconic memory of one of the franchise’s greatest players. A close runner up: the original Hail Mary, from Roger Staubach to Drew Pearson against the vikings in the 1975 playoffs. But that game didn’t lead to a Super Bowl championship. [continue reading…]

{ 17 comments }

Most Memorable Plays For Each AFC Team

The other day, the Sporting News produced a slideshow of the most iconic plays in franchise history for each of the 32 teams in the NFL. That’s a fun idea, and something I think this community would enjoy thinking about, so I wanted to spend this weekend discussing what we view as the most memorable/iconic/incredible plays for each franchise. For each team, I’ll cast my opinion (which may or may not be the same as what the SN chose), but I’m really more interested in your thoughts. Today, we’ll do the AFC; tomorrow, the NFC. Let’s begin in the AFC East, with a franchise that’s most memorable play was probably a painful one.

Buffalo Bills: Scott Norwood, Wide Right, Super Bowl XXV [continue reading…]

{ 45 comments }

Why Do Teams Run The Ball, Part II

Seven and a half years ago, I asked the question, why do teams run the ball? Today, I want to revisit that post, given that a lot has happened over the last seven and a half years.

Let’s begin my analyzing league-wide pass and rush efficiency. To measure rush efficiency, we will use Adjusted Yards per Carry, which is calculated as follows:

(Rush Yards + 11 * Rush TDs + 9 * Rush First Downs) / (Rushes)

For passing, we will use a modified version of ANY/A by also giving credit for first downs. Here’s the formula:

(Gross Pass Yards – SackYardsLost + 11 * Pass TDs + 9 * Pass First Downs – 45 * INTs) / (Pass Attempts + Sacks)

[continue reading…]

{ 22 comments }

Best Quadruplets in NFL History (Single-Season)

The ’90s Cowboys had the Triplets — Troy Aikman, Emmitt Smith, and Michael Irvin — that helped define the team’s dynasty. Well, the modern Packers have not just an outstanding quarterback, a great running back, and one excellent wide receiver: they have two excellent wide receivers.

Let’s take some “basic” stats and see how the 2014 Packers fared:

  • To measure quarterbacks, let’s use Adjusted Net Yards per Attempt. Aaron Rodgers ranked 1st in ANY/A last year.
  • To measure running backs, we can use the most basic measurement out there: rushing yards. Eddie Lacy ranked a respectable 7th in rushing yards.
  • To measure wide receivers (and tight ends), let’s use Adjusted Catch Yards, which is receiving yards with a 5-yard bonus for receptions and a 20-yard bonus for receiving touchdowns. Jordy Nelson ranked 3rd in ACY last year, while Randall Cobb ranked 8th.

Where does that rank since 1970? Well, one thing we could do is just add the ranks: 1 + 7 + 3 + 8 = 19. That’s a pretty good score for a group of four players, but it’s not the best ever. It’s tied with two other teams for 6th best ever. Can you guess which team since 1970 has the best score using this methodology? While you think about it, let’s look at the other teams to produce a score of less than 20. [continue reading…]

{ 57 comments }

Back in December 2009, Jason Lisk wrote about a recent trend in the NFL: quarterbacks throwing for 300 passing yards and actually winning. Jason wondered whether that was something fluky, or a sign of the shifting nature of the NFL. With the benefit of hindsight, I think the answer is…. well, I think it’s pretty clear.

Including playoffs, quarterbacks who threw for 300+ yards in a game during the 2009 season won an incredible 63.3% of games. And that mark remains the highest in modern history. Over the last five years (2010 to 2014), quarterbacks have won 52% of games when cracking that mark; during the decade of the ’90s, quarterbacks won 53% of their games when throwing for 300+ yards.

Of course, the likelihood of a quarterback throwing for 300+ yards has increased significantly. Over the last four years, quarterbacks have thrown for 300+ yards in 25% of all games, an enormous increase relative to most of NFL history. The graph below shows both pieces of information: in blue, and measured against the left Y-Axis, shows winning percentage by year when a quarterback throws for 300+ yards; in red, and against the right Y-Axis, is the percentage of all games where a quarterback hit the 300+ yard mark: [continue reading…]

{ 20 comments }

Guest Post/Contest: PFRWhacks

Today’s guest post/contest comes from Adam Harstad, a co-writer of mine at Footballguys.com. You can follow Adam on twitter at @AdamHarstad.


Like most of you, [1]I assume. I like to spend my weekends building custom databases of NFL statistics. This past weekend, while doing just that, I happened to notice that Marshall Faulk topped 2,000 yards from scrimmage in both 2000 and 2001 despite playing just 14 games each year. Which sent me scrambling to the Pro-Football-Reference.com player season finder [2]Obviously. so I could share on Twitter the novel observation that Marshall Faulk was, indeed, good at football.

As luck would have it, the humble proprietor of Football Perspective just happened to be sitting at home, trolling around on Twitter, and likewise playing with various historical databases. [3]On second thought, I doubt luck played any role. He saw my tweet and responded in kind, with a list of all NFL players sorted by average yards per game from age 25 to 28.

All of this inspired a fun back-and-forth between various other users on Twitter which culminated in me providing a list of all running back seasons with 250+ carries and 50+ yards per game receiving. It’s a rather short list featuring just 8 total seasons. Marshall Faulk accounted for four of those eight seasons, consecutively, from 1998 to 2001.

I quickly noticed an interesting thing about that last list, though. Not only did Marshall Faulk account for half of those seasons in NFL history, but he actually had the top four by receiving yards per game. In fact, if we adjust our “receiving yards per game” baseline from 50 to 54, we wind up with this list, instead.

Now that is a rather more impressive list. Using just two simple cutoffs, we had managed to create a list that was just four names long, and every single one of those names was “Marshall Faulk.”

Seguing away for a second… in the early days of the internet, before there were continents composed solely of cat pictures (or handy NFL season finders to query, for that matter), people would resort to pretty much anything to keep themselves entertained. One game that sprung from these dark times was known as “Googlewhacking”. A Googlewhack was two words that, when entered together into the search bar of the eponymous Google, matched just a single result on the entire internet.

For instance, there was once a time when searching the words “ambidextrous scallywags” (but without the quotation marks) would return just a single match. This was then a successful Googlewhack. Googlewhacks were, by their very nature, ephemeral constructs, since the very act of publishing a Googlewhack would cause the published result to show up on Google and would therefore cause the words to lose their Googlewhack status. [continue reading…]

References

References
1 I assume.
2 Obviously.
3 On second thought, I doubt luck played any role.
{ 41 comments }

There are 23 quarterbacks who have won both a championship (as a starter) and a Most Valuable Player award in professional football history. Can you name them? First, let’s get to the fine print:

  • To determine championships, I began in 1936. I awarded half a ring to each of the championship quarterbacks in the AAFC and NFL from 1946 to 1949, and half a ring to the two championship quarterbacks in the AFL and NFL from 1960 to 1965. For purposes of this post, I am including all quarterbacks with “half a ring”, but when I list career totals, keep the half-ring idea in mind.
  • Based on sharing of quarterback duties, I awarded half-rings to the quarterbacks on the NFL champions in 1939, 1951, 1972, and 1990. For the NFL champion in 1970, I also awarded half a ring to that team’s top two quarterbacks, since the starter left while trailing in the Super Bowl. If you disagree with my awarding of half rings in this manner, don’t worry about.  I’ve spelled out the relevant information in the post below, so feel free to manipulate the system as you desire.  If so inclined, you can dismiss the early AFL years or give full credit to both MVPs in a particular season, for example.
  • For MVPs, I used the Joseph F. Carr award from ’38 to ’46. Then I used the UPI for the next ten years, or the Washington D.C. Touchdown Club award when the UPI didn’t name an MVP. Those years were 1947 (which, as it turns out, was one of the easiest seasons to identify), 1949, 1950, and 1952. Then I used the AP for every year since for simplicity’s sake (i.e., just using what is listed on PFR, not out of a misguided notion that the AP is the end-all, be-all source for MVP voting). I gave the AFL and NFL MVP half an award in each year from 1960 to 1969, and I also assigned only half credit to the shared MVPs in ’97 and ’03 (the award was also split in ’49).

[continue reading…]

{ 29 comments }

Yesterday, we looked at which teams had the most pass attempts (including sacks) in individual games relative to league average. Today, we will analyze things on the season level.

Let’s use Tobin Rote as an example. As Brad Oremland noted, Rote was stuck playing for terrible Packers teams in the ’50s that were weak on defense and light at running back. In 1951, Green Bay ranked 12th in the 12-team NFL in rushing attempts, rushing yards, and rushing touchdowns, and 11th in points allowed and yards allowed. The Packers often went with just one running back in the backfield — a rarity in those days — which is a sign that the emphasis on the passing game wasn’t just a result of the team’s losing record. Green Bay also went with a quarterback-by-committee approach: Rote started 11 of 12 games, but he finished the year with 256 pass attempts, while backup Bobby Thomason had 221. Individually, neither had great numbers, but together, they helped Green Bay finish with 50 more pass attempts than any other team in football.

The method I used yesterday, and will be using throughout this series, is to give the starting quarterback credit for all team pass attempts in that game. The reason? If a quarterback gets injured and finishes a game with just 5 attempts, that will kill his average in a misleading way. That would do more harm, I think, than giving him credit for all attempts in the game. But that decision has its drawbacks, and in particular, it seems ill-suited for teams in the early ’50s that employed a QBBC approach. This is particularly relevant here, because “Rote’s” 1951 season checks in as the most pass-happy on our list.

So the Rote line for ’51 should really be thought of as Rote and Thomason. Rote’s 1956 season also makes the top ten, and there’s no fine print necessary there. Rote started 11 of 12 games and threw 308 passes, while Bart Starr started the remaining game and had just 44 attempts that season. The ’56 Packers were not very good, ranking last in both points and yards allowed, and last in rushing attempts, too.

The table below shows the top 300 seasons (minimum 7 games started) in terms of pass attempts relative to league average. You can use the search function to see that Rote’s season in 1954 with Green Bay also makes the cut. To explain what’s in the table below, let’s use season #15 on the list, Shane Matthews in 1999, as an example. That year, Matthews started 7 games, but in those games, the Bears averaged an incredible 47.1 dropbacks per game, the second highest rate ever. Matthews shared some snaps with rookie Cade McNown that year, so you wouldn’t know it just by looking at Matthews’ raw numbers, but the ’99 Bears were insanely pass-happy under Gary Crowton. The league average was 36.3 dropbacks per game, so the Bears in “Matthews games” were 10.8 attempts above average, and 129.8% above league average. [continue reading…]

{ 6 comments }

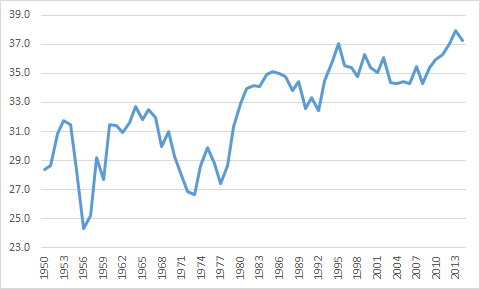
Let’s take a look at the league average dropbacks (pass attempts + sacks) per game for each year from 1950 to 2014.

dropback per game [continue reading…]

{ 22 comments }

You remember 1976, don’t you? Two teams — the Colts with Bert Jones and Roger Carr, and the Raiders with Ken Stabler and Cliff Branch — stood out from the pack when it came to pass efficiency that season. The Colts led the NFL in passing yards, ranked 2nd in passing touchdowns, and threw just 10 interceptions, tied for the fewest in the NFL. Oakland threw 33 touchdown passes — nine more than the Colts and 12 more than any other team in football — while ranking 3rd in passing yards. Both teams averaged 7.5 Net Yards per Pass Attempt, while every other team was below seven in that metric. Those two teams went a combined 24-4.

The next four best passing teams were St. Louis, Dallas, Minnesota and Los Angeles. Each of those teams went 10-4 or better. In fact, the linear relationship between pass efficiency and team record was quite strong that year. Take a look at the chart below, which plots Relative ANY/A — i.e., Adjusted Net Yards per Attempt relative to league average — on the X-Axis, and Winning Percentage on the Y-Axis: [continue reading…]

{ 21 comments }

Yesterday, I looked at the best defenses in football history in terms of (estimated) points allowed on an (estimated) per drive basis. Today, the reverse: the worst defenses in history, at least, without adjusting for era, in terms of points allowed per drive.

The 1981 Colts take the top spot, and that’s not going to be a surprise to any fan of NFL history. Those Colts teams were terrible, particularly on defense. In ’81, Baltimore beat New England 29-28 in week 1, beat New England 23-21 in the last game of the season, and lost every game in between. In ’82, Baltimore finished 0-8-1. In fact, beginning in December 1980, over the team’s next 31 games, the Colts went 3-1 against the Patriots and 0-26-1 against the rest of the NFL! And beginning in ’81, the Colts went 24 straight games without being favored.

The ’81 Colts finished last in just about every defensive category, including points, yards, turnovers, first downs, passing touchdowns, rushing touchdowns, and net yards per attempt. Baltimore’s defense ranked in the bottom three in both rushing yards and passing yards, too. Baltimore allowed 533 points, which remains the most in a single season in NFL history, undisturbed by the modern era. [continue reading…]

{ 2 comments }

The Purple People Eaters

The Purple People Eaters

The 1969 Minnesota Vikings were really good on defense. It began with the defensive line, as that Minnesota squad was the only team in NFL history to send all four defensive linemen to the Pro Bowl. Alan Page, Carl Eller, Jim Marshall, and Gary Larsen may have been the greatest combination of defensive linemen playing together in their primes in NFL history. The Vikings also had Hall of Fame safety Paul Krause playing in the prime of his career.

Minnesota was quarterback by Joe Kapp, but propped up by the defense: after the season, Kapp was traded to the Patriots, and proceeded to suffer the second worst decline in passer rating in NFL history. The Vikings went 12-2 that season, losing on opening day and in a meaningless game at the end of the year.

Minnesota allowed just 133 points, or 9.5 points per game, in 1969. That’s the 2nd fewest in a season since World War II, trailing only the Gritz Blitz 1977 Falcons. The Vikings allowed 16 touchdowns in 1969, but four came on returns (two on interceptions, one fumble, one interception)! Exclude those, and the Vikings allowed just 84 points on touchdowns and 21 points on field goals, for a total of 105 points allowed to the opposing offense. [continue reading…]

{ 11 comments }

As regular readers know, PFR’s Approximate Value statistic uses Offensive Points Per Estimated Drive (OPPED) as its base statistic. Given the discussion yesterday regarding estimates drives and scoring, I thought it would be useful to provide a list of the single-season leaders since 1950 in this metric.

Let’s use the 2007 Patriots as an example. For modern teams, we have the data available on how many drives each team had, but for historical teams, it’s not so easy. There are two ways we can measure drives for all teams. One is to measure the end of drives. For example, the ’07 Patriots had:

  • 50 passing touchdowns;
  • 9 interceptions;
  • 17 rushing touchdowns;
  • 24 field goal attempts;
  • 45 punts;
  • 6 fumbles lost; and
  • 0 safeties (i.e., the offense was never sacked in the end zone)

That gives us a total of 151 estimated drives. What we’re missing here are drives that end when the clock runs out and turnovers on downs. Unfortunately, that data is simply not out there historically, although it’s probably not all that important (and, at least with respect to the former, those drives arguably should be excluded, anyway).

We can also measure the start of drives.  The ’07 Patriots:

  • Played 16 games, which means 16 times where the team received the ball at the start of each half;
  • Recorded 0 safeties recorded on defense (which would lead to a possession);
  • Allowed 23 passing touchdowns;
  • Forced 19 interceptions;
  • Allowed 7 rushing touchdowns;
  • Faced 14 opponent field goal attempts;
  • Forced 76 punts;
  • Forced and recovered 12 fumbles.
  • In addition, New England also had 3 pick sixes and returned 3 fumbles for touchdowns.  as a result, we need to subtract 6 from our total, since those turnovers did not lead to drives for the offense.

This method of estimating drives isn’t perfect, either, but if we average the two results, hopefully we get something pretty close.  New England’s offense had 161 estimated drives by this metric, giving them an averaged of 156 estimated offensive drives. [1]Note that the Patriots went 15/21 on 4th down attempts that year. FWIW, Football Outsiders has New England with 158 offensive drives.

What about estimated points? That one is relatively simple:

  • Award 7 points for each rushing touchdown or passing touchdown;
  • Award 3 points for each made field goal

There are flaws here, well, but this is probably the best we can do.  By this method, New England had 532 estimated offensive points, and 3.41 OPPED.  That is the most of any team since 1950.  The full list:

RkTeamYrLgEst Drive (End)Est Drive (St)Est OptsOPPED
1New England Patriots2007NFL1511615323.41
2New Orleans Saints2011NFL1621675183.15
3Green Bay Packers2011NFL1621735133.06
4Minnesota Vikings1998NFL1681685113.04
5Indianapolis Colts2004NFL1581704872.97
6Denver Broncos2013NFL1901995722.94
7New England Patriots2010NFL1491684582.89
8St. Louis Rams2000NFL1701875132.87
9San Diego Chargers1982NFL991022862.85
10New England Patriots2012NFL1721815002.83
11Green Bay Packers2014NFL1521634452.83
12New England Patriots2011NFL1661764832.82
13Miami Dolphins1984NFL1651874962.82
14Indianapolis Colts2007NFL1511554262.78
15San Francisco 49ers1994NFL1601754652.78
16Indianapolis Colts2006NFL1441594142.73
17Kansas City Chiefs2004NFL1631764572.7
18San Francisco 49ers1993NFL1551684332.68
19St. Louis Rams2001NFL1731774682.67
20Indianapolis Colts2005NFL1461634122.67
21Dallas Cowboys2014NFL1661694462.66
22San Diego Chargers2009NFL1501644182.66
23Denver Broncos1998NFL1741874752.63
24San Francisco 49ers1992NFL1491644112.63
25San Diego Chargers2006NFL1711874702.63
26Dallas Cowboys1995NFL1541594102.62
27New Orleans Saints2008NFL1611794442.61
28New England Patriots2014NFL1641714342.59
29Green Bay Packers1962NFL1501563952.58
30San Diego Chargers2008NFL1531654102.58
31Kansas City Chiefs2002NFL1601844402.56
32Washington Redskins1983NFL1962055122.55
33Washington Redskins1991NFL1721814502.55
34Houston Oilers1961AFL1871974892.55
35San Diego Chargers2004NFL1651744312.54
36New Orleans Saints2009NFL1701854512.54
37Houston Oilers1990NFL1491613922.53
38San Francisco 49ers1984NFL1731814462.52
39St. Louis Rams1999NFL1741804452.51
40San Diego Chargers2010NFL1661664172.51
41Minnesota Vikings2009NFL1721864492.51
42Indianapolis Colts2003NFL1661754262.5
43Denver Broncos2014NFL1731934572.5
44New England Patriots2008NFL1531694022.5
45New England Patriots2004NFL1601624012.49
46Jacksonville Jaguars2007NFL1461643852.48
47New England Patriots2009NFL1571714072.48
48Dallas Cowboys2007NFL1681774282.48
49Cincinnati Bengals2005NFL1601744132.47
50San Francisco 49ers1989NFL1671814302.47
51New York Giants2012NFL1621684072.47
52Green Bay Packers2009NFL1721784312.46
53San Diego Chargers2011NFL1531603852.46
54Oakland Raiders2002NFL1581734072.46
55New Orleans Saints2013NFL1611774152.46
56Cincinnati Bengals1988NFL1671764212.45
57San Francisco 49ers1987NFL1721814332.45
58San Diego Chargers1981NFL1892014772.45
59Buffalo Bills1990NFL1561683962.44
60San Diego Chargers2013NFL1551643892.44
61Kansas City Chiefs2003NFL1761854402.44
62Atlanta Falcons2012NFL1631714072.44
63San Francisco 49ers1998NFL1872024742.44
64New York Giants2008NFL1581724022.44
65Buffalo Bills1991NFL1731884392.43
66Minnesota Vikings2004NFL1481673832.43
67Indianapolis Colts2009NFL1581703982.43
68San Francisco 49ers1953NFL1461563662.42
69Green Bay Packers1961NFL1471533632.42
70Miami Dolphins1986NFL1701834272.42
71Seattle Seahawks2005NFL1761824322.41
72Detroit Lions1995NFL1681864272.41
73Baltimore Colts1976NFL1641764102.41
74Los Angeles Rams1950NFL1801804342.41
75New Orleans Saints2014NFL1591734002.41
76Minnesota Vikings2000NFL1601683952.41
77San Francisco 49ers1995NFL1611683962.41
78Baltimore Colts1964NFL1641764082.4
79Indianapolis Colts2014NFL1831904472.4
80Kansas City Chiefs1966AFL1711774162.39
81New Orleans Saints2012NFL1741834252.38
82Oakland Raiders2000NFL1721874262.37
83Buffalo Bills1975NFL1651774052.37
84Miami Dolphins1972NFL1521633732.37
85Indianapolis Colts2008NFL1361523402.36
86Los Angeles Rams1951NFL1611573752.36
87Dallas Cowboys1966NFL1711754082.36
88Carolina Panthers2011NFL1641713952.36
89Cleveland Browns1966NFL1561703842.36
90Pittsburgh Steelers2014NFL1581723882.35
91Indianapolis Colts2010NFL1681734002.35
92Denver Broncos2000NFL1701894212.35
92Denver Broncos2012NFL1741854212.35
94Houston Texans2010NFL1551773892.34
95Green Bay Packers2012NFL1691784062.34
96Baltimore Colts1958NFL1481643652.34
97New York Giants1963NFL1731794112.34
98San Diego Chargers2005NFL1731754062.33
99Washington Redskins2012NFL1601783942.33
100San Francisco 49ers2001NFL1621733902.33
101Green Bay Packers1995NFL1641773962.32
102Detroit Lions1972NFL1361523332.31
103Chicago Bears2013NFL1671733932.31
104Cincinnati Bengals1982NFL91972172.31
105Baltimore Ravens2014NFL1571803882.3
106Seattle Seahawks2012NFL1541703732.3
106New York Giants1967NFL1561683732.3
108New York Jets1982NFL1001052362.3
109Indianapolis Colts2000NFL1691824042.3
110Cincinnati Bengals1985NFL1771964292.3
111New England Patriots2013NFL1821854222.3
112Cleveland Browns1960NFL1321433162.3
113Philadelphia Eagles2013NFL1811904262.3
114Carolina Panthers1999NFL1751834112.3
115Seattle Seahawks2014NFL1541713732.3
116Miami Dolphins1995NFL1681713892.29
117Denver Broncos1997NFL1651833992.29
118Cleveland Browns1964NFL1501643602.29
119Dallas Texans1962AFL1621803922.29
120Green Bay Packers2007NFL1681763942.29
121Dallas Cowboys2006NFL1631773892.29
122Denver Broncos2008NFL1511603552.28
123Denver Broncos1995NFL1631703802.28
124Baltimore Colts1959NFL1401583402.28
125Chicago Bears1995NFL1591723772.28
126Green Bay Packers2003NFL1791894192.28
127Baltimore Colts1968NFL1551633622.28
128Arizona Cardinals2008NFL1631803902.27
129Carolina Panthers2008NFL1711803992.27
129Dallas Cowboys2013NFL1721793992.27
131San Francisco 49ers1965NFL1691723872.27
132Minnesota Vikings2003NFL1601783832.27
132Cleveland Browns1968NFL1641743832.27
134Baltimore Colts1967NFL1541653612.26
135Miami Dolphins1975NFL1531603542.26
136Miami Dolphins1994NFL1671703802.26
137Miami Dolphins1985NFL1771924162.25
138San Diego Chargers1963AFL1721723872.25
138New Orleans Saints2010NFL1611673692.25
140Pittsburgh Steelers2007NFL1581713702.25
141Kansas City Chiefs2005NFL1641763822.25
142Green Bay Packers2013NFL1691813932.25
143Green Bay Packers2004NFL1681773872.24
144Atlanta Falcons2010NFL1651723782.24
145Green Bay Packers1996NFL1681883992.24
146Detroit Lions2011NFL1851924222.24
147Chicago Bears1965NFL1621743762.24
148San Francisco 49ers1991NFL1631753782.24
149Dallas Cowboys1968NFL1681723802.24
150New York Jets1998NFL1691813902.23
151San Francisco 49ers2000NFL1581783742.23
152Philadelphia Eagles2010NFL1821944182.22
153Indianapolis Colts1999NFL1691813892.22
154Cincinnati Bengals1981NFL1791894092.22
155Dallas Cowboys1980NFL1832004252.22
156Washington Redskins1999NFL1771924092.22
157St. Louis Rams2003NFL1831884112.22
158Atlanta Falcons2011NFL1651803822.21
159Los Angeles Rams1973NFL1581773702.21
160Atlanta Falcons2008NFL1561703602.21
161New York Jets2008NFL1611713662.2
162San Diego Chargers1985NFL2022094532.2
163Dallas Cowboys1993NFL1541693562.2
164New York Giants1962NFL1651793792.2
165New Orleans Saints1987NFL1771874002.2
166New Orleans Saints2006NFL1721843912.2
167Dallas Cowboys1971NFL1711783832.19
168Jacksonville Jaguars1997NFL1621783732.19
168Dallas Cowboys1992NFL1631773732.19
170Cincinnati Bengals1989NFL1671843852.19
170Denver Broncos1996NFL1711803852.19
172Oakland Raiders1972NFL1561653522.19
173Atlanta Falcons1998NFL1731843912.19
174Seattle Seahawks2013NFL1711823862.19
175San Francisco 49ers2012NFL1661703672.18
176Dallas Cowboys1994NFL1691803812.18
177Denver Broncos2002NFL1601813722.18
178New York Jets1972NFL1581673542.18
179Kansas City Chiefs1967AFL1691723712.18
180Denver Broncos2005NFL1641793732.17
181Tennessee Titans2003NFL1711833832.16
182Buffalo Bills1998NFL1711873862.16
183Miami Dolphins2014NFL1581763602.16
184Cleveland Browns1987NFL1631753642.15
185Chicago Bears1956NFL1421583232.15
186Cincinnati Bengals1986NFL1771903942.15
187San Francisco 49ers1983NFL1711863832.15
188Minnesota Vikings2002NFL1781803842.15
189Los Angeles Rams1989NFL1821964052.14
189New England Patriots2006NFL1681823752.14
189Green Bay Packers2010NFL1631733602.14
192Dallas Cowboys1973NFL1601753582.14
193New York Giants2009NFL1691823752.14
194Atlanta Falcons2002NFL1751843832.13
195Cleveland Browns1980NFL1661753632.13
196Pittsburgh Steelers2005NFL1631813662.13
197Philadelphia Eagles2004NFL1691843752.12
198Seattle Seahawks1987NFL1631753592.12
198Baltimore Colts1965NFL1641743592.12
200Atlanta Falcons2014NFL1621773602.12

References

References
1 Note that the Patriots went 15/21 on 4th down attempts that year. FWIW, Football Outsiders has New England with 158 offensive drives.
{ 13 comments }
Next Posts Previous Posts