≡ Menu

Turnover Among Targets, Part I

Cam may need to really be Superman in 2014

Cam may need to really be Superman in 2014.

The Carolina Panthers have experienced a lot of turnover this offseason. Steve Smith (Baltimore), Ted Ginn (Arizona), Domenik Hixon (Chicago), and Brandon LaFell (New England) are all gone. Those four players were the only wide receivers to catch a pass for Carolina in 2013, and they accounted for 59% of the Panthers receiving yards. last year. What does this mean for Cam Newton? Last August, a couple of star quarterbacks appeared to be going through some similarly significant turnover among their targets.

Tom Brady lost four of his top five targets from 2012 and the fifth was Rob Gronkowski; in retrospect, most people underestimated how big of an impact this would have on Brady’s numbers. Meanwhile, Ben Roethlisberger’s receivers were a big question mark entering the season, but a monster year from Antonio Brown prevented Roethlisberger’s numbers from tanking. As it turned out, Roethlisberger didn’t wind up having much turnover, but the quarterback who experienced the second-most turnover wound up winning the Comeback Player of the Year award.

For Carolina, I think some of the departures have been overblown. The defense should again be one of the best in the NFL, and it’s not as though the passing game was outstanding last year. Greg Olsen led the team in receptions, receiving yards, and receiving touchdowns last year, and he’ll be back in 2014. In addition, the Panthers averaged 7.4 yards per attempt on passes to Greg Olsen last year and 7.1 yards per attempt (the league average) on passes to all other players. Carolina signed Jerricho Cotchery, Jason Avant, Tiquan Underwood, and Joe Webb, should draft a receiver or two in May, and has a potential sleeper in Marvin McNutt. I think they’ll be just fine, mostly because that’s all the passing game was last year.

Since it’s still a bit early to figure out exactly how the Panthers passing game will look in 2014, I thought we could use some time this weekend to review some history. Which teams have experienced the most turnover among their targets? And how do we even measure such a thing? [continue reading…]

{ 2 comments }

Peyton Manning’s time in Indianapolis was peppered with record-breaking moments that have been very well-publicized. But a relatively unknown record occurred during the nascent days of the Manning Era. In 1999, Edgerrin James rushed for 1,553 yards, an impressive accomplishment in any era. But here’s what’s really crazy: Manning was second in the team in rushing yards with 73! Keith Elias was the only other running back to record a carry, and he finished with 28 yards (Marvin Harrison and Terrence Wilkins added six total rushing yards). This means James recorded 93.6% of all Indianapolis rushing yards that season, still an NFL record, and one that is in no danger of being broken in the near future.

Second on the list of “largest percentage of the rushing pie” is … Edgerrin James for the Colts the following season. In 2000, he was responsible for 91.9% of all Indianpolis rushing yards. Only three other players have ever gained 90% of all team rushing yards: Emmitt Smith, Barry Sanders, and … Travis Henry. The table below shows the top 100 seasons as far as percentage of team rushing yards: [continue reading…]

{ 16 comments }

By now, you know about guest blogger Andrew Healy, an economics professor at Loyola Marymount University and author of today’s post. There’s now a tag at the site where you can find all of his great work. He’s back with a cap to his excellent series about playoff performance, and today’s post will not disappoint:


The Purple People Eaters never won a Super Bowl

The Purple People Eaters never won a Super Bowl.

We know the teams that have experienced consistent heartbreak at the altar. But is it the Vikings, Eagles, or Bills that are the most unlikely to have never won a Super Bowl? On the flip side, we know the teams that stacked championships on top of championships. But is it the Packers, Steelers, or 49ers that have made the most of their chances?

For the latter question, it turns out that it’s option D, none of the above.  One mystery team has won four championships despite having had a pretty decent chance of never winning a single Lombardi.  The most unlikely team never to win a Super Bowl turns out to be a team that lost “only” two Super Bowls, but that has led the NFL in DVOA four times since 1979.

To figure this stuff out, I’ve utilized DVOA ratings and estimated DVOA ratings to rerun the NFL playoffs. In the simulations, the slate is wiped clean, which means there’s no reason The Fumble or The Helmet Catch or The Immaculate Reception have to happen this time around.

In last week’s post, I went decade by decade to look at the best teams, and also those that most let opportunity slip through their fingers. Today, I bring it all together. I compare what might have been with what actually was for the NFL from 1950 to 2013. I’ll also hand out awards for the teams that were the most unlikely winners and the most unlikely losers of all time. [continue reading…]

{ 9 comments }

Running backs getting shorter and heavier

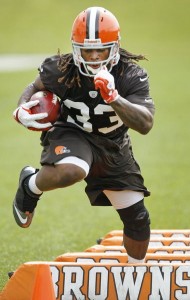
Short and stout is what NFL teams look for in a running back

Short and stout is the ideal look.

In December, I noted that fewer rushing yards are coming from first round picks. That’s a trend that seems very likely to continue in 2014, and perhaps for the foreseeable future. As it turns out, running backs are also getting shorter and heavier.

LeSean McCoy, Alfred Morris, Frank Gore, Knowshon Moreno, Zac Stacy, DeAngelo Williams, Maurice Jones-Drew, Ray Rice, Giovani Bernard, Trent Richardson, Doug Martin, Danny Woodhead, and Mark Ingram are all 5’10 or shorter. As you can probably infer from the sheer quantity of the group, those players aren’t significant outliers: the “average” running back, weighted by rushing yards last season, was only five feet and 11.1 inches tall. That means backs like Jamaal Charles (6’1), Matt Forte (6’1), and Adrian Peterson are more outliers than the 5’10 backs.

This is a weighted average, so McCoy (who had about 3% of all rushing yards from running backs last year) counts three times as much as, say, Donald Brown when calculating the 2013 (weighted) average running back height. Regular readers will recognize that this is the same methodology I used when calculating the average (weighted) average of each team’s receivers last season. The graph below shows the average weighted height of all running backs since 1950: [continue reading…]

{ 7 comments }

Ranking the Almost Dynasties, Part II

Andrew Healy is back with a sequel to his popular post. As always, we thank him for his generous contributions. Andrew Healy is an economics professor at Loyola Marymount University. He is a big fan of the New England Patriots and Joe Benigno.


A couple of weeks ago, I went decade-by-decade since the 1970 AFL-NFL merger to identify the teams that were the best of their eras and the teams that nearly became the teams we remember most instead. In those rankings, I used Pro Football Reference’s Simple Rating System to estimate team strength. Today, I use Football Outsiders’ DVOA ratings and go back an additional twenty years. Using DVOA produces some pretty notable differences that were bigger than I would have guessed.

What are some of those changes?

  • The Steelers have been supplanted as the true team of the ‘70s.
  • The best team to win no titles changes for three of the decades.
  • The ‘70s Vikings get replaced by a more recent what-might-have-been team as the best to win nothing in the Super Bowl era.

Before we get to that, I cover the 1950s and 1960s, identifying the true teams of those decades and the what-might-have-been teams. In a follow-up post, I’ll bring it all together and identify the franchises that have maximized their championship potential the most, and those that have left the most money on the table. [continue reading…]

{ 17 comments }

Head Coach Retention Rates

In the footnotes (always read the footnotes!) to one of Neil’s posts at 538, he included a fun chart displaying the likelihood that a baseball manager would be retained by his team X seasons from now. That made me wonder: what is the NFL head coach retention rate? And, as is often assumed by the football commentariat, are coaching seats hotter than ever in this “win now” era?

Just nine teams will have the same coach in 2014 as they did entering the 2009 season. Those nine men are Mike Smith, Marvin Lewis, Mike McCarthy, Sean Payton, Bill Belichick, Tom Coughlin, Rex Ryan, Mike Tomlin, and John Harbaugh.  A 28% five-year retention rate sounds pretty low, but is it? Does a 28% rate back up the claim that trigger fingers are itchier than ever, and owners are impatient and irrational Donald Trumps?

No. Let’s flash back to the start of the 1993 season. Don Shula was in Miami, of course, while Marv Levy had just taken the Bills to three straight Super Bowls. Levy had been the head coach in Buffalo since the middle of the 1986 season, which is the same year Jim Mora began as head coach in New Orleans. Mora was still with the Saints in ’93, and… well, that was it. Those three coaches were the only ones who had been with their teams for five straight years.

The same fact was true six years later: at the start of the 1999 season, only Dennis Green (Minnesota), Bill Cowher (Pittsburgh), and … Norv Turner (?!?) had been with their teams for five years. The graph below shows the percentage of head coaches who were still with the same team five years later for the period 1970 to 2009:

[continue reading…]

{ 5 comments }

A Passing League

In some ways, the premise of this post is geeky even for this site. And that’s saying something. There is a debate over the proper way to measure league average. For example, when we say the average completion percentage in the NFL is 61.2%, this is generally assumed to reflect the fact that in 2013, there were 18,136 passes thrown in the NFL, and 11,102 of them were completed.

An alternative method of measuring completion percentage in the NFL is take the average completion percentage of each of the 32 teams. That number won’t be very different, but it won’t be identical, either. The difference, of course, is that this method places the same weight on each team’s passing attack when determining the league average. The former, more common method, means that the Cleveland Browns make up 3.755% of all NFL pass attempts and the San Francisco 49ers are responsible for only 2.299% of the league-average passing numbers. The latter method puts all teams at 3.125% of NFL average.

Wow, Chase, is this really a football blog? Two paragraphs on calculating the average in a data set? Believe it or not, that background presents an interesting way to look at how the NFL has become more of a passing league.

For example, let’s look at the 1972 season. Miami led the NFL in points scored and in rushing attempts, while ranking 24th out of 26 teams in pass attempts. Does this mean the Dolphins weren’t a good passing team? Of course not; in fact, Miami had the highest Adjusted Net Yards per Attempt average of any team that season! That year,only two teams threw over 400 passes: New England and New Orleans. And both teams were below-average in ANY/A, with the Patriots ranking in the bottom three.

In 1972, the average pass in the NFL gained 4.28 Adjusted Net Yards.  But an average of each team’s ANY/A average was 4.34, because good passing teams like Miami and Washington passed less frequently than bad passing teams like New England and New Orleans.  The league-wide average was only 98.5% of the “average of the averages” average; whenever that number is less than 100%, we can conclude that the better passing teams are passing less frequently.

Fast forward 39 years. In 2011, three teams topped the 600-attempt mark: Detroit, New Orleans, and New England. Tom Brady’s Patriots and Drew Brees’ Saints ranked in the top three in ANY/A (and the Lions in the top 7), while Aaron Rodgers’ top-ranked Packers in ANY/A still finished above average in pass attempts. The Tim Tebow Broncos were last in pass attempts, and in the bottom ten in ANY/A. The Jaguars, who finished last in ANY/A by a large margin, were in the bottom five in pass attempts, too, as Maurice Jones-Drew led the league in rushing. In 2011, the league-wide average ANY/A was 5.90, while the “average of the 32 teams” ANY/A was 5.85; that’s because the best passing teams were throwing more frequently than the worst passing teams (the ratio here was 100.8%). [continue reading…]

{ 15 comments }

Scoring Distribution Since 1940

We all know that scoring is on the rise. The 2013 season was the highest scoring season in NFL history, just narrowly edging out the … 1948, 1950, and 2012 seasons. Scoring soared in the aftermath of World War II, but quickly dropped off in the middle of the 1950s. Scoring fell to its nadir in 1977, prompting the 1978 rules changes regarding pass blocking and pass coverage. After another lull in the early nineties, scoring has steadily increased over the last twenty years. Take a look at the average points per game for professional teams (including the AAFC and AFL) since 1940:

nfl ppg [continue reading…]

{ 15 comments }

The Best Kickoff Returners in NFL History

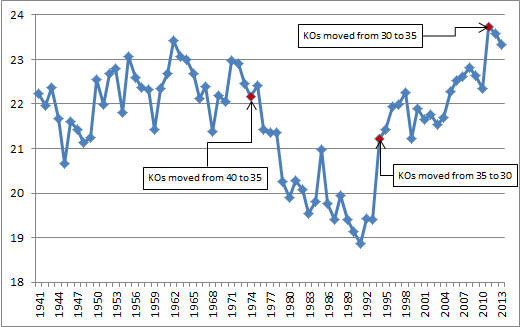
Two weeks ago, I looked at the best punt returners in NFL history; today, a look at the top kickoff returners. Again, we begin with a graph of the league average yards per kickoff return from 1941 through 2013. The variation here has been relatively minor, falling in a 5-yard window from 18.9 yards per return to 23.7.

kickoffs [continue reading…]

{ 17 comments }

Ranking The Almost Dynasties

A couple of weeks ago, Andrew Healy contributed a guest post titled, “One Play Away.” He’s back at it today, and we thank him for another generous contribution. Andrew Healy is an economics professor at Loyola Marymount University. He is a big fan of the New England Patriots and Joe Benigno.


What teams do we remember the most? Going back to the merger, the 1970s Steelers, the 1980s 49ers, the 1990s Cowboys, and the 2000s Patriots seem to stand above the rest. Each of these teams earned that place in our collective memory by winning the most Super Bowls in the decade.

How different could it have been? In other words, were the dynasties that happened by far the most likely ones? Or were there others that were equally, or even more likely? Think of teams that have suffered unusually cruel sequences of defeats (cue nodding Vikings, Bills, and Browns fans). We all know that those teams could have won Super Bowls. But maybe the more interesting question is whether those teams realistically could have won multiple Super Bowls, or even have become the dominant team of the era.

Today, I estimate the chances that different teams had of becoming the Team of the Decade (the TOD) for the ’70s, ’80, ’90s, and ’00s. Some of the results are surprising. One of the teams that became the TOD was actually much less likely than another to dominate that decade. Only two of the four teams truly stand out as being clearly the single most-likely team to be the TOD.

Even more interesting are the teams that might have been dynasties instead of the ones we’ve come to know. In most cases, these teams won at least one Super Bowl. In one case, though, a team that became famous for losing easily could have been not just a one-time winner, but a team that became a dynasty and dominated the decade.

To come up with the estimates of a team’s chances of winning Super Bowl, I simulated the playoffs 50,000 times. I used the actual playoff brackets and then created win probabilities for each game based on team strength. In tables that follow below, I’ll describe the probabilities that teams won multiple titles in a decade. I’ll also pick a True Team of the Decade (most expected Super Bowl wins), a What-Might-Have-Been-Dynasty that Won Nothing, a Team that Wasn’t as Good as We Remember, and a A Bottom-Feeder Team(s) for each decade.

First, a brief description of how I performed the simulations before getting to the rankings:

  • The playoffs were run under the rules in a given year: All rules relating to seeding, home field, and number of teams were used. If there was a rule in place preventing matchups between divisional opponents in a given round, I also applied that rule. To some extent, the fewer teams in earlier years helped make dynasties more likely in those decades.
  • Pro Football Reference’s Simple Rating System was used to measure team strength: I used PFR’s for all years to be consistent. It’s worth noting that their ratings and DVOA usually match up closely. Another possibility is to try to simulate DVOA ratings, but it seems simpler to just use SRS throughout. In some cases, there are some differences, such as for the 1998 Broncos and 1999 Titans.
  • I used the beginning of the NFL season to define the decades: So 1970-79 means Super Bowls V-XIV. An interesting thought experiment is to consider Super Bowl time instead of calendar decades. Then the Raiders would have been the team of Super Bowls XI-XX. Anyway, I’ll stick with the convention. It’s worth noting that my results suggest the Raiders were not as good as we might remember.

1970s

The table below shows each franchise’s probability of having won 0, 1, 2, 3, 4, 5, or 6 Super Bowls during the decade according to the methodology described above. The final column shows the expected number of Super Bowl wins for the decade.

Team0123456E(Wins)
PIT0.1450.330.3120.1560.0490.0080.0011.659
DAL0.2090.3770.2750.1110.0240.00401.377
MIN0.2360.4070.2610.0810.0130.00101.232
MIA0.3430.4220.1910.0390.004000.941
RAM0.390.3990.1690.0370.005000.87
OAK0.3950.4020.1650.0340.005000.853
BAL0.5610.3550.0760.0080000.532
WAS0.6010.3330.0610.0050000.469
SD0.6410.359000000.359
DEN0.6540.320.0250.0010000.373
SF0.7430.2350.0220.0010000.281
DET0.7620.238000000.238
NE0.8320.1610.00700000.175
CIN0.8820.1140.00400000.123
KC0.8920.108000000.108
STL0.90.0970.00300000.103
GB0.9050.095000000.095
PHI0.9240.0750.00100000.077
CLE0.9650.035000000.035
HOU0.9720.028000000.028
TB0.9740.026000000.026
BUF0.9750.025000000.025
CHI0.9820.018000000.018
ATL0.9980.002000000.002
NYG10000000
NYJ10000000
SEA10000000

The True Team of the Decade: Pittsburgh Steelers
The Steelers had only a 14.5% chance of winning no Super Bowls in the ’70s and a 4.9% chance of winning the four that they did. The expected value of SB wins for Pittsburgh was 1.67, the highest value for any team in any decade.

The What-Might-Have-Been-Dynasty that Won Nothing: Minnesota Vikings
The Vikings are not too far away from the Steelers and Cowboys. There was only a 23.6% chance the Vikings would have won nothing in the ’70s. And they certainly could have won multiple championships. There was over a 35% chance the Vikings would have won at least two titles and a 9.6% chance they would have won at least three. Of all the teams that won nothing, the 1970s Vikings are the best candidate for the team that could have been the TOD.

The What-Might-Have-Been Dynasty that Won Nothing, Part 2: Los Angeles Rams

A little bit behind the Vikings are the Rams. Los Angeles had only a 39% chance of winning no Super Bowls in the ’70s and a 20.3% chance of winning multiple titles.

The Team that Wasn’t as Good as We Remember: Oakland Raiders
When I starting working with the data, I expected the Raiders to challenge for the TOD. Five losses in the AFC championship to go with the one title. Seven playoff appearances. Despite all that, the Raiders only had the sixth-most expected titles in the decade. In fact, they didn’t really underperform at all in terms of titles. They had a 39.5% chance of winning none at all. The Raiders’ SRS ratings explain this. Oakland was never really great, only passing +10.0 in a year (1977) where they finished second in the division.

Bottom-Feeder Teams: New York Giants, New York Jets
Only two teams played the entire decade and missed the playoffs every single year. They happened to be the two teams that played in New York. The chance that two teams would miss the playoffs every year and New York would happen to miss playoff football entirely: about 0.2%.

1980s

Team0123456E(Wins)
SF0.1460.3370.310.1560.0420.0070.0011.637
CHI0.2890.4810.1980.030.002000.975
MIA0.4160.3970.1540.0290.003000.805
WAS0.3920.450.1410.0170.001000.785
DEN0.4730.4020.1120.0120000.664
CLE0.5370.3710.0830.0090000.565
PHI0.5850.3550.0560.0030000.478
DAL0.6010.3290.0650.0050000.475
CIN0.6080.340.0510.0010000.446
NYG0.6250.3320.0420.0010000.419
OAK/LA0.6430.3020.050.0050000.417
SD0.70.2710.0280.0010000.329
BUF0.7070.2620.030.0010000.324
MIN0.7560.2250.0180.0010000.263
NYJ0.7720.210.01800000.247
ATL0.7840.2160.00100000.217
RAM0.8370.1520.0100000.174
NE0.8690.1290.00200000.134
NO0.8720.128000000.128
SEA0.9010.0970.00300000.102
GB0.9020.098000000.098
PIT0.9090.0880.00300000.094
TB0.930.07000000.071
HOU0.940.0590.00200000.062
BAL/IND0.9570.043000000.043
DET0.9720.027000000.028
KC0.9830.017000000.017
STL/PHX0.9970.003000000.003

The True Team of the Decade: San Francisco 49ers
Unlike the 1970s, the ’80s weren’t close. The Niners were similar to the ’70s Steelers with an expectation of 1.64 Super Bowl wins in the decade. The ’80s 49ers had about a 4.2% chance of winning the four Super Bowls they did and 51.7% chance of winning at least two. And, while not shown in the table above, it’s exciting to note that the Niners had a 0.004% chance of winning seven Super Bowls in the 1980s.

The What-Might-Have-Been-Dynasty that Won Nothing: Miami Dolphins
I was really surprised by this one. The Dolphins come in third in the 1980s in expected SB wins with 0.81. Based on their consistency in the first half of the decade, the Dolphins had an 18.6% chance of winning multiple Super Bowls in the 1980s. That’s substantially higher than the 12.4% chance for their nearest competitor: the much better-remembered Denver Broncos who were annihilated in three Super Bowls.

The Team that Wasn’t as Good as We Remember: Oakland/LA Raiders
Despite never being close to dominant, the Raiders won two Super Bowls in the 1980s. According to the number of SB wins we would have expected them to have, the Raiders actually rank 11th, behind six teams that won none in the decade. They had about a 5.5% chance of winning multiple titles in the decade.

A Bottom-Feeder Team: Houston Oilers
For teams that played every season since the merger, the Oilers had the least hope of winning a title over the 1970s and 1980s combined. That’s a little surprising given that they had at least one memorable moment in the playoffs during that stretch, unlike some of the teams ahead of them.

1990s

Team0123456E(Wins)
SF0.1510.3310.3080.1560.0460.0070.0011.639
DAL0.3120.4160.2160.0510.005001.023
GB0.3630.4870.1380.0110000.799
WAS0.3950.5630.0410.0010000.647
BUF0.5190.3710.0960.0140.001000.607
KC0.5130.3830.0950.0090000.601
DEN0.5520.3510.0860.010000.557
MIN0.550.3990.0490.0020000.504
PIT0.5930.3280.0720.0070000.495
RAM/STL0.5780.422000000.422
HOU/TEN0.6580.3010.0390.0020000.386
NYG0.7640.2260.0100000.247
JAC0.8020.1920.00600000.204
MIA0.8130.1730.0130.0010000.202
NYJ0.8010.199000000.2
LA/OAK0.830.1670.00300000.173
NE0.8420.1510.00700000.166
ATL0.850.1490.00100000.151
SD0.8660.1290.00500000.139
IND0.8660.1330.00100000.135
NO0.8710.1250.00300000.132
DET0.8860.110.00400000.118
CAR0.8990.101000000.101
PHI0.9050.0920.00300000.097
TB0.9160.0830.00100000.086
CLE/BAL0.9190.081000000.081
CHI0.9560.043000000.044
SEA0.9590.041000000.041
CIN0.9930.007000000.007
PHX/ARI10000000

The True Team of the Decade: San Francisco 49ers
This one almost leaps off the page. Not only were the Niners on top in the 1990s in terms of expected SB wins, they were way on top. Given the Cowboys’ relatively short run, it’s not surprising that they would do worse here, but they’re closer to the 10th place Rams on this list than they are to the 49ers. Even though they only won one in the decade, the Niners had the same number (1.64) of expected titles in the ’90s as they did in the ’80s, and a 51.7% chance of multiple titles.

The What-Might-Have-Been-Dynasty that Won Nothing: Buffalo Bills
The Bills actually do worse on this list than I would have expected. They were about even money to win the zero titles that they did in the ’90s. They had an 11.0% chance of winning multiple titles, making them the top-ranked no-title team of the ’90s, but ranking them well behind the ’70s Vikings, the ’70s Rams, and the ’80s Dolphins.

The What-Might-Have-Been-Dynasty that Won Nothing, Part 2: Kansas City Chiefs
On the field, the ’90s Chiefs only went to one AFC Championship game and no Super Bowls. Nevertheless, they’re about even with the Bills in terms of the Super Bowls they could have won. They had a 10.4% chance of winning multiple titles in the ’90s.

The Team that Wasn’t as Good as We Remember: Pittsburgh Steelers
I’m not sure there’s a great candidate in this category, so I was tempted to just pick the Raiders again to keep the pattern. You could go with Broncos here, but the 1998 Broncos are one case where there’s a clear gap between SRS and DVOA, which gives them more credit. The ’90s Steelers had four playoff byes in a run of six straight playoff appearances. Still, they had a 59.3% chance of winning no Super Bowls and only a 7.9% chance of winning multiple titles.

A Bottom-Feeder Team: Phoenix/Arizona Cardinals
The worst team in two consecutive decades. Over twenty years, the Cardinals had 0.003 expected titles. That’s only 0.003 more expected titles than the Houston Texans and they weren’t even in the league yet.

2000s

Team0123456E(Wins)
NE0.170.4160.2990.0980.0160.00101.38
IND0.4150.4020.1480.0310.004000.807
PHI0.4280.3990.1430.0270.003000.78
PIT0.4630.3990.1220.0160000.693
OAK0.4690.4320.0970.0020000.633
STL0.4940.4320.0720.0020000.584
TEN0.5780.3470.070.0050000.501
SD0.5890.3470.060.0040000.48
BAL0.6220.3160.0570.0050000.445
CHI0.6390.3190.0410.0010000.404
NYG0.6470.3070.0440.0030000.403
NO0.6410.3260.0330.0010000.393
GB0.6990.260.0380.0030000.344
TB0.710.2650.0240.0010000.316
DEN0.7160.2680.0160.0010000.3
SEA0.740.250.0100000.27
DAL0.7870.1990.01400000.227
MIN0.7880.1970.01400000.226
KC0.8010.1980.00100000.199
CAR0.8560.140.00400000.149
NYJ0.8690.1240.00600000.138
ATL0.9140.0830.00300000.088
MIA0.920.0790.00100000.082
WAS0.9520.048000000.049
SF0.9630.037000000.038
JAC0.9710.029000000.029
CIN0.9750.025000000.025
CLE0.9910.009000000.009
ARI0.9910.009000000.009
BUF10000000
DET10000000
HOU10000000

The True Team of the Decade: New England Patriots
Less dominant than the other True TODs, the Patriots of the aughts still have a healthy gap over their closest rival, the Colts. There was only a 17% chance the Patriots would have gotten shut out in the ’00s. There was a 41.7% chance that the Pats would win multiple titles in the decade, more than double the chance of any other team.

The What-Might-Have-Been-Dynasty that Won Nothing: Philadelphia Eagles
The Eagles rank third in expected titles in the ’00s with 0.78, just a hair behind the Colts for second. They also look similar to the 1970s Rams and 1980s Dolphins in terms of multiple-title potential. They had about a 17.4% chance of winning multiple titles in the aughts.

The Team that Wasn’t as Good as We Remember: Tampa Bay Buccaneers
Hopefully, it’s not too hard to remember a decade that ended with President Obama in the White House, but the Bucs come in lower here than I might have guessed. They made the playoffs five times, but still are only 14th in expected SB wins. They actually had a 71% chance of winning no titles in the decade. Even in their best year, 2002, where they ranked #2 in SRS and #1 in DVOA, they were far from dominant and so had only about a 21% chance of winning the title.

Bottom-Feeder Teams: Buffalo Bills, Detroit Lions
Neither team made the playoffs in the decade, a more impressive accomplishment than the ’70s Giants and Jets in an era of expanded playoffs. Both cities also suffered through deindustrialization and so seemed to deserve better football as a compensating differential.

Closing Thoughts

I was excited to check this out because I wanted to compare teams like the ’90s Bills and the ’70s Rams. That comparison makes it pretty clear that the ’70s Vikings are hands-down the clearest What-Might-Have-Been-Dynasty that Won Nothing. This is all post-merger, so arguably the best Vikings team of that era (the ’69 edition) doesn’t even count in the calculation. If you count the 1969 Vikings, there was only about a 1-in-6 chance that those Vikings would end up with no Super Bowls.

Maybe the most remarkable regularity over the years is how the Cardinals have been so bad for so long. Even though Arizona came close in 2008, the Cardinals had only an 11.2% chance of winning any of the last 44 Super Bowls. In fact, they were lucky just to make the one Super Bowl that they did (in more ways than one).

Finally, a couple of thoughts about this decade. While we’re only four years in, this decade could wind up resembling the 1990s. The Patriots right now are playing the role of the ’90s Niners, while the Seahawks may be the best candidate to be the Cowboys. So far, the Patriots have been (perhaps surprisingly) dominant. There’s only about a 27% chance that New England would have no titles in the 2010s and there was even a 28.5% chance that the Patriots would have already won multiple titles; that likelihood is more than four times more as any other team. Despite having none on the field through four seasons, the ’10s Patriots are on pace through four years to have the most expected SB wins for any decade. They already have 1.07 expected wins, more than double their nearest competitor.

{ 21 comments }

How will DeSean Jackson age?

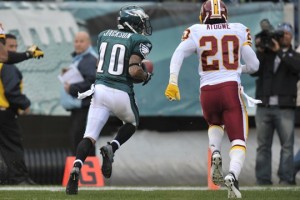
DeSean Jackson crosses the goal line before discarding the ball

DeSean Jackson crosses the goal line before discarding the ball.

If you believe the rumors, the Eagles are desperately trying to trade wide receiver DeSean Jackson; absent an eligible suitor, and Philadelphia may even cut the three-time Pro Bowler. This is a pretty weird situation; what’s even weirder is how few tangible reasons have been given as to why the Eagles desire to remove him from the roster.

Jackson has a cap hit of $12.75M this year and $12M in each of the next two seasons; that’s obviously a significant amount, and I don’t doubt that Philadelphia feels a bit of buyer’s remorse on that contract. But reading the tea leaves indicates that a high salary cap figure is only part of the issue; unfortunately, without knowing the other reasons, it’s impossible to suggest whether a team would be wise to trade for him. This might be a Randy Moss-to-New England situation, or it could just as easily be a Santonio Holmes-to-the-Jets disaster. [continue reading…]

{ 10 comments }

Wazzup????

Wazzup????

Some quarterbacks and wide receivers just go together. Peyton Manning and Marvin Harrison. Dan Marino and Mark Clayton and Mark Duper. Joe Namath and Don Maynard. John Hadl and Lance Alworth. But quarterbacks play with lots of receivers, and receivers generally play with several quarterbacks. We don’t remember most combinations, but that doesn’t mean they were all unproductive. So I thought it might be interesting to look at every wide receiver since 1950, find his best single season in receiving yards, and record who was his team’s primary quarterback that season.

Jerry Rice’s best year came with Steve Young, not Joe Montana. Randy Moss set the touchdown record with Tom Brady, but his best year in receiving yards was with Daunte Culpepper. Lynn Swann’s best year was with Terry Bradshaw, but John Stallworth’s top season in receiving yards came with Mark Malone. James Lofton’s best season was with Lynn Dickey, Isaac Bruce’s best year was with Chris Miller, Torry Holt’s top season came with Marc Bulger, and Tim Brown’s top year was with Jeff George.

This is little more than random trivia, but this site does not have aspirations for March content higher than random trivia. In unsurprising news, 25 different players had their best season in receiving yards (minimum 300 receiving yards) while playing with Brett Favre. That includes a host of Packers, but also a couple of Jets and Vikings, too (including one future Hall of Famer).

After Favre, Marino is next with 22 players, and he’s followed by Manning and Fran Tarkenton (20). From that group, I suspect that Tarkenton might surprise some folks. That is, unless they realized that he was the career leader in passing yards when he retired and played for five years with the Giants and thirteen with Minnesota.

The table below shows every quarterback who was responsible for the peak receiving yards season of at least five different receivers (subject to the 300 yard minimum threshold). For each quarterback, I’ve also listed all of his receivers. [continue reading…]

{ 10 comments }

The Best Punt Returners in NFL History

Six years ago, I wrote a series of posts looking at the best returners in NFL history. Today, I want to update that list by examining the best punt returners in NFL history. As with most statistics, yards per punt return has fluctuated throughout most of NFL history. The graph below shows the average in this metric from 1941 through 2013:

y pr [continue reading…]

{ 7 comments }

Jones catches another bomb

Jones catches another bomb.

In November, I noted that Chris Johnson was the career leader in average length of rushing touchdown. Since then, he’s actually dropped to number two, as his six rushing touchdowns covered “only” 84 yards in November and December. But what about the career leader in average length of receiving touchdown?

That title belongs to former Giants wide receiver Homer Jones.  A star in the late ’60s, 19 of Jones’ 36 career touchdowns went for 50 or more yards. The table below shows all 413 players to record at least 35 receiving touchdowns (including the postseason) from 1940 to 2013.  While Jones leads in average touchdown length, I think it makes more sense to sort the list by median touchdown length, although that doesn’t matter much for Jones.  For each player listed, I’ve included both their average and median touchdown length, the years they played, and a best guess at their primary position.  The table by default shows 50 entries, but you can change that; in addition, the table is fully sortable and searchable. [continue reading…]

{ 8 comments }

One Play Away

Football Perspective accepts guest posts, and Andrew Healy submitted the following post. And it’s outstanding. Andrew Healy is an economics professor at Loyola Marymount University. He is a big fan of the New England Patriots and Joe Benigno.


The Browns were one play away from the Super Bowl

How much did this player lower Cleveland's Super Bowl odds?

The Catch. The Immaculate Reception. The Fumble. We remember all these plays, but which mattered the most? More specifically, what plays in NFL history had the biggest impact on who won the Super Bowl?

The answer to this question is kind of surprising. For example, two of those famous plays are in the top 20, but the other wasn’t even the most important play in its own game. Going all the way back to Lombardi’s Packers, the memorable and important plays overlap imperfectly.

Here, I try to identify the twenty plays that shifted the probability of the eventual Super Bowl winner the most. According to this idea, a simple win probability graph at Pro-Football-Reference.com identifies a not-surprising choice as the most influential play in NFL History: Wide Right. What is surprising is that they give Buffalo a 99% chance of winning after Jim Kelly spiked the ball to set up Scott Norwood’s kick. Obviously, that’s way off. [1]I think it happens because their model basically gives you credit for your expected points on the drive, which is enough to win since Buffalo was down by a point.

A better estimate would say him missing the kick lowered the Bills chances of winning from about 45% to about 0%. Norwood was about 60% for his career from 40-49 yards out, and 2 for 10 from over 50. Moreover, he was 1 for 5 on grass from 40-49 before that kick. But the conditions in Tampa that night were close to ideal for kicking. It’s hard to put an exact number on things, but around 45% on that 47-yard kick seems about right.

So that 45 percentage point swing in a team’s chances of being the champ is what I’m going to call our SBD, or Super Bowl Delta, value. I’m going to identify the twenty plays with the biggest SBD values, the ones that swung the needle the most.

Here are the ground rules for making the cut. [continue reading…]

References

References
1 I think it happens because their model basically gives you credit for your expected points on the drive, which is enough to win since Buffalo was down by a point.
{ 20 comments }

The prevailing view is that Vegas is an example of an efficient market. If there were obvious trends that oddsmakers ignored, it would be easy for people to make money gambling on football, and we know that’s not the case. But I thought it would be interesting to investigate some claims I’ve heard over the years, so I’m introducing the Efficient Vegas tag to Football Perspective.

One theory I’ve heard is that when good teams play bad teams, the smart money is to bet on the bad teams. That’s not because Vegas doesn’t know what it was doing, but that oddsmakers know that fans like to bet on good teams when they play bad ones. But is this true? Here is how I decided to test that question.

From 1990 to 2013, there were 792 games that met the following four criteria: [continue reading…]

{ 26 comments }

Terry Bradshaw finished his career with 212 touchdowns, 210 interceptions and a 70.9 passer rating. Kurt Warner threw 208 touchdowns against only 128 interceptions, and his 93.7 passer rating ranks 8th in NFL history and 2nd among retired players. But Bradshaw played from 1970 to 1982, while Warner played from 1998 to 2009. As a result, comparing their raw statistics holds very little meaning. Comparing across eras is very challenging, but not impossible. And in this case, once you place the numbers in the proper context, Bradshaw’s numbers were arguably more impressive than Warner’s numbers.

Let’s start with Bradshaw and begin by looking at his Relative ANY/A for each year of his career. For new readers, ANY/A stands for Adjusted Net Yards per Attempt, defined as

(Gross Pass Yards + 20 * PTDs – 45 * INTs – Sack Yds)/(Attempts + Sacks)

Relative ANY/A simply compares a quarterback’s ANY/A average to league average, a necessary element when comparing quarterbacks across eras. In the graph below, the size of the bubble corresponds to how many attempts Bradshaw had in each season, while the Y-Axis shows Bradshaw’s Relative ANY/A (by definition, 0 is equal to league average).  The graph shows a clear story: for the first five years of his career, Bradshaw was a below-average quarterback, but over the rest of his career, he was one of the best in football. His best year came in 1978 when Bradshaw finished with a RANY/A of +2.0, which was the third best mark in football (only a hair behind Roger Staubach and Dan Fouts). Those stats, combined with a 14-2 record, led to Bradshaw being named the AP’s MVP that season. [continue reading…]

{ 41 comments }

The 1956 NFL Season: The Forward Pass on Life Support

The history of offense in the NFL is not a linear one. The early ’70s was the dead-ball era of the passing game, and it’s largely true that pass frequency and efficiency have steadily increased since then. But NFL teams passed more frequently in the ’60s than they did in the ’70s, and passing ratios wildly fluctuated in the ’50s. The picture below shows the league-average pass ratio for the NFL [1]I have excluded the AFL statistics from this data set. for each year from 1950 to 1980. Pass ratio is simply defined as (Pass Attempts + Sacks) / (Pass Attempts + Sacks + Rush Attempts).

p-r rat2

As you can see, 1956 represents a huge outlier over the 30-year period. Pass ratios dropped significantly in 1956, increased slightly in 1957, and then spiked back up, seemingly without reason. The other main valley, of course, was in the mid-1970s. The pass-to-run ratio dropped every year after the merger before plummeting to 43% in ’73. It spiked back up temporarily in ’74 and ’75 before dropping again, bottoming out at 42% in ’77 and necessitating the 1978 rules changes.

The next graph shows the league-average ANY/A for each season (in green) and the Adjusted Yards per Carry average (Rushing Yards + 20*Rushing TDs) / (Rush Attempts) in red. As you can see, passing was slightly more effective than rushing in the mid-’60s, which presumably caused a shift towards more passing. As pass efficiency decreased, so did pass attempts. [continue reading…]

References

References
1 I have excluded the AFL statistics from this data set.
{ 14 comments }

Estimated DVOA Ratings From 1950 to 2013

For over a decade, Football Outsiders has been publishing its DVOA grades. Last week, Andreas Shepard, a loyal reader of both FO and this site, came up with estimated DVOA ratings going back to 1950. You can read the fine print on how he derived the formula in the Methodology section at the end of this post. Andreas did an excellent job looking at some of the best and worst teams in many different DVOA categories, so you should give his article a read. But to me, at least, the real value of team ratings for over 1600 teams in 8 different categories is as a reference piece. And since the tables I create here are both sortable and easily searchable, I’ve worked with Andreas to present the team ratings in a way to make life easy for the reader. Consider these like an encyclopedia for team ratings, available for you to find the team you’re interested in whenever you like.

Andreas created estimated DVOA ratings for each year from 1950 to 2013 (remember, Football Outsiders has posted actual DVOA ratings published for each year from 1989 to 2013, but I am providing the estimates for each year.) The table below shows all 1638 teams from 1950 to 2013; here’s how to read the table below, which is sorted from best to worst in Total DVOA. The Packers (you can click the link to see Green Bay’s PFR page that year) in 1962, playing in the NFL, rank as the top team in estimated DVOA. That year, Green Bay went 13-1 with a winning percentage of 0.929 and a points differential of 19.1 points per game.

The Packers had an Offensive Pass DVOA grade of 18.9% and an Offensive Run DVOA grade of 23.0%; all DVOA ratings are centered around 0%, so this shows how the Packers were well above average in both offensive measures. For defensive ratings, negative grades are better, and the Packers have an incredible -33.2% estimated Defensive Pass DVOA grade, along with a -8.6% estimated Defensive Run DVOA grade. The Packers’ Total Offensive DVOA grade was 21.4%, the Total Defensive DVOA grade was -20.7%, and the Special Teams DVOA grade was 5.8%. Finally, the Packers have a total estimated DVOA of 47.9%, the best since 1950. If you type “gnb” into the table below, you will see all Packers teams. You can type in any team’s code to see just their teams, or sort the table by any of the categories available.

[continue reading…]

{ 10 comments }

Should Division Winners Get Home Field?

In the 2013 playoffs, the 12-4 San Francisco 49ers had to play a road game against the 8-7-1 Green Bay Packers. It’s hard to justify situations like this, especially when the NFC West was one of the best divisions in football history and the NFC North was below average. Division winners are automatically given a home game under the current NFL structure, but the NFL is reportedly open to modifying that rule. I thought this would be a good idea, with one caveat; after further investigation, I no longer even have a caveat.

Let’s start with an acknowledgment: there is no “traditional” NFL playoff format. The NFL has modified its playoff system more times than anybody other than Jason Lisk can remember. There are no automatic rules regarding home field: in 1934, West champion Chicago went 13-0 and had to play the East champion Giants in New York because the league alternated which division was the host each year, and even years were East years. Two years later, the 10-1-1 Packers had to play at 7-5 Boston for the same reason.

Even in more recent times, it was not unusual for the best team in the league to have to win a road playoff game. In the 1968 playoffs, the famed 13-1 Colts — thought to be one of the greatest teams in football history prior to Super Bowl III — had to win in Cleveland to win the NFL championship and earn the right to play in the Super Bowl. [1]After realignment in 1967, the West division was selected to host the title game in ’67 (the Ice Bowl) and ’69 (Vikings over Browns), while the East would get home field in ’68 and … Continue reading The 1972 Dolphins (14-0) had to play at Pittsburgh (10-4) in the AFC Championship Game, as that was the AFC Central’s year to have first priority.

Even a wildcard hosting a division winner is not unprecedented. 1982 was a very weird year because of the strike, but you’d be hard-pressed to find a weird result than this one: the NFC Central champion Packers (5-3-1) had to play at NFC East runner-up Dallas (6-3), while the NFC Central runner-up Vikings (5-4) got to host the NFC West champion Falcons (5-4). That’s because following the players’ strike, the league simply seeded teams 1-8 that year because of the abbreviated schedule. [continue reading…]

References

References
1 After realignment in 1967, the West division was selected to host the title game in ’67 (the Ice Bowl) and ’69 (Vikings over Browns), while the East would get home field in ’68 and … well, the East drew the short end of the stick when the AFL-NFL merger took effect in 1970.
{ 10 comments }

The Best Scoring Offenses Since 1932

Denver had one of the greatest offenses ever

Denver had one of the greatest offenses ever.

On Monday, I looked at the greatest defenses — measured simply by points allowed and adjusted for strength of schedule — in NFL history. Today, I want to look at which offenses were the greatest in regular season history, and see where the 2013 Broncos stack up.

As noted in the post on defenses, during Super Bowl week, Bill Barnwell’s article ranked Denver’s 2013 offense as the greatest scoring machine ever. He used the statistical measurement known as the Z-Score to show that Denver’s offense was 3.3 standard deviations above average, and no offense had ever been 3.3 standard deviations above average before.

Where does that 3.3 number come from? Denver averaged 37.9 points per game during the regular season. The league average was 23.4 points, which means that Denver’s offense was 14.5 PPG better than average. The standard deviation of points per game among the 32 NFL offenses in 2013 was 4.36 points; therefore, Denver gets a Z-score of 3.32, because the Broncos scored points at a rate that was 3.32 standard deviations better than the mean. [continue reading…]

{ 8 comments }

The Best Scoring Defenses In NFL History

Head of the LOB

Head of the LOB.

Congratulations to the Seattle Seahawks and their fans on winning Super Bowl XLVIII. With the win, Seattle has confirmed its status as one of the greatest defenses in NFL history. The Seahawks defense produced a game for the ages on Sunday: facing Peyton Manning, Demaryius Thomas, and one of the greatest offenses ever, Seattle’s defense outscored Denver’s offense, 9-8. Led by Malcolm Smith, Cliff Avril, Kam Chancellor, Earl Thomas and Richard Sherman, the Seahawks stamped their claim with the ’85 Bears, ’00 Ravens, and ’02 Bucs as one of the greatest defenses of the last 30 years.

But today, I want to look at which defenses were the best in regular season history, and see where Seattle stacks up. Bill Barnwell had an interesting post during Super Bowl week. He used the statistical measurement known as the Z-Score to show that Seattle was the tenth best defensive scoring team in NFL history. Don’t be too confused by the idea of a Z-score: in English, this just means that Seattle’s defense — and yes, I am going to conflate the concepts of defense and points allowed throughout this post — was 2.2 standard deviations above average in points allowed, one of just ten teams to ever produce such a result.

So how do we get there? Well, Seattle allowed 14.4 points per game during the regular season. The league average was 23.4 points, which means that Seattle’s defense was 9.0 PPG better than average. The standard deviation of points per game among the 32 NFL defenses in 2013 was 4.08 points per game; therefore, Seattle has a Z-score of 2.20, because the Seahawks allowed points at a rate that was 2.20 standard deviations better than the mean.

Today, I wanted to do the same analysis but adjust for strength of schedule, by deriving offensive and defensive SRS grades. Of course, Pro-Football-Reference has published offensive and defensive SRS grades for awhile, but I decided to crunch the numbers on my own and see if they matched up with what Neil and Mike did (they did). For the uninitiated, SRS stands for Simple Rating System, which is simple to understand but a bit complicated to derive. The SRS is simply margin of victory (or, in the case of offenses and defenses, margin of production above league average) adjusted for strength of schedule. The key is using an iterative process, where, in Excel, we adjust the ratings hundreds of times; after all, to adjust for SOS, you have to adjust for the SOS of each opponent, and the SOS of each opponent’s opponent, and so on.

The table below shows the top 200 scoring defenses since 1932. Here’s how to read the 2002 Bucs line. That season, Tampa Bay allowed 9.4 points per game less than league average. The average defense the Bucs faced — using the iterative method to derive SOS grades — was 0.4 points above average. Therefore, Tampa Bay is credited with an adjusted rating of 9.8 PPG better average. The standard deviation of defensive ratings in the NFL in 2002 was 3.45, giving the Buccaneers a Z-score of 2.83, the highest ever. The table below is fully sortable and searchable, and shows the top 200 defenses. [continue reading…]

{ 35 comments }

Regular readers know I’m not prone to exaggeration. I’m more of a splits happen kind of guy. But Super Bowl XLVIII will, in my opinion, be the greatest passing showdown ever. This year’s Super Bowl checks in as the greatest offensive/defensive showdown in Super Bowl history (and the greatest of any game, regular or postseason, since 1950). That’s because the passing showdown between Denver and Seattle is arguably the greatest of any game in all of pro football history.

How can we quantify such a statement? I’m glad you asked. If you recall, I labeled the 2013 Seahawks as one of the five greatest pass defenses since 1950. For new readers, Adjusted Net Yards per Attempt is calculated as follows:

[math]
(Gross Pass Yards + 20 * PTDs – 45 * INTs – Sack Yds)/(Attempts + Sacks)[/math]

In 2013, the Seahawks allowed 3.19 Adjusted Net Yards per Attempt (Seattle allowed 3,050 gross passing yards and 16 TDs, while forcing 28 interceptions and recording 298 yards lost on sacks, all over 524 pass attempts and 44 sacks.). The other 31 pass defenses allowed an average of 5.98 ANY/A, which means Seattle’s pass defense was 2.79 ANY/A above average. Over the course of the 568 opponent dropbacks, this means the Seahawks provided 1,582 adjusted net yards of value over average. In other words, the Seattle pass defense provided 99 adjusted net yards over average on a per game basis. Let’s be clear: the Legion of Boom is not just a hype machine, and Richard Sherman, Earl Thomas, Kam Chancellor, and company form the best secondary in the league.

All other passing attacks are pushed aside when Manning is involved.

All other passing attacks are pushed aside when Manning is involved.

Denver’s offense was even more dominant, although that’s to be expected: in general, the spread in offensive ratings is a bit wider than it is on the defensive side of the ball. Denver threw for 5,572 gross passing yards and 55 touchdowns, while throwing just 10 interceptions and losing only 128 yards to sacks. The Broncos had 675 pass attempts and were sacked just 20 times, giving them an 8.77 ANY/A average. The other 31 offenses averaged only 5.79 ANY/A, meaning the Broncos were 2.98 ANY/A better than average. Over the 695 dropbacks the team had, that means Denver provided 2,072 adjusted net yards of value average average. On a per-game basis, that’s 130 yards of value each game!

So, how do we judge the greatest passing showdowns in football history? Denver’s passing offense gets a rating of +130, while Seattle’s pass defense gets a rating of +99. Those two numbers have a Harmonic Mean of 112. That’s easily the most in Super Bowl history. In fact, it’s the third most in any playoff game ever, and those other two games each have asterisks.

In the 1961 AFL, the Houston Oilers behind George Blanda, Bill Groman, and Charley Hennigan possessed an incredible passing offense (rating of +167), while the San Diego Chargers had a dominant pass defense (+129). But in the early days of the AFL, the talent pool was diluted; this would be akin to comparing two teams in non-BCS conferences with out-of-this-world statistics to a matchup between champions in two power conferences. For what it’s worth, Houston won the game — played in San Diego — but with a catch. The Oilers offense was shut down, as Blanda went 18/40 for 160 yards with 1 touchdown and 5 interceptions…. but Houston won 10-3, as Jack Kemp threw four picks for the Chargers. [continue reading…]

{ 1 comment }

Are Teams Afraid To Pass Against Seattle?

The Legion of Boom May Be Harmful To Your Offense's Health

The Legion of Boom May Be Harmful To Your Offense's Health.

We know that the Seahawks pass defense is historically good, but the title of this post sounds like it was written by a Seahawks homer, right? I mean, who else besides a green-and-blue fanboy (or maybe Richard Sherman or Earl Thomas) would write something as absurd as “Seattle’s pass defense is so good that teams are afraid to throw on them!!!”

The thing is, it’s kind of true. Seattle faced only 568 pass attempts (including sacks) during the regular season, the sixth fewest in the NFL.  Some of that is due to the Seahawks pace on offense and dominance of a defense that prevented sustained drives; even still, opponents passed on “only” 57.4% of all plays against Seattle.

Seattle ranked below average — 18th — in percentage of pass plays faced, but there’s a reason I put only in quotes. Seattle held an average lead over every second of game play this year of 5.6 points, the third best mark in the NFL. Denver and San Francisco were the only teams to play with larger leads, and they ranked 6th and 7th in percentage of plays faced that were passes. This is hardly a newsflash — teams generally throw often when trailing — but that wasn’t the case with 2013 Seahawks.

When Steve Buzzard used the Game Scripts data to determine defensive pass identities, he found that teams were more hesitant to pass against Seattle (once adjusting for the score and strength of schedule) than against any team in the league. I thought it would be interesting to take another crack at measuring this effect. We can use the score differential after each of the four quarters of the game to determine how many pass attempts (as a percentage of total plays) a team *should* face. [continue reading…]

{ 4 comments }

The NFC West Won 75% of Non-Division Games

Kaep can't afford Beats by Dre

Kaep before he could afford Beats by Dre.

It was a very good year for the NFC West. Seattle is heading to Super Bowl XLVIII, as king of the best division in football. To get to MetLife Stadium, the Seahawks had to defeat the 49ers in the NFC Championship Game, which is only fitting after the scorched-earth run by the division during the regular season. Seattle went 9-1 outside of the division in 2013, losing only in Indianapolis (and 10-1 including the playoffs). The Arizona Cardinals went 8-2 when not facing NFC West opponents, with the only losses coming in Philadelphia and New Orleans. The 49ers went 7-3 (8-3 including playoffs), losing in New Orleans and at home to Carolina and Indianapolis. That means the top 3 teams in the NFC West went 24-6 outside of the division in the regular season, with all losses coming to 10+ win playoff teams.

Unlike the rest of the division, the Rams actually beat both New Orleans and Indianapolis. But St. Louis lost to Dallas, Carolina, Tennessee and Atlanta (in week 2), giving the Rams a 6-4 record outside the NFC West. All told, the division finished a remarkable 30-10 in non-division games this year. That’s tied for the 2nd best mark since 1970, and tied for the best performance since realignment in 2002. Wait until Richard Sherman hears this news.

[continue reading…]

{ 8 comments }

Super Bowl Metrics

The table below shows each Super Bowl champion since 1970 and its rank in various categories. At the top, I’ve included an average of the ranks of the teams over the last 10 years and since 1970, and each team is hyperlinked to its Pro-Football-Reference team page. The categories in this first table are record, points for, points allowed, Pythagenpat record, offensive yards, defensive yards, yards differential, offensive pass yards, offensive rushing yards, defensive passing yards (i.e., passing yards allowed), and defensive rushing yards. [continue reading…]

{ 2 comments }

Trivia Podcast with Jason Lisk of The Big Lead

Longtime readers know that Jason and I started together at the Pro-Football-Reference blog. Over there, Doug, Jason, and I would compete in trivia podcasts from time to time, which was as geeky as you think it is. Well, Jason and I got together last week and asked each other multiple questions in three separate categories. The way we structured the podcast, it should be easy for you to listen and play along at the same time, too.  Post in the comments how you fared, or just make fun of me for not knowing anything about NFL trivia compared to Jason.

You can listen here, or via iTunes here.

{ 5 comments }

The table below shows the results of every game in the division round of the playoffs from 1990 to 2012. Each game is displayed from the perspective of the home team. For example, last year, Denver hosted Baltimore in the second round of the playoffs, and you can click on the Boxscore link to see the full boxscore at Pro-Football-Reference. Denver lost 38-35 as a 9-point favorite, and the Over/Under was 44.5. The “dnc” means that the Broncos did not cover.

YearHomeRoadBoxscorePFPALineO/UResultATS
2012SFOGNBBoxscore4531-345.5Woncover
2012DENBALBoxscore3538-944.5Lost (OT)dnc
2012ATLSEABoxscore3028-347Wondnc
2012NWEHOUBoxscore4128-9.551Woncover
2011SFONORBoxscore36323.547Woncover
2011NWEDENBoxscore4510-13.550Woncover
2011BALHOUBoxscore2013-837.5Wondnc
2011GNBNYGBoxscore2037-854.5Lostdnc
2010ATLGNBBoxscore2148-1.543.5Lostdnc
2010PITBALBoxscore3124-337Woncover
2010NWENYJBoxscore2128-9.545Lostdnc
2010CHISEABoxscore3524-1043Woncover
2009INDBALBoxscore203-6.544Woncover
2009NORARIBoxscore4514-757Woncover
2009MINDALBoxscore343-2.545Woncover
2009SDGNYJBoxscore1417-942.5Lostdnc
2008TENBALBoxscore1013-333.5Lostdnc
2008CARARIBoxscore1333-1049.5Lostdnc
2008NYGPHIBoxscore1123-439Lostdnc
2008PITSDGBoxscore3524-6.538.5Woncover
2007GNBSEABoxscore4220-7.544Woncover
2007NWEJAXBoxscore3120-13.551.5Wondnc
2007DALNYGBoxscore1721-747.5Lostdnc
2007INDSDGBoxscore2428-1147Lostdnc
2006BALINDBoxscore615-441Lostdnc
2006NORPHIBoxscore2724-4.548.5Wondnc
2006SDGNWEBoxscore2124-546.5Lostdnc
2006CHISEABoxscore2724-8.537.5Won (OT)dnc
2005DENNWEBoxscore2713-344Woncover
2005SEAWASBoxscore2010-8.541Woncover
2005CHICARBoxscore2129-331Lostdnc
2005INDPITBoxscore1821-8.546.5Lostdnc
2004ATLSTLBoxscore4717-6.549Woncover
2004PITNYJBoxscore2017-935.5Won (OT)dnc
2004NWEINDBoxscore203-151Woncover
2004PHIMINBoxscore2714-847Woncover
2003NWETENBoxscore1714-634Wondnc
2003STLCARBoxscore2329-746Lost (OT)dnc
2003KANINDBoxscore3138-353Lostdnc
2003PHIGNBBoxscore2017-443Won (OT)dnc
2002TENPITBoxscore3431-4.544Won (OT)dnc
2002PHIATLBoxscore206-7.538.5Woncover
2002OAKNYJBoxscore3010-5.547Woncover
2002TAMSFOBoxscore316-639.5Woncover
2001NWEOAKBoxscore1613-341.5Won (OT)push
2001CHIPHIBoxscore1933-332.5Lostdnc
2001PITBALBoxscore2710-5.532Woncover
2001STLGNBBoxscore4517-1154.5Woncover
2000MINNORBoxscore3416-849.5Woncover
2000OAKMIABoxscore270-942Woncover
2000NYGPHIBoxscore2010-4.533.5Woncover
2000TENBALBoxscore1024-634Lostdnc
1999TAMWASBoxscore1413-4.538Wondnc
1999JAXMIABoxscore627-837.5Woncover
1999INDTENBoxscore1619-5.546.5Lostdnc
1999STLMINBoxscore4937-752Woncover
1998ATLSFOBoxscore2018-3.553Wondnc
1998DENMIABoxscore383-13.548Woncover
1998NYJJAXBoxscore3424-943Woncover
1998MINARIBoxscore4121-16.552.5Woncover
1997PITNWEBoxscore76-642Wondnc
1997SFOMINBoxscore3822-11.542Woncover
1997KANDENBoxscore1014041Lostdnc
1997GNBTAMBoxscore217-1338Woncover
1996GNBSFOBoxscore3514-541.5Woncover
1996DENJAXBoxscore2730-12.543.5Lostdnc
1996CARDALBoxscore26173.537.5Woncover
1996NWEPITBoxscore283-341.5Woncover
1995PITBUFBoxscore4021-642Woncover
1995SFOGNBBoxscore1727-9.552Lostdnc
1995KANINDBoxscore710-841.5Lostdnc
1995DALPHIBoxscore3011-13.545.5Woncover
1994PITCLEBoxscore299-3.532.5Woncover
1994SFOCHIBoxscore4415-15.546.5Woncover
1994SDGMIABoxscore2221-346Wondnc
1994DALGNBBoxscore359-1043Woncover
1993BUFRAIBoxscore2923-733.5Wondnc
1993SFONYGBoxscore443-841.5Woncover
1993HOUKANBoxscore2028-741.5Lostdnc
1993DALGNBBoxscore2717-13.542Wondnc
1992PITBUFBoxscore324-236Lostdnc
1992SFOWASBoxscore2013-9.539Wondnc
1992MIASDGBoxscore310-237Woncover
1992DALPHIBoxscore3410-6.538Woncover
1991DENHOUBoxscore2624-3.537Wondnc
1991WASATLBoxscore247-11.543Woncover
1991DETDALBoxscore386043Woncover
1991BUFKANBoxscore3714-10.541Woncover
1990BUFMIABoxscore4434-734Woncover
1990SFOWASBoxscore2810-841Woncover
1990RAICINBoxscore2010-643Woncover
1990NYGCHIBoxscore313-733Woncover

Overall, home teams are 67-25 and 49-42-1 against the spread.

{ 1 comment }

It stands to reason that when a team has a bottom five scoring offense, they’re going to make some changes. But today we’re going to quantify what we all know. By definition, there were 55 teams to rank in the bottom five in scoring from 2002 to 2012. What changes did those teams make?

  • 29 of the teams (53%) switched head coaches, 43 switched offensive coordinators (78%), and 32 teams (58%) had a different starting quarterback in week 1 of the following season. In 19 of the 55 cases (35%), the team got rid of the whole trio.
  • I don’t think it’s too surprising that the offensive coordinator is the most likely casualty.  In the 12 cases where the offensive coordinator was retained, the head coach was only fired in one of those seasons. That was in Cincinnati after the 2002 season, when Bob Bratkowski was kept after Dick LeBeau was replaced by Marvin Lewis. The Bengals drafted Carson Palmer with the first overall pick a few months later, but Jon Kitna kept the quarterback job for the 2003 season.
  • In only four of the other 11 cases where the offensive coordinator was fired did the team switch quarterbacks. In 2009, Steve Spagnuolo and Pat Shurmur struggled in St. Louis under Marc Bulger; the team landed the number one overall pick, drafted Sam Bradford, and played him immediately. Also that year, Eric Mangini and Brian Daboll could not get the Cleveland offense humming under Brady Quinn. The solution was to bring in Jake Delhomme in 2010. In 2008, the Bengals offense struggled when Palmer missed most of the year due to injury. Lewis and Bratkowski were retained, as Cincinnati pinned the blame on Ryan Fitzpatrick. Finally, in 2006, Tampa Bay ranked 31st in scoring despite the presence of coaching guru Jon Gruden and Bill Muir. A rookie Bruce Gradkowski (playing after Chris Simms) was replaced in 2007 with Jeff Garcia.

There were only 7 of 55 situations where a team had a bottom five offense but brought back the head coach, offensive coordinator, and quarterback. Below is the full information for the 55 teams; analysis to come after the jump. For the Year N QB, I’ve listed the quarterback with the most attempts. For the Year N+1 QB, I chose to list the quarterback that started in week one of that season. All team/player/coach cells are linked to the relevant PFR page. [continue reading…]

{ 3 comments }

Buffalo just sacked Tannehill again

Buffalo just sacked Tannehill again.

Did you happen to notice the stat line produced by Ryan Tannehill last week? He completed just 10 of 27 passes for only 82 yards in a 19-0 loss to the Bills. A 37% completion rate and a 3.0 yards per attempt average are ugly numbers in their own right, but Tannehill was also sacked seven times for 46 yards. That means on 34 dropbacks, he produced…. 36 yards.

Tannehill did not throw an interception in the 19-0 shutout, so perhaps that’s why this game has gone under the radar. But a quarterback does not get to fare so poorly and avoid coverage of it at Football Perspective. Can you imagine if Tony Romo or Jay Cutler had a game like this? Why aren’t people talking about this? Tannehill averaged One Net Yard per Attempt over THIRTY FOUR DROPBACKS!?! Tannehill’s NY/A average dropped from 5.72 to 5.46, an unheard of drop this late in the season.

To be fair, Tannehill’s lack of interceptions does make the performance less horrible. But today, I want to just focus on yards produced on pass attempts (including sacks). Lots of good quarterbacks have had bad days when it comes to interceptions, but how often does a quarterback struggle so much on nearly every play for 34 plays?

Let’s provide some context. This season, the average pass play (including sacks) has produced 6.217 net yards, which means you would expect 34 dropbacks to produce 211.4 yards. That means Tannehill’s performance produced 175.4 net yards under average. Among quarterbacks with at least 15 pass attempts in a game, that’s the 25th worst performance since 1960, and the 7th worst performance since 2000.

The table below shows the worst 250 performances since 1960, although the only game I calculated for 2013 was Tannehill’s. The worst performance using this formula goes to Green Bay’s Lynn Dickey in 1981 against the Jets in week 16. He completed just 12 of 33 passes for 96 yards (I’ve included the TD and INT numbers even though they are not part of the calculation), and was sacked an incredible 9 times for 57 yards (Mark Gastineau, Joe Klecko, and Marty Lyons each had multiple sacks). So on 42 dropbacks, Dickey gained 39 yards, for an average of 0.9 NY/A. The NFL average that season was 6.02 NY/A, which means Dickey produced 214 Net Yards below average.
[continue reading…]

{ 9 comments }
Next Posts Previous Posts