≡ Menu

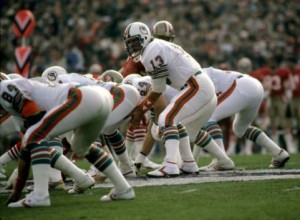
How quaint: a quarterback taking snaps form under center

How quaint: a quarterback taking snaps form under center.

With one game remaining, Peyton Manning has already set the new single-season record with 51 passing touchdowns (two months ago, I projected Manning to finish the season with 52 touchdowns). But all records must be viewed in their environment, and NFL teams are averaging 1.58 touchdown passes per team game this year, the highest average since 1948. In 1984, the year Dan Marino threw 48 touchdowns, teams averaged 1.37 touchdown passes per game.

So which season is more impressive? That’s a complicated question, and one that could be answered in many ways. In my view, the question boils down to which performance was more outstanding; in mathematical terms, we could define that as which season was farthest from the mean.

To make life a little simpler, I’m going to analyze this question on the team level, meaning we will compare “Denver 2013” to “Miami 1984.” Of course, this approach is preferable in many ways, since when we praise Manning we really mean “Manning with his offensive line and his coaching staff throwing to Demaryius Thomas, Wes Welker, Eric Decker, and Julius Thomas.” And “Marino in 1984” means “Marino and Mark Clayton and Mark Duper and Dwight Stephenson and Ed Newman.”

This season, the Broncos have 51 touchdown passes. The other 31 teams (through 15 games) are averaging 22.8 passing touchdowns, which means Denver is 28.2 touchdowns above average. The standard deviation of the 32 teams in passing touchdowns is 7.4; as a result, we can say that the Broncos are 3.84 standard deviations above average, also known as their Z-score.

In 1984, the other 27 teams (through 16 games) averaged 21.0 touchdowns, while the Dolphins threw 49 scores (Jim Jenson, a college quarterback who played receiver for Miami, threw a 35-yard touchdown to Duper against the Patriots off a Marino lateral). The standard deviation that season in touchdown passes at the team level was 7.5, which gives Miami a Z-score of 3.72 in 1984.

So the Broncos this season have been more extraordinary, at least by this measure. One nice thing about using the Z-score is we don’t need to adjust for games played. I went ahead and calculated the Z-scores for every team since 1932. The current Broncos are #1, with the ’84 Dolphins in second place. The third place team isn’t the Tom Brady 2007 Patriots; that team is down at #7, because the standard deviation in passing touchdowns among the league’s 32 teams was 8.8 that season. Instead, the third slot goes to the 1986 Dolphins. Few remember that Marino threw 44 touchdowns that season; add in Don Strock’s two touchdowns, a lower league average and a smaller standard deviation, and those Dolphins get a Z-score of 3.70.

Let’s look at the top 100 teams using this metric. The 2004 Colts ranked fifth (if you click on the cell in the team column, the link takes you to that team’s PFR page) in Z-score. That year, Indianapolis threw 51 touchdowns, while the other 31 teams averaged 21.97 touchdown passes. That means Indianapolis was 29.03 touchdowns above average, the highest production above average to date. But that year, the standard deviation among the 32 teams in passing touchdowns was 8.53, giving the Colts a Z-score of “only” 3.41; that’s why they’re 5th, not first.
[continue reading…]

{ 38 comments }

First round talent

First round talent.

In 1990, there were 22 running backs who rushed for at least 700 yards. Of those players, Barry Sanders, Ottis Anderson, Sammie Smith, John L. Williams, Emmitt Smith, John Stephens, Lorenzo White, James Brooks, Cleveland Gary, and Neal Anderson were former first round picks. In addition, Bobby Humphrey, Mike Rozier, and Kevin Mack were selected with first round picks in supplemental drafts, bringing the number to thirteen.

Christian Okoye and Thurman Thomas were second round picks, Barry Word was a third round pick, and the rest of the 700+ yard group (Herschel Walker [1]Who, of course, was morally a first round pick, but fell in the draft because he was in the USFL at the time., Johnny Johnson, Marion Butts, Merril Hoge, Derrick Fenner, and Earnest Byner) was drafted after the fourth round.  But the majority of the top running backs were former first round picks.

1990 was a bit of an outlier year.  That season, 48.9% of all rushing yards by NFL running backs came from backs selected among the first 30 picks.  If you also include the rushing yards produced by Anthony Thompson, Dalton Hilliard, and Ickey Woods — each of whom was drafted 31st overall — the total jumps to 51.1% of all rushing yards by running backs that season. That means the 31st pick in the draft was the tipping point, or median draft slot, for rushing yards by running backs that season.

[continue reading…]

References

References
1 Who, of course, was morally a first round pick, but fell in the draft because he was in the USFL at the time.
{ 10 comments }

Eli Manning in elite INT territory

After a five-interception performance against a dominant Seattle pass defense, Eli Manning now has 25 interceptions this season. The odds are extremely low, but it’s not impossible that he throws ten more interceptions and ties the modern record set by Vinny Testaverde in 1988. That year, a 25-year-old Testaverde threw 35 interceptions when the league average interception rate was 3.91%. Since Testaverde threw 466 passes that season, we could say that a league-average quarterback would have thrown 18.2 interceptions; therefore, Testaverde threw 16.8 interceptions over average that year.

So far in 2013, the average interception rate is just 2.70%. Since Manning has thrown 485 passes, we would expect a league-average passer to record 13.1 interceptions. With 25 interceptions, that puts Manning at 11.9 interceptions above average. The table below shows the top 100 leaders in interceptions over average since 1950. [continue reading…]

{ 10 comments }

Dear Pete Carroll

At the end of Sunday’s game against the 49ers, the Seahawks had an opportunity to (attempt to) allow the 49ers to score. Following a  Colin Kaepernick gainof 8 yards on 3rd-and-7, the 49ers had the ball, down by 1, at the Seahawks 7-yard line with 2:39 remaining.  The Seahawks were out of timeouts, which meant if San Francisco wanted to, it could drain the clock to under 30 seconds. Keith Goldner at Advanced NFL Stats already covered this issue well: “Once the 49ers had the 1st-and-Goal, with the impending snap coming under the 2:40 mark, the Seahawks should have immediately attempted to allow the 49ers to score.”

I agree with Keith’s analysis: the Seahawks would have been in a better situation having the ball following a kickoff with 2:30 left in the game, trailing by 5-7 points, than to have been in the desperate situation they were in. But what does coach Pete Carroll have to say about whether it would have been wise to allow the 49ers to score a touchdown?

“There’s a lot of gut in that decision…We had the talk, and it’s just not in our mentality to let anybody have anything….I’m going to do a little research this week and see if anyone has ever done that and won,” Carroll said.

I don’t think we need to go beyond Keith’s analysis, which correctly frames the issue. We don’t need to look at historical numbers to know that trailing by 5-7 with the ball on your own 22 with 2:30 left is better than trailing by 2 with the ball on your own 22 with 26 seconds remaining. But since coach Carroll used to coach the Jets, I figured I would do him a solid and provide him with a history lesson. [continue reading…]

{ 2 comments }

Historical SOS-Adjusted Team Rankings

The GSOT looks good in this system

The GSOT looks good in this system.

A couple of weeks ago, I presented another way to do team rankings. The method implicitly incorporates strength of schedule and margin of victory without having to do any hard math. For example, assume Team A hosts Team B and wins by 7 points. After adjusting for home field, Team A gets credit for winning by 4 points. The next step is to measure how Team B fared in its other 15 games. If Team B lost by more than 4 points in 4 other games, and won (or lost by less than 4) in its other 11 games, that would mean Team A had the 5th best result of the season against Team B. Therefore, we give Team A 5 points for this game. It’s that simple. You get credit for beating your opponent by more than other teams beat that opponent.

I don’t have a cool name for this sort of system, but I’m sure someone out there has been using this methodology for a long time and has already given it a name. So if you know it, post it in the comments. But I thought it would be fun to run through this method for every team since 1932. That’s what I’ve done in the table below. Keep in mind, though, that it’s only appropriate to compare teams who played the same number of games in a season. In a 9-game season, a team is obviously going to produce a much lower grade than a team in a 16-game season.

Here’s how to read the table below, which shows each team since 1932. It lists the top team in 2012, then the top team in 2011, then the top team in 2010, and so on, but you can use the search or sort functions to run whatever queries you like. In 2012, the Broncos ranked 1st in this system playing in the NFL (yes, that means I’ve got AFL and AAFC teams in here, too). The Broncos had an average score of 4.4 points. Denver had a win percentage of 0.831 that season, while playing 16 games (useful information when sorting), a 13-3 record. What’s the GR1 column? That means there was 1 Game where the Broncos Recorded a 1 — i.e., by delivering the biggest beatdown of the season (I also included games in this category if one other team delivered an equally-dominant performance against them). The Broncos ratings each week had a Standard Deviation of 3.1. I’m not quite sure what to do with the standard deviation column, but it was easy enough to include and might help you identify great teams that sat players in week 17.
[continue reading…]

{ 7 comments }

Presented below, without comment, is a table of every matchup featuring Tom Brady & Peyton Manning as the starting quarterbacks. Enjoy:

DateHome TeamFavoritePatriots PassingColts/Broncos PassingAdvantageOutcome
2001-09-30NWECLT -11.513-23, 159 yds, 0 TD, 0 Int, 6.63 ANYPA25-43, 240 yds, 1 TD, 3 Int, 2.72 ANYPA+3.91, NWE44-13, NWE
2001-10-21CLTCLT -10.517-21, 262 yds, 4 TD, 0 Int, 16.29 ANYPA22-34, 305 yds, 1 TD, 0 Int, 8.55 ANYPA+7.73, NWE38-17, NWE
2003-11-30CLTCLT -3.526-35, 226 yds, 2 TD, 2 Int, 4.76 ANYPA29-48, 272 yds, 4 TD, 1 Int, 6.14 ANYPA+1.38, CLT38-34, NWE
2004-01-18 (C)NWENWE -3.522-37, 237 yds, 1 TD, 1 Int, 5.73 ANYPA23-47, 208 yds, 1 TD, 4 Int, 0.94 ANYPA+4.79, NWE24-14, NWE
2004-09-09NWENWE -326-38, 320 yds, 3 TD, 1 Int, 8.38 ANYPA16-29, 244 yds, 2 TD, 1 Int, 7.97 ANYPA+0.41, NWE27-24, NWE
2005-01-16 (D)NWENWE -118-27, 115 yds, 1 TD, 0 Int, 4.50 ANYPA27-42, 230 yds, 0 TD, 1 Int, 4.30 ANYPA+0.20, NWE20-3, NWE
2005-11-07NWECLT -325-40, 254 yds, 3 TD, 0 Int, 7.48 ANYPA28-37, 321 yds, 3 TD, 1 Int, 9.08 ANYPA+1.60, CLT40-21, CLT
2006-11-05NWENWE -2.520-35, 201 yds, 0 TD, 4 Int, 0.60 ANYPA20-36, 301 yds, 2 TD, 1 Int, 7.59 ANYPA+6.99, CLT27-20, CLT
2007-01-21 (C)CLTCLT -321-34, 226 yds, 1 TD, 1 Int, 5.74 ANYPA27-47, 330 yds, 1 TD, 1 Int, 6.10 ANYPA+0.36, CLT38-34, CLT
2007-11-04CLTNWE -521-32, 237 yds, 3 TD, 2 Int, 6.09 ANYPA16-27, 210 yds, 1 TD, 1 Int, 6.17 ANYPA+0.08, CLT24-20, NWE
2009-11-15CLTCLT -1.529-42, 364 yds, 3 TD, 1 Int, 8.61 ANYPA28-44, 316 yds, 4 TD, 2 Int, 6.80 ANYPA+1.81, NWE35-34, CLT
2010-11-21NWENWE -4.519-25, 178 yds, 2 TD, 0 Int, 8.38 ANYPA38-52, 396 yds, 4 TD, 3 Int, 6.56 ANYPA+1.83, NWE31-28, NWE
2012-10-07NWENWE -623-31, 193 yds, 1 TD, 0 Int, 6.09 ANYPA31-44, 324 yds, 3 TD, 0 Int, 8.35 ANYPA+2.26, DEN31-21, NWE
2013-11-24NWEDEN -2.534-50, 324 yds, 3 TD, 0 Int, 7.25 ANYPA19-36, 132 yds, 2 TD, 1 Int, 3.34 ANYPA+3.90, NWE34-31, NWE
{ 6 comments }

Denver has scored at a historic rate

Denver has scored at a historic rate.

Today’s insane statistic comes courtesy of RJ Bell: the difference between Denver and the #2 team in points per game is larger than the difference between the #2 and #31 teams. The Broncos are averaging 39.8 points per game this season, 11.6 points more than the (surprisingly second-ranked) Bears. And Chicago is averaging just 9.9 more points per game than the Jets, the #31 ranked scoring team.

That is, well, crazy. The record for points per game in a season is 38.8, set by the 1950 Rams. The 2007 Patriots are second at 36.8, and both of those teams scored slightly more points through ten games than the 2013 Broncos. So while Denver is on pace to break the scoring record, some regression to the mean over the final six games should be expected.

If the Broncos want to set the record for most points scored relative to the second highest scoring team in the league, Peyton Manning and company have some work to do. That mark is held by the ’41 Bears, who averaged 36.0 points per game, 12.5 more than the Packers that year. Second and third on that list are the ’07 Patriots (8.4) and ’50 Rams (8.3), so Denver has a realistic shot of setting the modern record.

I’ll be honest: as dominant as the Broncos offense has been, I’m a little surprised to see them so far ahead of the competition in points scored. After all, consider:

  • The Eagles have just 19 fewer yards than the Broncos, and Nick Foles actually leads Manning in both passer rating and Adjusted Net Yards per Attempt;
  • In PFR’s Expected Points Added, the Broncos offense is at 14.7 EPA-added per game, while the Saints offense is at 11.3. That’s a relatively small difference considering the fact that Denver has scored 12.1 more points per game than New Orleans.
  • The Chargers have a higher completion percentage than the Broncos and six fewer turnovers, but have averaged 17 fewer points per game.
  • The Packers are actually a hair ahead of Denver in yards per play (6.3531 to 6.3529), but have scored two fewer touchdowns per game.

So what’s going on? I’m perfectly fine with Denver being general run-of-the-mill dominant, but the team’s points scored numbers makes it seem like the Broncos might be the greatest offensive machine ever. I think I’ve identified the two reasons to explain the gap:

Red Zone success

Philadelphia has scored a touchdown just 46% of the time the Eagles made it into the red zone, which ranks 28th in the league. San Diego isn’t much better at 50% (22nd). The Saints are at 52.5% (20th), and the Packers are down at 30th at 43%. So some excellent offenses are really struggling in the red zone, which gives them disproportionately low points per game averages. Oh, and Denver? They’re at 79.1%, by far the highest rate in the league. It’s not unusual for a great offense to dominate in the red zone — the ’07 Pats were at 70% — but what is unusual is seeing the other top offenses struggle there.

I have red zone data going back to 1997, and the highest ever performance was set by Kansas City in 2003. The Trent GreenPriest HolmesTony Gonzalez Chiefs scored a touchdown on 77.8% of all red zone opportunities (42 out of 54), so the Broncos (34 out of 43) could break that record this year. More likely, though, is that the Broncos go from otherworldly in the red zone to just great, which would drop the team’s points per game average.

Number of Drives

The Broncos are averaging 2.85 points per drive, while the Saints are #2 at 2.46. That’s not a huge difference — the gap between #2 and #7 is slightly bigger. The difference, as you can deduce, is that the Broncos are averaging 13 drives per game while the Saints are at just 11.3 drives per game. Why is that? New Orleans’ average drive takes 2:56 minutes, the third-longest in the league (and San Diego is #1 at 3:13), while the Broncos are in the bottom five at 2:17 (the Eagles are last at 2:02). That Chip Kelly edge is erased, though, because Philadelphia’s opponents average 2:48 per drive, the third highest rate in the league. Denver’s opponents take just 2:18 per drive, the third lowest (just a second ahead of Detroit and eight seconds longer than Kansas City).

The Broncos defense is not great, but it does rank 6th in completion percentage allowed. Combine that with the fact that Denver ranks 4th in percentage of opponent plays that are passes, and incomplete passes occur on 25% of all plays run by Broncos opponents, the second-highest rate in the league behind Kansas City. That’s not surprising for a team with such a high Game Script, but it does stop the clock from running for long stretches, which gives Denver’s offense more possessions The Chargers are 28th in this statistic (18%), which is one reason why San Diego is dead last in offensive drives (10.2 per game).

But there’s another reason why Broncos’ opponents tend to have short drives: Denver leads the league in 20+ yard plays allowed at 54. As a result, teams don’t end up with many clock-chewing drives against Denver: opponents tend to gain big yards quickly or throw incomplete passes. That increases the number of drives for the Broncos, which (one could argue) inflates the success of the team’s offense. It’s all relative, of course — Denver is still #1 in points per drive by a wide margin — but it’s worth recognizing that Denver has scored 75% more points per game than an average of the other 31 teams, but “just” 62% more on a per-drive basis. That accounts for about 3 points per game. Add in the insane success in the red zone, and the lack of success there by the other top teams, and you have the reasons for the crazy stat at the top of today’s post.

Manning Record Watch Update

After six games, I analyzed how likely Manning was to break the single-season touchdown record. At the time, he had 22 touchdowns, and the formula projected him to throw 2.99 TDs/G the rest of the way to finish with 52 touchdowns, narrowly breaking Tom Brady’s record.

Now? Manning has 34 touchdowns, as his pace has only slightly declined. What does that mean? To calculate Manning’s odds using Bayes Theorem we need to know four things:

1) His Bayesian prior mean (i.e., his historical average): 2.38, as this number wouldn’t change from the original post.

2) His Bayesian prior variance (the variance surrounding his historical average): Again, no change here, so we use 0.0986.

3) His observed mean: Instead of 3.667, we will use 3.4.

4) His observed variance: This one involves just a little bit of work. What I suggested we do last time is calculate the number of passing touchdowns per game Manning averaged in the first six (now ten) games of each season since 2000, along with his average over the rest of the season (then, 8-10 games, now, 4-6 games). Then we take the difference of the variances of each column, as we did in step two.

YearTD/G Thru 10ROY GTD/G ROYDiff
20002.1620.1
20011.861.330.47
20021.961.330.57
20031.961.670.23
20043.552.80.7
20052420
2006261.830.17
20071.653-1.4
20081.751.8-0.1
20092.143-0.9
2010262.17-0.17
20122.462.170.23
Variance0.220.31

Manning’s variance over the rest of the season is 0.3052 TDs/G, while his variance through ten games is 0.2214; the differential there is 0.0838, which is the variance of our current mean.

Once you have your number for these four variables, then you substitute those numbers into this equation:

Result_mean = [(prior_mean/prior_variance)+(observed_mean/observed_variance)]/[(1/prior_variance)+(1/observed_variance)]

Or, using our numbers:

[(2.38 /0.0986) + (3.4 / 0.0838)] / [(1/0.0986) + (1/0.0838)]

which becomes

[24.14 + 40.57] / (22.08) = 2.93

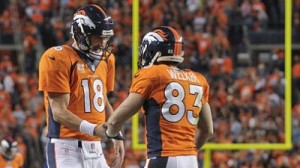
This picture will never get old

This picture will never get old.

After averaging 3.667 TDs/G over 6 games, we projected Manning to average 2.99 TDs/G the rest of the year. Since he averaged “only” 3 touchdowns per game over his next four games, we downgrade him from 2.99 to 2.93. Of course, we already had a significant regression factored into his future projection — we dropped him by 0.67 TDs/game from his average, which is the point of using Bayes Theorem. So while he’s at “only” 3.4 TDs/G on the season after 10 games, since he’s played at that level for longer, he only loses about half a touchdown per game over his projection the rest of the way.

That gives Manning 17-18 touchdowns, which puts him at a season-ending projection of 51-52 touchdowns. He’s still more likely than not to break the record, although obviously this analysis ignores lots of elements like strength of schedule. And with a visit to Kansas City and a game against the Titans (who have allowed a league-low 7 touchdowns through the air), perhaps he’s actually an underdog to even tie Brady at 50.

{ 3 comments }

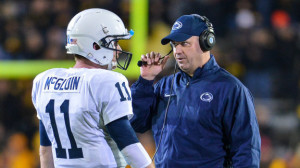
O'Brien teaches McGloin how to throw a football

O'Brien teaches McGloin how to throw a football.

Two weeks ago, Jeff Tuel became the Buffalo starting quarterback after Thaddeus Lewis (who was replacing an injured EJ Manuel) couldn’t play against the Chiefs due a ribs injury. Today, former Penn State quarterback Matt McGloin will start for the Raiders, as Terrelle Pryor will miss the game against the Texans due to an injured knee.

This is a mind-boggling development for fans of college football. McGloin was a walk-on at Penn State who co-starred with four-star recruit Rob Bolden in one of the least-competent quarterback battles in recent memory. In 2010 and 2011, the duo seemingly alternated every other week, which was about how long it took for one of them to lose the job. Among the 90 quarterbacks who threw for at least 3,000 yards over that two-year period, McGloin ranked 87th in completion percentage. Then, Bill O’Brien arrived, and McGloin turned into a real quarterback, and led the Big 10 in both passing yards and passing touchdowns.

McGloin joins Tuel, Max Hall, and Matt Moore as the only undrafted free agent rookies to start a game at quarterback in the last ten years. The table below is a bit overinclusive: it includes all undrafted quarterbacks who started a game during the first season in which they played a game. That’s not quite the same thing as starting as a rookie, of course, but it’s the best I can do. Brock Berlin, for example, went undrafted in 2005, so he wouldn’t count, but he appears on the list below. To help you filter through the “sat around for a few years but didn’t get into a game/played in another league” issue, I’ve included an age column.
[continue reading…]

{ 2 comments }

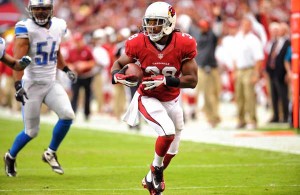
Ellington races for a long touchdown

Ellington races for a long touchdown.

Arizona is one of many teams in the NFL employing a running back by committee philosophy, but no team — now, or at any point in modern history — allocated time quite like the Cardinals. Through nine weeks, Rashard Mendenhall has 105 rushes for 323 yards, giving him a miniscule 3.1 yards per carry average. Mendenhall arrived in the desert this offseason, as part of a reunion with new Cardinals head coach Bruce Arians. The duo worked together for three years in Pittsburgh, where Mendenhall rushed for 3,309 yards and 29 touchdowns and averaged 4.2 yards per carry. But Mendenhall hasn’t been close to the best back added this offseason, as Clemson’s Andre Ellington — a sixth round of the 2013 Draft — has 388 yards this year on 54 carries. Thanks to his spectacular 7.2 yards per carry average, he has outgained Mendenhall despite seeing roughly half as many carries.

How crazy is it for one back in a committee to average more than four more yards per carry than the other back? I ran the following query for every team since 1970:

  • First, I noted the two running backs who recorded the most carries for each team
  • Next, I eliminated all running back pairs where the lead back had over 150 more carries than the backup.
  • I also eliminated all pairings where the lead back was a lead back in name only due to injury to the starter (otherwise, years where Maurice Jones-Drew and Darren McFadden ranked second on their team in carries would be inappropriately included). To do that, I deleted sets where the “lead” back — defined as the back with the most carries — averaged fewer carries per game than the second running back.

After running through those criteria, the table below shows all situations where the backup averaged at least one more yard per rush than the lead back. As always, the table is fully searchable and sortable. It is currently sorted by the difference between the YPC average of the backup and the starter, but you can sort by year to bring the recent instances to the top.
[continue reading…]

{ 8 comments }

Big Red

Big Red.

Kansas City is 9-0. Denver is 8-1. As far as resumes go, it’s hard to beat this matchup. But is it the best ever?

You can’t just average Kansas City’s 100% winning percentage with Denver’s 88.8% rate, since a matchup of teams with 3-0 records (like New Orleans-Miami earlier this year) would produce a better average winning percentage. One simple method would be to use Neil’s method of deriving a team’s “true winning percentage”, which adds 5.5 wins and 5.5 losses to each team’s record. At 3-0, a team has a true winning percentage of only 0.607, so this method rewards teams that have had longer stretches of success. Do the math, and Kansas City has a 0.725 true winning percentage, while Denver is at 0.675. That gives this game an even 0.700 average true winning percentage. So where does that rank?

Pretty darn high. Last year, the highest average true winning percentage in a game was at 0.674, occurring when the 11-2 Texans faced the 10-3 Patriots in that letter jacket game. Denver-Kansas City will be just the fifteenth game since World War II where the two teams have an average true winning percentage of at least 0.700. [1]Five pre-WW II games show up: In 1926, the 11-0-2 Bears lost 7-6 to the 12-1-1 Frankford Yellow Jackets. In the last game of that season, a 14-1-1 Frankford tied a 10-2-1 Pottsville Maroons. Three … Continue reading Let’s look at the first 14, ranked in order of average true winning percentage:
[continue reading…]

References

References
1 Five pre-WW II games show up: In 1926, the 11-0-2 Bears lost 7-6 to the 12-1-1 Frankford Yellow Jackets. In the last game of that season, a 14-1-1 Frankford tied a 10-2-1 Pottsville Maroons. Three years later, the 9-0-0 Packers traveled to New York and beat the 8-0-1 Giants, 20-6. In 1934, the 10-1 Lions lost 19-16 at home against the 11-0 Bears. A week later, the 10-2 Lions went to Chicago and lost 10-7 to the 12-0 Bears.
{ 4 comments }

Tavon Austin’s Record Setting Day

Fisher is introduced to Tavon Austin

Fisher is introduced to Tavon Austin.

The Tavon Austin breakout game is here. First, the #8 pick in the 2013 draft returned a punt off a bounce 98 yards for a second quarter touchdown. A few minutes later, Kellen Clemens hit him for a 57-yard touchdown pass. With St. Louis up 28-0 in the third quarter, Austin caught an 81-yard touchdown.

The third score made him just the 8th player in NFL history with three touchdowns of 50+ yards in the same game, joining Chris Johnson, Qadry Ismail, Randy Moss, Freddie Solomon, Gale Sayers, Billy Cannon, and Raymond Berry. That also means Austin has 236 yards of touchdowns today, the most of any player since 1970.

In fact, that’s the second most in NFL history. The table below shows all 78 players from 1940 to 2012 who recorded at least 160 yards worth of touchdowns in a single game.
[continue reading…]

{ 1 comment }

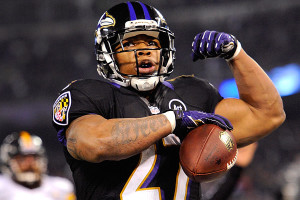
Is Ray Rice Already Washed Up?

Rice is averaging just over five feet, nine inches per carry

Rice is averaging just over five feet, nine inches per carry.

In many ways, the post-Ray Lewis Ravens have flown under the radar. The defending Super Bowl champions are just 3-5, thanks mostly to a mediocre offense. But unless you have Ray Rice on your fantasy team, you probably haven’t noticed just how rough a season the star running back is having. Of course, “Ray Rice” is just a euphemism for “Ray Rice, running behind the Ravens offensive line, playing alongside Joe Flacco and the rest of his Baltimore teammates.” Rice is averaging just 2.7 yards per carry on 97 carries, well below the 4.5 YPC career average he produced prior to 2013. Backup running back Bernard Pierce isn’t doing any better, putting up the same average on 85 rush attempts. As a team, Baltimore is averaging just 2.78 yards per rush, making the Ravens one of just six teams since the merger to average fewer than 2.80 yards per carry through nine games.

As you might expect, much of the blame falls on the Baltimore offensive line. In particular, tackles Michael Oher and Bryant McKinnie have been terrible, so much so that McKinnie was traded to Miami. Pro Football Focus also gives poor run-blocking grades to Ed Dickson, Dallas Clark (unsurprisingly), and Vonta Leach (very surprisingly). I haven’t watched enough of Baltimore to tell you why the Ravens have struggled so significantly to run the ball, but I can provide some perspective on how poorly Rice’s numbers are.

We don’t have play-by-play data going back to 1960, but we do have game-by-game data back that far. I went back and noted every running back who had a season-to-date yards per carry average below 2.80 following the game where he recorded his 97th carry. The table below shows the 43 players to do so from 1960 to 2012, sorted in reverse chronological order. The last player was former Raven Chester Taylor, and here is how his line reads: In 2010, playing for the Bears at age 31, Taylor had 105 carries for 252 yards, producing a 2.4 yards per carry average, following the game where he received his 97th carry of the year. The rest of the season, he had 7 rushes for 15 yards, a 2.14 YPC average.
[continue reading…]

{ 4 comments }

After defeating the Saints 26-20, the Jets now own a 5-4 record. New York was ranked 32nd by ESPN in their pre-season power rankings, a fact Rex Ryan brings up during every other press conference. But while the record is a pleasant surprise, the Jets aren’t necessarily playing well. Or, at least, they play really, really badly in their losses. In fact, the Jets have the worst points differential of any team with a winning record after nine games in NFL history:
[continue reading…]

{ 1 comment }

The Legion of Boom Has Long-Term Effects

The Legion of Boom Has Long-Term Effects.

In week 1, the Seahawks beat the Panthers. In week two, the Panthers lost to the Bills.

In week 2, Seattle crushed San Francisco. In week three, the 49ers lost to Indianapolis.

In week 3, the Seahawks suffocated the Jaguars; in week four, Jacksonville lost to the Colts.

In week 4, Seattle won at Houston; in week five, Houston was embarrassed by the 49ers.

In week 5, the Seahawks played a tight game with Andrew Luck’s Colts, but lost 34-28. In week six, Indianapolis was upset in San Diego.

In week 6, Seattle defeated the Titans; in week seven, Tennessee lost against San Francisco.

As a result, NFL teams are 0-6 this year in games played the week after facing Seattle. Surely this is because of the physical style employed by the Seahawks, and not a quirky stat aided by the fact that four of those games came against the 49ers and Colts. Carolina nearly ended this streak before it began, but was too bruised up to prevent EJ Manuel from finding Steve Johnson alone in the end zone with six seconds left, giving the Bills a 24-23 win. And while at first glance, the Colts loss in San Diego is your classic let-down/look-ahead sandwich (after beating Seattle in week 5 and getting ready for the Peyton Manning return in week 7), the truth is, Indianapolis was just incapable of mustering the physical temerity necessary to beat the rugged Chargers.

Seattle beat the Cardinals in week seven, but the circumstances ensure that this streak will continue to be discussed. If Arizona loses to Atlanta in week eight, that would run the record to 0-7; if the Cardinals win, well, they had an extra three days of rest, so teams would still be winless in games on normal rest after playing the punishing Seahawks.

The “record” for worst record by teams after playing Team X the prior week is 1-13, with the ’97 Packers being Team X. The lone win came when the Vikings, after losing in Green Bay in week four, rebounded to overcome Ty Detmer and the Eagles in week five. You might think there’s something legitimate here — after all, the Packers had Brett Favre, Reggie White, and were the defending Super Bowl champions. Perhaps teams were so “up” to play Green Bay that they were very prone to let downs the following weeks. I’m not convinced.
[continue reading…]

{ 7 comments }

(I originally posted this at the S-R Blog, but I thought it would be very appropriate here as well.)

Just a quick hit of a post to let you know that tonight’s MNF matchup between the 0-6 Giants and the 1-4 Vikings is, in fact, the worst ever this late in the season by combined winning percentage:

game_idhomeWLTPFPAroadWLTPFPAyear_idweek_numgame_datecomb_wpctcomb_pt_diffwinner
201310210nygnyg060103209min1401251582013710/21/2013.091-12.6NULL
197512150sdgsdg1110148282nyj39022137819751312/15/1975.167-12.1sdg, 24-16
199411210otioti190147218nyg37017122019941211/21/1994.200-6.0nyg, 13-10
197211060nwenwe25092220clt160941451972811/6/1972.214-12.8clt, 24-17
197011020pitpit2407194cin150931561970711/2/1970.250-7.2pit, 21-10
198110190detdet240118126chi150891331981710/19/1981.250-4.3det, 48-17
199710200cltclt06088155buf3301221591997810/20/1997.250-8.7buf, 9-6
201211260phiphi370162252car28018424320121211/26/2012.250-7.5car, 30-22
200001030atlatl4110251351sfo41102664191999171/3/2000.267-8.4atl, 34-29
200512190ravrav490171253gnb310025525520051512/19/2005.269-3.2rav, 48-3
198310240crdcrd250137218nyg2501261561983810/24/1983.286-7.9tie (20-20)
201112120seasea570216246ram210014029620111412/12/2011.292-7.8sea, 30-13
201011290crdcrd370188292sfo37016021920101211/29/2010.300-8.2sfo, 27-6
200911160clecle17078209rav44020615420091011/16/2009.313-4.9rav, 16-0
198011240nornor0110181341ram74029422819801211/24/1980.318-4.3ram, 27-7
201112050jaxjax380138200sdg47024927520111312/5/2011.318-4.0sdg, 38-14
198312120tamtam2120212345gnb77039640719831512/12/1983.321-5.1gnb, 12-9
198711020daldal330135134nyg150991421987711/2/1987.333-3.5dal, 33-24
199910250pitpit33011793atl150741531999710/25/1999.333-4.6pit, 13-9
200211180ramram450194196chi27018223220021111/18/2002.333-2.9ram, 21-16
200511210gnbgnb270201184min45015422820051111/21/2005.333-3.2min, 20-17
200012040nwenwe390192253kan57028327420001412/4/2000.333-2.2nwe, 30-24
200412130otioti480231294kan48034132620041412/13/2004.333-2.0kan, 49-38
200712100atlatl390171272nor57026627920071412/10/2007.333-4.8nor, 34-14
199112090miamia760256275cin211021137419911512/9/1991.346-7.0mia, 37-13
197311260sfosfo370180232gnb35213819819731111/26/1973.350-5.6sfo, 20-6
197811130cincin190110184rai64019316419781111/13/1978.350-2.3rai, 34-21
200711260pitpit730269145mia010018327420071211/26/2007.350+1.7pit, 3-0
199311290cltclt370154233sdg46016419519931311/29/1993.350-5.5sdg, 31-0
198010270nyjnyj160114164mia430991441980810/27/1980.357-6.8nyj, 17-14
199710270miamia520143124chi0701011991997910/27/1997.357-5.6chi, 36-33
199811020phiphi16079162dal4301741151998911/2/1998.357-1.7dal, 34-0
201211050nornor250190216phi3401201552012911/5/2012.357-4.4nor, 28-13
198311070detdet450202188nyg26116621419831011/7/1983.361-1.9det, 15-9
199111250ramram380181256sfo56021815519911311/25/1991.364-0.5sfo, 33-10
199211300seasea110073218den74017520719921311/30/1992.364-8.0sea, 16-13
200812010htxhtx470252293jax47022424020081312/1/2008.364-2.6htx, 30-17
197111150sdgsdg350150179crd3501351491971911/15/1971.375-2.7sdg, 20-17
197910290atlatl350160181sea3501721811979910/29/1979.375-1.9sea, 31-28
200611130carcar440137163tam26010217320061011/13/2006.375-6.1car, 24-10
200711120seasea440167141sfo26010418620071011/12/2007.375-3.5sea, 24-0
201211120pitpit530191164kan17013324020121011/12/2012.375-5.0pit, 16-13
199010290pitpit340109128ram2401641731990810/29/1990.385-2.2pit, 41-10
201212170otioti490271386nyj67024530620121512/17/2012.385-6.8oti, 14-10
197012070otioti371177249cle56023623619701212/7/1970.386-3.3cle, 21-10
197711210waswas540126132gnb2708315219771011/21/1977.389-4.2was, 10-9
200311170sfosfo450202152pit36017621720031111/17/2003.389+0.5sfo, 30-14
201011220sdgsdg450239197den36020325220101111/22/2010.389-0.4sdg, 35-14
199410170denden140108146kan32090801994710/17/1994.400-2.8kan, 31-28
199911290sfosfo370163281gnb55019220919991211/29/1999.400-6.8gnb, 20-3

It is not, however, the worst by combined PPG margin. That honor belongs to this 1972 game between the 2-5 Patriots and the 1-6 Colts (Baltimore ended up winning 24-17):

game_idhomeWLTPFPAroadWLTPFPAyear_idweek_numgame_datecomb_wpctcomb_pt_diffwinner
197211060nwenwe25092220clt160941451972811/6/1972.214-12.8clt, 24-17
201310210nygnyg060103209min1401251582013710/21/2013.091-12.6NULL
197512150sdgsdg1110148282nyj39022137819751312/15/1975.167-12.1sdg, 24-16
199710200cltclt06088155buf3301221591997810/20/1997.250-8.7buf, 9-6
200001030atlatl4110251351sfo41102664191999171/3/2000.267-8.4atl, 34-29
201011290crdcrd370188292sfo37016021920101211/29/2010.300-8.2sfo, 27-6
199211300seasea110073218den74017520719921311/30/1992.364-8.0sea, 16-13
198310240crdcrd250137218nyg2501261561983810/24/1983.286-7.9tie (20-20)
201112120seasea570216246ram210014029620111412/12/2011.292-7.8sea, 30-13
201211260phiphi370162252car28018424320121211/26/2012.250-7.5car, 30-22
197011020pitpit2407194cin150931561970711/2/1970.250-7.2pit, 21-10
199112090miamia760256275cin211021137419911512/9/1991.346-7.0mia, 37-13
198010270nyjnyj160114164mia430991441980810/27/1980.357-6.8nyj, 17-14
201212170otioti490271386nyj67024530620121512/17/2012.385-6.8oti, 14-10
199911290sfosfo370163281gnb55019220919991211/29/1999.400-6.8gnb, 20-3
197910150nyjnyj240128174min3301071421979710/15/1979.417-6.8nyj, 14-7
200611130carcar440137163tam26010217320061011/13/2006.375-6.1car, 24-10
199411210otioti190147218nyg37017122019941211/21/1994.200-6.0nyg, 13-10
200611060seasea430149177rai250921482006911/6/2006.429-6.0sea, 16-0
199710270miamia520143124chi0701011991997910/27/1997.357-5.6chi, 36-33
197311260sfosfo370180232gnb35213819819731111/26/1973.350-5.6sfo, 20-6
199311290cltclt370154233sdg46016419519931311/29/1993.350-5.5sdg, 31-0
198312120tamtam2120212345gnb77039640719831512/12/1983.321-5.1gnb, 12-9
201211120pitpit530191164kan17013324020121011/12/2012.375-5.0pit, 16-13
200911160clecle17078209rav44020615420091011/16/2009.313-4.9rav, 16-0
200712100atlatl390171272nor57026627920071412/10/2007.333-4.8nor, 34-14
199910250pitpit33011793atl150741531999710/25/1999.333-4.6pit, 13-9
201211050nornor250190216phi3401201552012911/5/2012.357-4.4nor, 28-13
198110190detdet240118126chi150891331981710/19/1981.250-4.3det, 48-17
198011240nornor0110181341ram74029422819801211/24/1980.318-4.3ram, 27-7
197711210waswas540126132gnb2708315219771011/21/1977.389-4.2was, 10-9
199510230nwenwe15069160buf510136951995810/23/1995.500-4.2nwe, 27-14
200611270seasea640203219gnb46018525220061211/27/2006.500-4.2sea, 34-24
201112050jaxjax380138200sdg47024927520111312/5/2011.318-4.0sdg, 38-14
200412060seasea650239223dal47019328920041312/6/2004.455-3.6dal, 43-39
198711020daldal330135134nyg150991421987711/2/1987.333-3.5dal, 33-24
200711120seasea440167141sfo26010418620071011/12/2007.375-3.5sea, 24-0
199010220clecle24098139cin4201541531990710/22/1990.500-3.3cin, 34-13
201110310kankan330105150sdg4201411362011810/31/2011.583-3.3kan, 23-20
197811060cltclt360120230was72018613519781011/6/1978.556-3.3clt, 21-17
200711190denden450153238oti63017815220071111/19/2007.556-3.3den, 34-20
197012070otioti371177249cle56023623619701212/7/1970.386-3.3cle, 21-10
200511210gnbgnb270201184min45015422820051111/21/2005.333-3.2min, 20-17
200512190ravrav490171253gnb310025525520051512/19/2005.269-3.2rav, 48-3
200512120atlatl750277237nor39018329520051412/12/2005.417-3.0atl, 36-17
200211180ramram450194196chi27018223220021111/18/2002.333-2.9ram, 21-16
199410170denden140108146kan32090801994710/17/1994.400-2.8kan, 31-28
197211130sdgsdg251152203cle5301411341972911/13/1972.469-2.8cle, 21-17
197710310crdcrd330124122nyg330911261977710/31/1977.500-2.8crd, 28-0
200512260nyjnyj3110189298nwe95032228920051612/26/2005.429-2.7nwe, 31-21
{ 9 comments }

On Tuesday, I look at the quarterbacks who have thrown the most pick sixes. As a follow-up, I wondered: what’s the record for pick sixes by a defensive player against a quarterback? Rod Woodson is the career leader in interception return scores with twelve, but only two of those came against the same quarerback (Steve McNair, thirteen years apart). As it turns out, there have been at least three defensive players who have scored interception returns against the same quarterback.


The first of three pick sixes.

The first of three pick sixes.

1) Ronde Barber vs. Donovan McNabb

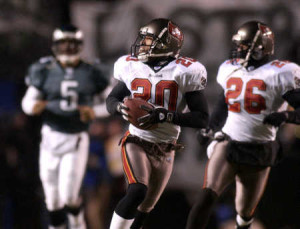
Perhaps the most famous play of Barber’s career was his 92-yard pick six to clinch the 2002 NFC Championship Game in Philadelphia. The Eagles, trailing by 10, had driven down to the Tampa Bay 10-yard line with just under four minutes left in the game.  But Barber fooled McNabb into an easy interception, and raced down the right sideline for the game-clinching score. That was the second turnover of the day for Barber, who forced a McNabb fumble on a sack in the third quarter.

In 2006, Barber took back two McNabb passes for touchdowns in a defensive battle in Tampa Bay. The first pick six produced the only points in the first half, while the second gave the Bucs a 17-0 lead. But McNabb responded with three touchdowns, with the final one coming on a 52-yard reception by Brian Westbrook with less than a minute remaining. That gave the Eagles a 21-20 lead, which would have held…. except Matt Bryant hit a 62-yard field goal as time expired to give Tampa Bay the win. Philadelphia won the total yards battle 506-196, marking just the fourth time a team gained over 500 yards, allowed fewer than 200 yards, and still lost.

2) Bobby Bell vs. Charley Johnson
[continue reading…]

{ 2 comments }

Most Pick Sixes Thrown in NFL History

To pick six, or not to pick six

To pick six, or not to pick six.

Three years ago to the day, I crunched the numbers to see which quarterbacks had thrown the most pick sixes thrown in NFL history. With three more years of data, a robust play-by-play database, and, ya know, Matt Schaub, I figured it was time for an update. In case you haven’t noticed, Schaub became the first player to ever throw pick sixes (picks six?) in four straight games, and then on Sunday, T.J. Yates got the Texans into the record books as Houston had an interception returned for a touchdown in five straight games. But I thought it would be fun to look at the career leaders in pick sixes (and remind you that I discussed the rising rate of interception scores in the offseason).

Nobody has exact pick six data available, but we can do a reasonably job of answering the question of who has had the most passes returned for touchdowns in league history. That’s because we have:

  • Scoring logs for all scores, showing all interceptions returned for a touchdown, dating back to 1940
  • Play-by-play logs for all players dating back to 1999. So we have all the information we need from that point through week six of the 2013 season.
  • Individual game logs for all players, showing all interceptions thrown dating back to 1960.

For all pick sixes thrown since 1999, we have the precise data.  For any game from 1960 to 1998, we can do a very good job approximating who threw the pick-six. Most of the time, only one quarterback will throw an interception in any given team game. Fifty years from now, if you look at this box score from week six, you will be able to know for sure that Peyton Manning threw the interception that Paul Posluszny returned for a touchdown. The Broncos threw just one interception, and it was by Manning, so Manning must have thrown the pick-six. It doesn’t matter if the team has thrown five interceptions, as long as all were thrown by the same guy, such as Keith Null against the Titans in 2009.

The problem games are the ones where multiple players, usually quarterbacks, threw interceptions. For example, the record for defensive interception returns for touchdowns in a game is four, set by the Seattle Seahawks in 1984 against Kansas City. If you look at the boxscore, you’ll see that Todd Blackledge threw three interceptions, Bill Kenney threw two, and Sandy Osiecki added a sixth. So what do we do? Award Blackledge 2 pick sixes, Kenney 1.33, and Osiecky 0.67; obviously this isn’t perfect, but over the course of a player’s career, I think this will work well as an approximation. Because I’m running low on time, I’m going to just ignore pre-1960 data, although you could piece it together at the old link since obviously nothing has changed.

The table below includes all players who threw at least five pick sixes since 1960. It includes all postseason data, and unsurprisingly, Brett Favre is the career leader. He threw 10,960 career passes (including the playoffs), so he only threw a pick six on 0.32% of his passes (the leader in that category is Chris Redman, who threw a pick six once every 100 passes). Favre threw 366 career interceptions (again, including the playoffs), so he threw a pick six on “only” 9.6% of his interceptions. If you’re curious, Aaron Rodgers has thrown just one pick six in his entire career. That gives him a rate 0.032 pick sixes per pass attempt, the lowest among all passes with 1500 attempts since 1960.
[continue reading…]

{ 9 comments }

Jets, Falcons pull off rare feat

Is a left-arm-only Geno better than Sanchez?

Next on First Take: Is a left arm only Geno better than Sanchez?

Under Mark Sanchez, the Jets were never very good at completing passes, because of, well, Mark Sanchez. The Jets ranked 29th, 30th, 24th, and 30th from 2009 to 2012 in completion percentage. Over that four year period, no team completed fewer passes (1,080) or had a lower completion percentage (55.2%) than the Jets. But as bad as the Jets offense has been at completing passes, the defense was even more extreme at preventing completions. Over the last four full years, the top two single seasons in completion percentage allowed were recorded by the ’09 and ’10 Jets. The 2011 Jets ranked 4th in completion percentage allowed, while last year’s team ranked second. From 2009 to 2012, no team allowed fewer completions (1,069) or at a lower rate (52.6%) than the Jets. In fact, the 2nd best team at completion percentage allowed over that period, the Packers at 56.9%, were closer to the 18th best team in opponent’s completion percentage than they were to the Jets.

If you average the completion percentages of the Jets and their opponents over that four year period, you get an average completion percentage in Jets games of 53.8%, easily the lowest rate in the league (Arizona, Kansas City, and Oakland are next at 57.6, 57.7, and 57.7%).

Under Geno Smith and without Darrelle Revis, things hadn’t changed much.  Through four weeks, the Jets defense ranked — you guessed it, 1st in completion percentage allowed at 51.4%, while the Jets offense ranked 26th in completion percentage.

Switching gears for a second, only three games in NFL history had ever seen both teams complete 80% of their passes in a single game. What were the odds, then, that the 2013 Jets would be involved in the fourth such game? I have no idea, but I know they were really, really, really low. Yet on Monday Night against the Falcons, that’s exactly what happened.
[continue reading…]

{ 6 comments }

Jacksonville at Denver: A “Preview”

Through five weeks, the Jaguars have been the worst team in the league and the Broncos have been the best. One could also argue that these two teams are even more extreme than the typical worst/best teams in the league, and that Denver has a larger home field advantage than your typical team. In other words, this is as large of a mismatch as we could possibly create, which jives with the historically large points spread of 28 points.

The situation is only getting uglier in Jacksonville. Blaine Gabbert continues to look like one of the worst quarterbacks to ever start 25 games in NFL history, so perhaps it’s good news that a hamstring injury will force Chad Henne into the starting lineup. And a few days after trading left tackle Eugene Monroe, 2nd overall pick Luke Joeckel went down with fractured ankle and is now lost for the season. Meanwhile, Peyton Manning and the Broncos offense look unstoppable.

I thought it would be fun to look at other times where the best and worst teams played each other. I’m going to define “best” and “worst” as the first- and last-placed teams according to the Simple Rating System, which means we’re actually going to have the benefit of hindsight here (i.e., we’ll be looking at the best/worst teams from the entire season, not as of the time when those two teams played). Since 1970, the best and worst teams have faced each other a total of 21 times, with the best team owning a perfect record.

YearTeamOppBoxscoreQBOpp QBH/RspreadPFPAMarg
2011NORIND10/23/2011Drew BreesCurtis PainterHome-1462755
2005INDSFO10/09/2005Peyton ManningAlex SmithRoad-1428325
2004NWESFO01/02/2005Tom BradyKen DorseyHome-1321714
1999STLCLE10/24/1999Kurt WarnerTim CouchHome-18.534331
1997DENSDG12/21/1997John ElwayCraig WhelihanHome-1338335
1997DENSDG11/30/1997John ElwayCraig WhelihanRoad-8.5382810
1992SFONWE10/11/1992Steve YoungHugh MillenRoad-17.5241212
1990BUFNWE11/18/1990Jim KellyMarc WilsonHome-1514014
1990BUFNWE10/28/1990Jim KellySteve GroganRoad-6271017
1989SFODAL10/15/1989Steve YoungSteve WalshRoad-14.5311417
1987SFOATL10/11/1987Joe MontanaJeff Van RaaphorstRoad-2325178
1987SFOATL12/20/1987Steve YoungChris MillerHome-1635728
1981PHIBAL11/15/1981Ron JaworskiBert JonesHome-14381325
1980PHINOR11/09/1980Ron JaworskiArchie ManningRoad-9342113
1976PITTAM12/05/1976Mike KruczekTerry HanrattyHome-2642042
1973RAMHOU10/07/1973John HadlDan PastoriniRoad031265
1972MIANWE11/12/1972Earl MorrallJim PlunkettHome052052
1972MIANWE12/03/1972Earl MorrallJim PlunkettRoad0372116
1971BALBUF10/10/1971Earl MorrallDennis ShawRoad043043
1971BALBUF12/05/1971Johnny UnitasDennis ShawHome024024
1970MINBOS12/13/1970Bob LeeJoe KappRoad0351421

In the ten times the best team in the league hosted the worst team in the league, the average score was 36-4. In the eight of those games where we have a points spread, the best team was favored by an average of 16.2 points. Let’s walk down memory lane.

2011: Saints 62, Colts 7 – Boxscore

True to form, this game featured the highest Game Script of any game from the 2011 season. The Saints held an average lead of 29.5 points in a game unfortunately placed in prime time. NBC was hoping for stories about Peyton Manning going home to New Orleans; instead, we watched Curtis Painter’s Colts fall behind 28-0 in the game’s first 20 minutes. The loss dropped the Colts to 0-7, and Indianapolis would start 0-13 before finishing 2-14. After being forced to deal with a full season of non-elite quarterback play, the football gods provided Andrew Luck to the city of Indianapolis a few months later. The Saints went 13-3 in 2011, and Drew Brees set the record for passing yards in a season, en route to winning the AP Offensive Player of the Year award.
[continue reading…]

{ 21 comments }

Receiving WOWY Extended Back to 1950

A WOWY Superstar.

A WOWY Superstar.

Last week, we announced that our True Receiving Yards metric has now been calculated back to 1950, so it’s only fitting that we also compute WOWY (With Or Without You) for all of those receivers as well.

Skip the paragraph after this if you don’t care about the gory mathematical details, and just know that WOWY basically answers the question: “Did a receiver’s quarterbacks play better when they threw a lot to him, or not?”

For the brave souls who care about the calculation: WOWY starts by measuring the difference between a QB’s age-adjusted Relative Adjusted Net Yards Per Attempt in a given season and his combined age-adjusted RANY/A in every other season of his career. This is computed as an average for each team’s QB corps, using a combination of QB dropbacks during the season in question and the rest of his career as the weights (the exact formula is: weight = 1/(1/drpbk_year + 1/drpbk_other)). Finally, for each receiver we compute a weighted career average of the QB WOWY scores for the teams he played on, weighted by his True Receiving Yards in each season.

At any rate, the only players who don’t get a WOWY are those who either debuted before 1950, played with a QB who debuted before 1950, or played with a QB who ever threw to a receiver who debuted before 1950. Here are the career WOWY marks (when applicable), alongside TRY, for every 3,000-TRY receiver whose career started in 1950 or later:

[continue reading…]

{ 8 comments }

Brady needs to channel another Tom (Flores) this season

Brady needs to channel another Tom (Flores) this season

As Jason Lisk and I wrote about before the season, Tom Brady and Ben Roethlisberger have become something of the poster children so far this year when it comes to veteran QBs working with inexperienced and otherwise less-than-notable receiving groups. And, lo and behold, each has put up career-low RANY/A marks through 2 games. But how do their receiving corps rank relative to those of other teams so far this year, and how do they stack up historically?

To take a stab at answering these questions, I turned to True Receiving Yards. For each player who debuted in 1950 or later, I computed their Weighted Career True Receiving Yards for every year, as of the previous season, to get a sense of how experienced/accomplished they’d been going into the season in question. Then, I calculated a weighted averaged of those numbers for every receiver on a given team, using TRY during the season in question as the weights. For example, here are the 2013 Patriots receivers:

PlayerAgeDebutTRY% of TmAt-the-time WCTRY
Julian Edelman27200913938%615.7
Danny Amendola2820097220%1541.9
Kenbrell Thompkins2520135615%0.0
Shane Vereen2420114412%110.9
Aaron Dobson2220134312%0.0
Michael Hoomanawanui25201051%278.8
James Develin25201341%0.0
Weighted Average560.7

The way to read that is: Julian Edelman has accounted for 38 percent of the Pats’ TRY so far. Going into the season, he had a career Weighted TRY of 615.7, so he contributes to 38% of the 2013 Pats’ weighted average with his 615.7 previous career weighted TRY; Danny Amendola contributes to 20% of the team weighted average with his 1541.9 previous career weighted TRY; etc. Multiply each guy’s previous weighted career TRYs by the percentage of the team’s 2013 TRY he contributed, and you get a cumulative weighted average of 560.7 — meaning the average TRY of a 2013 Pats receiver has been gained by a guy who had a previous career weighted TRY of 560.7.

Is that a low number? Well, here are the numbers for all of the 2013 team receiving corps (not including Thursday night’s Eagles-Chiefs tilt), inversely sorted by weighted average (asterisks indicate rookies):

[continue reading…]

{ 3 comments }

This guy was pretty good.

This guy was pretty good.

About a month ago, Chase & I developed a stat called True Receiving Yards, which seeks to put all modern & historical receiving seasons on equal footing by adjusting for the league’s passing YPG environment & schedule length, plus the amount the player’s team passed (it’s easier to produce raw receiving stats on a team that throws a lot), with bonuses thrown in for touchdowns and receptions. It’s not perfect — what single stat in a sport with so many moving parts is? — but it does a pretty good job of measuring receiving productivity across different seasons and across teams with passing games that operated at vastly different volumes.

Anyway, today’s post is basically a data dump to let everyone know we’ve extended TRY data back to 1950 (before, it was only computed for post-merger seasons). Here are the new all-time career leaders among players who debuted in 1950 or later (see below for a key to the column abbreviations):
[continue reading…]

{ 13 comments }

What the Week 1 Passing Records Mean for 2013

In week 1, records were set for the most passing touchdowns (63) and team passing yards (8143) thrown in a single week in league history. Is this a sign that 2013 will represent the next stage in the evolution in the passing game, or are offenses typically ahead of defenses early on?

To compare week 1 of this season to other weeks in NFL history, we need to examine all statistics on a per team game basis to account for bye weeks and number of teams. But after calculating the per team game numbers, I multiplied the result by 32 to make the numbers easier to digest. The first graph shows the average number of passing touchdowns in week N of each season since 1970. As you can see, week 1 doesn’t stand out as typically being passer-friendly. On average, there were roughly 41.5 touchdowns per team game (after multiplying by 32) in week 1 of each season from 1970 to 2012, which is nearly identical to the average (40.9) the rest of the year:

[continue reading…]

{ 1 comment }

The Ebb and Flow of the NFL Passing Game Since 1932

One of the two greatest quarterbacks of the first half of the 20th century

One of the two greatest quarterbacks of the first half of the 20th century.

The game played by Peyton Manning and Joe Flacco last night bears little resemblance to the game Sammy Baugh played. Teams pass much more frequently and efficiently than ever before. And there are external effects, too: In 2011 and 2012, the average carry went for 4.3 yards, the first two years the average has ever been so high. But the details are often lost when discussing how the game has changed, and today’s post will help to refine exactly how, and in what way, the game has changed.

Nine men have thrown for 4,900 passing yards in a season. Seven of them did so in either 2011 or 2012. How did we get here? The NFL has turned into a pass-heavy league, but these changes didn’t happen overnight: a series of rules changes since the berth of the league have promoted the pass-happy environment we see today. The first ever playoff game came in 1932, pitting the Chicago Bears against the Portsmouth Spartans, predecessors of today’s Detroit Lions. The game was scoreless until the fourth quarter, when Bronko Nagurski threw a controversial pass to Red Grange for the game-winning touchdown. The pass was controversial because in 1932, a player needed to be at least five yards behind the line of scrimmage in order to be eligible to pass. The league eliminated the rule after the game [1]There must be an inverse relationship between passing prowess and rule volatility, since it took the NFL twelve years to get rid of the Tuck Rule., allowing quarterbacks and other passers to be able to pass from anywhere behind the of scrimmage.

In 1934, a slimmer and more aerodynamic football was introduced to make life easier for quarterbacks. In the 1940s, most teams switched from the single-wing to the T-Formation, which placed the quarterback in the center of the offense and helped promote the passing game. Sammy Baugh in Washington and Sid Luckman in Chicago dominated the league, and the Redskins or Bears won the title every year from 1940 to 1943. During World War II, every franchise was playing with depleted rosters, so the league experimented with a rule change that would permit liberal substitutions. Finally, in 1950, the league finally decided to go with free substitution rules on a permanent basis. As pro football historian Sean Lahman explains:

For the NFL’s first three decades, versatility was the most important trait for a player. Your starting quarterback had to be quick enough to play safety, your running backs tough enough to play linebacker. The downside to this approach was that a player with one specific skill – say blazing speed – might not be enough of an all-around player to crack the starting lineup. With free substitution legalized, specialization became the norm…. Free substitution helped the passing game immensely because it allowed coaches to use quick players at offensive end who weren’t big enough to play defense. Their speed could be used as a weapon, and many teams moved to formations that featured three ends and just two backs.

The changes produced immediate results, and by 1954, the passing game had exploded. For the first time in league history, the league average completion percentage topped fifty-percent, and the average pass attempt gained 7.2 yards. By point of reference, teams averaged 7.1 yards per pass attempt in 2012.
[continue reading…]

References

References
1 There must be an inverse relationship between passing prowess and rule volatility, since it took the NFL twelve years to get rid of the Tuck Rule.
{ 25 comments }

Straight cash, homey.

Straight cash, homey.

In 1998, 21-year-old Randy Moss made a stunning NFL debut, racking up 17 touchdowns and 1,260 True Receiving Yards, the 2nd-best total in football that season. The Vikings’ primary quarterback that year, Randall Cunningham, was a former Pro Bowler and MVP, but all that seemed like a lifetime ago before the ’98 season. He’d been out of football entirely in 1996, and in 1997 he posted an Adjusted Net Yards per Attempt average that was 1.2 points below the league’s average (for reference’s sake, replacement level is usually around 0.75 below average). With Moss in ’98, though, Cunningham’s passing efficiency numbers exploded: he posted a career best +3.2 Relative Adjusted Net Yards per Attempt, miles ahead of his perfectly-average overall career mark. If we adjust for the fact that Cunningham was also 35 at the time (an age at which quarterbacks’ RANY/A rates tend to be 1.1 points below what they are at age 27), Cunningham’s 1998 rate was actually 4.3 points better than we’d expect from the rest of his career, a staggering outlier.

The following year, Jeff George took over as the Vikings primary quarterback, and he promptly posted a Relative ANY/A 2.2 points higher than expected based on his age and the rest of his career. [1]Cunningham’s RANY/A was also 1.0 better than expected in limited action. George left Moss and Minnesota after the season, and he would throw only 236 passes the rest of his career, producing a cumulative -0.6 RANY/A in Washington before retiring.

From 2000-04, Moss was the primary target of Daunte Culpepper, whose RANY/A was 0.7 better than expected (based on Culpepper’s career numbers) when Moss was around. [2]That number is an average weighted by the number of TRY Moss had in each season Although he’d enjoyed one of the best quarterback seasons in NFL history in 2004, Culpepper was never the same after Moss was traded to Oakland; in fact, he never even had another league-average passing season, producing a horrible -1.2 RANY/A from 2005 until his retirement in 2009. [3]To be fair, Culpepper tore his ACL, MCL, and PCL halfway through the 2005 season, which also was a factor in his decline.

Moss’s stint with the Raiders was famously checkered — although Kerry Collins’ RANY/A was 0.6 better than expected in 2005, Aaron Brooks played 2.5 points of RANY/A below his previous standards in 2006 — but we all know what happened when he joined the Patriots in 2007. With Moss, Tom Brady’s RANY/A was a whopping 1.3 points higher than expected from the rest of his career, and Moss also played a big role in Matt Cassel’s RANY/A being +1.0 relative to expectations after Brady was lost for the season in 2008.

While Moss’s post-Pats career hasn’t exactly been the stuff of legends, the majority of his career (weighted by True Receiving Yards) saw him dramatically improve his quarterbacks’ play relative to the rest of their careers. In fact, his lifetime WOWY (With or Without You) mark of +1.1 age-adjusted RANY/A ranks 3rd among all receivers who: a) had at least 3,000 career TRY, b) started their careers after the merger, and c) played exclusively with quarterbacks who started their careers after the merger. And the first two names on the list are possibly explained by other means. The table below lists all 301 receivers with 3,000 career TRY. The table is fully sortable and searchable, and you can click on the arrows at the bottom of the table to scroll. The table is sorted by the QB WOWY column.
[continue reading…]

References

References
1 Cunningham’s RANY/A was also 1.0 better than expected in limited action.
2 That number is an average weighted by the number of TRY Moss had in each season
3 To be fair, Culpepper tore his ACL, MCL, and PCL halfway through the 2005 season, which also was a factor in his decline.
{ 7 comments }

Emerging From the Shadows

In 2008, the tightest division in college football was the ACC Atlantic. All six teams finished either 5-3 or 4-4. Boston College started 2-3 in conference play, but won the division after winning at Florida State, at Wake Forest, and against Maryland in the last three weeks of the regular season. The Eagles were not a very talented team; this was the year after Matt Ryan left for the draft, and the offense underwhelmed in his absence. As you can probably guess, it was the team’s defense that guided them to the ACC Championship Game:

Boston College did not have good quarterback play, but made up for decreased offensive production with a top-notch defense, whose three shutouts tied U.S.C. for the most in the F.B.S. All told, the 2008 B.C. defense ranked among the best in program history, ranking in the top 10 nationally in total defense (fifth), rush defense (seventh), pass efficiency (seventh), first downs allowed (sixth) and interceptions (first). It carried the team through the travails of an often average offense.

And there was no question who was the star of the 2008 Eagles defense: junior linebacker Mark Herzlich. After such a dominant season, he could have declared for the draft and been a first round pick; instead, Herzlich chose to return for his senior season. Then, tragedy stuck in mid-May: Herzlich was diagnosed with Ewing’s Sarcoma, a malignant tumor usually discovered in bone or soft tissue. Here was Matt Hinton’s article after hearing the news:

Even for relatively diehard fans, it might have been possible to get through the last couple seasons knowing Mark Herzlich only as “the guy with the crazy facepaint,” but that would be missing the lead: The 6’4″, 240-pound Boston College linebacker was the defensive player of the year in a conference that had six defenders picked in the first two rounds [1]The list: Raji, Aaron Curry, Alphonso Smith, Ron Brace, Clint Sintim, and Everette Brown. of this year’s draft, and might have joined teammate B.J. Raji in the top-10 if he hadn’t decided to come back for his senior season at B.C.

And here was how Paul Myerberg described Herzlich in the summer of 2009:

His accolades are numerous: 2008 A.C.C. defensive player of the year, Butkus Award finalist, first-team all-A.C.C. and third-team all-American; these awards come as a result of his team-leading 110 tackles (13 for loss), 3 sacks, 6 interceptions and 8 pass breakups. As great an all-around linebacker as you’ll find on the F.B.S. level, Herzlich will be sorely missed on the field and in the locker room.

[continue reading…]

References

{ 1 comment }
Picture1

The consensus view on John Elway is clear. He was the greatest draft prospect ever, a league MVP, a two-time Super Bowl champion, a Hall of Famer, and one of the most clutch quarterbacks in football history.

But that’s not necessarily what the numbers say. In my quarterback ranking system, which rewards efficiency and longevity and adjusts for era, Elway only ranked as the 26th best regular-season quarterback of all time. If you’re so inclined, it’s not hard to find the numbers to argue that Elway – at least until Mike Shanahan returned to Denver as head coach in 1995 — was overrated. Consider:

  • Over the first 10 years of his career, Elway threw 158 touchdowns and 157 interceptions.
  • Elway never led the NFL in passer rating, completion percentage, touchdowns, yards per attempt, or Adjusted Net Yards per Attempt. Elway didn’t finish in the top ten in passer rating until his eleventh season in the league. In Net Yards per Attempt, Elway ranked in the top 10 just once from 1983 to 1994 (a first-place finish in ’87); in ANY/A, Elway’s only top ten finishes during his first ten seasons were in ’86 (10th) and ’87 (4th).
  • Elway ranks fourth all-time in passing yards, but that’s because he ranks fourth in career pass attempts. While he led the NFL in passing yards in 1993, Elway only finished in the top five in passing yards four times in his career: 1985 (2nd), 1987 (4th), 1990 (5th), and 1995 (5th).
  • Elway ranked 2nd in passing touchdowns in 1993, the only time he finished in the top 5 in that metric from 1983 to 1995. Despite throwing the fourth most pass attempts in NFL history, he ranks only 7th in passing touchdowns. In eight of sixteen seasons, including seven of his first ten years, Elway produced a below-average touchdown rate.

Here’s another interesting stat: from 1983 to 1992, the Broncos were slightly better on defense than offense. Over that time period, Denver’s Offensive SRS average was +1.01 while their Defensive SRS was +1.32. On average, the Broncos ranked 12th in points scored and 11th in points allowed. Those Denver teams are remembered as Elway’s teams — and perhaps rightly so — but the defense was just as valuable as the offense. [1]On the other hand, it’s worth pointing out that the ’83-’92 Broncos won more games than their Pythagorean record would have predicted, so perhaps Elway was responsible for more wins … Continue reading
[continue reading…]

References

References
1 On the other hand, it’s worth pointing out that the ’83-’92 Broncos won more games than their Pythagorean record would have predicted, so perhaps Elway was responsible for more wins than his passing numbers would indicate.
{ 99 comments }

Will the read option come to Oakland?

Will the read option come to Oakland?

The 2012 Raiders weren’t very good. Oakland finished last season 4-12, with the third-worst SRS rating (-10.8) in the NFL. And the outlook isn’t any better for 2013, either. Oakland has fifty million dollars of dead cap space; as a result, the players on the current roster cost the team only 67 million salary cap dollars, nearly $30M less than the next-lowest team. According to Pro Football Focus, Oakland’s five best defensive players last season were Lamarr Houston, Desmond Bryant, Philip Wheeler, Richard Seymour, and Rolando McClain. Only Houston returns in 2013, as Bryant is in Cleveland, Wheeler signed with the Dolphins, Seymour remains a free agent, and McClain has gracefully retired.

The team’s top two offensive players in 2012 were left tackle Jared Veldheer and quarterback Carson Palmer. Palmer is now in Arizona, while Veldheer is out indefinitely with a torn triceps. Brandon Myers (Giants) and Darrius Heyward-Bey (Colts) are also gone, and they combined for 29 starts last season. The big free agent signings were S Charles Woodson (Green Bay), LB Kevin Burnett (Miami), QB Matt Flynn (Seattle), CB Mike Jenkins (Dallas), CB Tracy Porter (Denver).

As a result, there’s little optimism in Oakland entering the season. The Raiders are one of the favorites to land the first pick in the 2014 draft, so the 2013 season will likely be used to see what building blocks actually exist in Oakland. After Terrelle Pryor outplayed Flynn in the preseason, many now think the Raiders going to start Pryor in week 1 because, well, why not? If that’s the case, we’ll have another example to test out a theory that’s widely-accepted by conventional analysts.
[continue reading…]

{ 5 comments }

Leader in Fu Manchus among active quarterbacks (sorry, Mark)

Leader in Fu Manchus among active quarterbacks (sorry, Mark).

Let’s be honest: we all know Aaron Rodgers is great, so we don’t spend much time talking about him. Debating his ability is pointless, so we instead spend countless hours discussing Tony Romo’s intangibles, Tim Tebow’s throwing motion, Colin Kaepernick’s tattoos, and Joe Flacco’s eliteness. Talk radio dies when it discusses Aaron Rodgers: debating the Packers quarterback is as fun as watching paint dry and as illuminating as asking if water is wet.

But we’re doing a disservice to us all when we ignore how great Rodgers is. I mean, we spend lots of time chronicling the feats of Adrian Peterson and Calvin Johnson — why not Rodgers?

One way to measure Rodgers’ greatness is to look at passer rating. Now we know that passer rating is wildly overrated, so perhaps you shouldn’t be too impressed to hear that Rodgers has the highest passer rating in history. But consider: Rodgers has a career 104.9 passer rating, well ahead of Steve Young, who is second at 96.8. Chad Pennington sits at #13 on the career passer rating list (an example of why this metric is one I don’t use), but Young is closer to Pennington (90.1) than he is to Rodgers. But there’s an even better way to show Rodgers’ dominance in this statistic.

Passer rating is made up of four metrics. Let’s take a look at how Rodgers ranks in those four categories:
[continue reading…]

{ 40 comments }

Roethlisberger will be without his best targets this year.

Roethlisberger will be without his best targets this year.

While the state of the Steelers’ receiving corps isn’t as shaky as say, that of the New England Patriots, it could certainly be called an area of potential concern for Ben Roethlisberger and the Pittsburgh offense going into 2013. One of the biggest moves on the first day of free agency involved Mike Wallace departing for Miami; meanwhile, Heath Miller’s injury status — while more encouraging than previously thought — will cost him several games, and probably some effectiveness when he does eventually return. All of this comes on the heels of losing stealth HoFer Hines Ward (albeit an older, drastically less effective version) to retirement after the 2011 season.

For Roethlisberger, this downturn in the quality of his receivers is a pretty new phenomenon. In fact, by one measure of career receiving-corps talent (which I’ll explain below), Big Ben has been blessed with the fourth-most gifted receiving group among current starting quarterbacks with more than two years of experience (behind only Peyton Manning, Matt Ryan, and Tony Romo). In fact, Roethlisberger’s 16th-ranked receiving corps in 2012 was by far the least talented group of pass catchers he’s ever had to throw to.

How do you begin to measure the quality of a quarterback’s receiving corps, you ask? Well, pretty much any method is going to fraught with circular logic, especially if a quarterback consistently has the same receivers over several years. His successes are theirs, and vice-versa. However, here’s one stab at shedding at least some light on the issue.

For each team since the NFL-AFL merger, I:

  • Gathered all players with at least 1 catch for the team in the season.
  • Computed their True Receiving Yards in that season; I then determined what percentage of the team’s True Receiving Yards was accumulated by which receiver in each year. For example, Hines Ward had 1,029 TRY in 2009, which represented 25.9% of the 3,979 True Receiving Yards accumulated by all Steelers that year
  • Figured out the most TRY they ever had in a season, a number I’m calling each player’s peak TRY; for Ward, his peak TRY is equal to 1,279.
  • Calculated a weighted average (based on the percentage of team TRY gained by each receiver) of the receivers’ peak TRY (weighted by their TRY during the season in question).

(I also threw out all teams that had a receiver who debuted before 1970, since I don’t know what the real peak TRY of any pre-merger receiver was. I should eventually calculate TRY for pre-merger seasons, of course — thank you Chase & Don Maynard.)

As an example, here are the 2009 Steelers, the most talented corps of receivers Roethlisberger has had in his career:
[continue reading…]

{ 4 comments }
Next Posts Previous Posts