≡ Menu

Over at Footballguys.com, I analyzed how the fantasy value of quarterbacks, running backs, wide receivers, and tight ends have changed since 1990. The NFL is a very different beast than it was 23 years ago, but you might be surprised to see what that means for fantasy football. To measure value, I examined the VBD curves for each of the four major positions in fantasy football.

For those unfamiliar with VBD, you can read Joe Bryant’s landmark article here. The guiding principle is that the value of a player is determined not by the number of points he scores but by how much he outscores his peers at his particular position. This means that in a league that starts 12 quarterbacks, each quarterback’s VBD score is the difference between his fantasy points and the fantasy points scored by the 12th best quarterback. The cut-offs at the other positions are 12, 24, and 36, for tight ends, running backs, and wide receivers, respectively.

The NFL in 2013 won’t closely resemble how the league looked in 1990, but what does that mean for fantasy football? To determine that, we need to see if VBD has evolved with the rest of the football statistics. Let’s start with a graph displaying number of fantasy points scored by the last starter at each position since 1990. As you can see, quarterback scoring has risen significantly over the last two decades, and the production of the 12th tight end has nearly doubled over that time period.

Worst Starter Since 1990

You can see the full article here.
{ 4 comments }

Green Bay didn’t use a first round pick on a running back, but the Packers did spend a second round pick on Alabama’s Eddie Lacy and a fourth round pick on UCLA’s Johnathan Franklin.  How much weight should we put on draft status when one team drafts two running backs just a couple of rounds apart?  One school of thought is that the Packers liked both players and are maximizing their odds of finding a star; another is that Green Bay prefers Lacy and wants him to win the job, since he was their first choice.  Here’s another thing to consider, courtesy of my good buddy Sigmund Bloom: the Packers traded down to grab Lacy and traded up to draft Franklin, indicating that perhaps the Packers were higher on Franklin than you might think.

How rare is it for teams to double dip at the running back position like this? That depends on how you want to categorize what the Packers did. I think a reasonable comparison would be to look at all teams that:

  • Did not draft a running back in the first round but drafted one in the second or third rounds (this excludes combinations like Stepfan Taylor and Andre Ellington); and
  • Then drafted a different running back within the next two rounds

Since 1970, only 34 teams have met those criteria, meaning this is a strategy employed roughly three times every four years. In three instances, a team drafted three running backs that met those two criteria, and we’ll deal with them at the end of this post. I’m going to exclude three teams that drafted fullbacks after selecting halfbacks, as the 2008 Lions (drafted Jerome Felton after Kevin Smith), 2003 Ravens (Ovie Mughelli after Musa Smith), and 1999 Dolphins (Rob Konrad after J.J. Johnson) don’t really fit the intent of the post. That leaves us with 28 pairs of running backs. The table below lists each pair. On the left, you will see the first running back drafted, his round and overall pick, his rookie rushing yards, his rookie fantasy points total (using 0.5 points per reception), and his career rushing yards; on the right, the same information is presented for the second running back drafted. The far right column shows the difference between the two players in terms of fantasy points during their rookie year. For example, Stevan Ridley scored 41 more points than Shane Vereen in 2011, even though the Patriots drafted Vereen first.
[continue reading…]

{ 4 comments }

The Saints would dig Football Perspective

The Saints would dig Football Perspective.

Last week, Chase had a great post where he looked at what percentage of the points scored by a team in any given game is a function of the team, and what percentage is a function of the opponent. The answer, according to Chase’s method, was 58 percent for the offense and 42 percent for the defense (note that, in the context of posts like these, “offense” means “scoring ability, including defensive & special-teams scores”, and “defense” means “the ability to prevent the opponent from scoring”). Today I’m going to use a handy R extension to look at Chase’s question from a slightly different perspective, and see if it corroborates what he found.

My premise begins with every regular-season game played in the NFL since 1978. Why 1978? I’d love to tell you it was because that was the year the modern game truly emerged thanks to the liberalization of passing rules (which, incidentally, is true), but really it was because that was the most convenient dataset I had on hand with which to run this kind of study. Anyway, I took all of those games, and specifically focused on the number of points scored by each team in each game. I also came armed with offensive and defensive team SRS ratings for every season, which give me a good sense of the quality of both the team’s offense and their opponent’s defense in any given matchup.

If you know anything about me, you probably guessed that I want to run a regression here. My dependent variable is going to be the number of points scored by a team in a game, but I can’t just use raw SRS ratings as the independent variables. I need to add them to the league’s average number of points per game during the season in question to account for changing league PPG conditions, lest I falsely attribute some of the variation in scoring to the wrong side of the ball simply due to a change in scoring environment. This means for a given game, I now have the actual number points scored by a team, the number of points they’d be expected to score against an average team according to SRS, and the number of points their opponents would be expected to allow vs. an average team according to SRS.
[continue reading…]

{ 2 comments }

Oklahoma tries, fails to stop Tavon Austin

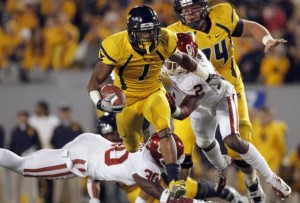
Oklahoma tries, fails to stop Tavon Austin.

It’s become trendy in recent weeks to discuss how players like Tavon Austin are “changing the game,” after the success of multi-dimensional athletes like Percy Harvin, Darren Sproles, Randall Cobb, and Aaron Hernandez. Many football analysts have described these players as the next phase in the evolution of the game; for example, here’s what Greg Cosell wrote earlier this week:

I wrote about the Seattle Seahawks a number of weeks ago, specifically relating to the trade for Percy Harvin. I made the point that Seattle did not acquire Harvin solely to line him up at wide receiver. He will be so much more than that. He will align everywhere in the formation, the ultimate chess piece that can attack from anywhere on the board. Just like Cobb in Green Bay and Hernandez in New England. This is the light bulb moment. That’s exactly what Austin should be in the NFL. Those who see him solely as a slot receiver are stuck in conventional thinking, and missing the larger, more expansive point. Austin is not a static, inert player. He’s a movement player, a peripatetic ball of energy that creates all kinds of matchup issues for defenses.

I believe Austin, Hernandez, Cobb and Harvin are representative of where NFL teams would like to go with their personnel, and their passing concepts. The objective is to have five receivers, and certainly four, who can align all over the formation. Traditionally, they can be wide receivers, tight ends or running backs. It can be the Patriots with their “12” personnel. Or the Packers, with their four-wide receiver personnel. From a schematic perspective, it doesn’t matter how you define them by position. The overriding, and superseding point is that they are all movable chess pieces, all “Jokers”, to use the term that I’ve used before and I think is aptly descriptive. That’s the “Cosell Doctrine”, and that’s the direction I see the NFL game trending. It’s about passing, and how you can create, and ultimately dictate favorable matchups. You do that with players that are amorphous and fluid in their ability to be utilized in ways both multiple and expansive, yet somewhat unstructured based on conventional definitions.

[continue reading…]

{ 4 comments }

Forgotten Stars: Hugh Taylor

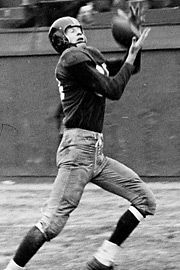
Bones stretches for a touchdown

Bones stretches for a touchdown.

Only three players in NFL history have been responsible for half of their team’s receiving touchdowns over a six-year period: Don Hutson, Jerry Rice, and Hugh Taylor. You probably don’t know much about Taylor, the Washington Redskins star receiver who played from 1947 to 1954. In his first game in the NFL, he caught 8 passes for 212 yards and 3 touchdowns, giving him the record for receiving yards in a player’s first game that stood until 2003.  In his last game, he caught five passes for 106 yards and three touchdowns.  In between those games, he was a star receiver on one of the worst teams in the NFL.  Despite the short career, Taylor came in at #63 on my list of the best receivers of all time. His most impressive season came in 1952, when he was responsible for 45% of the Redskins’ receiving yards and produced the 52nd-best season ever by a wide receiver.

At 6’4, Taylor was one of the tallest receivers of his era, but at only 194 pounds, he was also very deserving of his nickname: Bones. Taylor made up for his skinny physique with a long stride that enabled him to get behind defenders.  I spoke with T.J. Troup, an NFL historian who has coached wide receivers at the college and high school levels, for his thoughts on Taylor. Troup owns a significant amount of NFL film from the late ’40s and ’50s, making him the perfect source for this subject.  He described Taylor to me as one of the best home-run threats of his day, with a playing style similar to other long-striders like Harlon Hill, Don Maynard, and Lance Alworth. The numbers certainly back that up.

The table below shows all receivers who were responsible for at least 39% of a team’s receiving touchdowns over a six-year period.  Note that several receivers would show up multiple times on this list, so for players like Hutson, I’ve limited them to their single best six-year stretch. Taylor’s stretch from ’49 to ’54 ranks second on the list:

[continue reading…]

{ 9 comments }

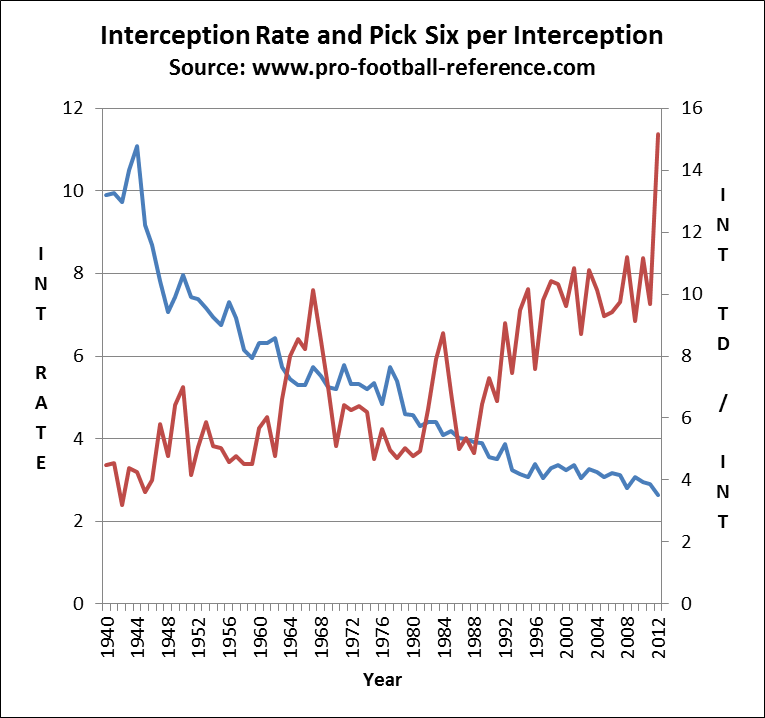
Good bit of trivia from my buddy Scott Kacsmar: there were 71 interceptions returned for touchdowns in 2012, the highest number in NFL history. Another interesting fact about the 2012 season: just 2.6 interceptions were thrown per 100 attempts, the lowest figure in NFL history.

We already know that the league-wide interception rate has been rapidly decreasing for years, but the significant increase in interceptions returned for touchdowns per interception is an under-reported story. Last year was the year of the Pick Six, but the Pick Six rate (INTs returned for touchdowns per interception) has been on the rise for several years. The graph below shows both the interception rate (100*INTs/Att) in blue (and measured against the left vertical axis) and the Pick Six rate (100*INT TDs/INT) in red (and measured against the right vertical axis):

Pick Six rate
[continue reading…]

{ 16 comments }

In 2006, Doug looked into how much of a role the month in which you were born could play into your chances for athletic success later in life. Doug didn’t just ponder this out of thin air: a bit more research has been spent on this topic than you might think. Steve Levitt, of Freakonomics fame, found some evidence indicating that “older” kids in the same level of play — older by as much as 365 days, I suppose — tended to be more likely to become professional athletes. Basically, if you’re the oldest kid in your travel soccer team or 8th-grade basketball team, chances are you will be better than the other kids. This leads to a snowball effect, where you might be more likely to receive more personal coaching and your confidence should increase.

J.C. Bradury graphed the birth-month of over 16,000 major league baseball players. Take a look:
[continue reading…]

{ 5 comments }

Welker won't have any more "rare" drops in New England.

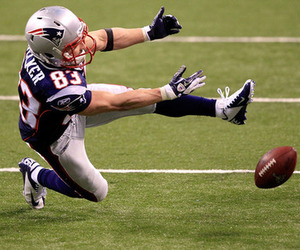
Welker won't have any more 'rare' drops in New England.

The craziness continues, with Wes Welker signing with the Denver Broncos being the big story of day two of the league year. The Patriots responded by signing Danny Amendola, the least surprising move since Brandon Lloyd joined Josh McDaniels in New England last year. Arguably the biggest move so far this week has been Mike Wallace joining Dolphins, while Greg Jennings still seems likely to move on from Green Bay. Throw in Percy Harvin to Seattle and Anquan Boldin to San Francisco, and we’re seeing a lot of movement among the top receivers this year. Which gives me an opportunity to do a quick data dump on the best receivers to ever switch teams.

In some ways, it’s hard to find a comparable receiver to Welker. He’s been so productive for so long that it’s easy to be unimpressed with the 118 catches, 1,354 yards, and six touchdowns he had last year, but no receiver had ever switched teams after catching more than 101 catches in a season. Only two receivers — Muhsin Muhammad and Yancey Thigpen — gained more receiving yards in a season than Welker did in 2012 and then played for a new team the next year.

But Welker’s amazingly unique numbers are a product of playing in a very pass-friendly environment on a team that threw 641 passes last year. To compare players across systems and eras, I came up with a wide receiver ranking system last month. That will allow us to look at the best receivers to switch teams and not just the ones from the last couple of decades. For some perspective, Welker ranked 8th among wide receivers last season, although that’s without any Tom Brady-adjustment.

The table below contains a lot of information. It shows receivers who added over 200 yards of value over average in Year N and then played for a new team in Year N+1. For each player, I’ve listed his old team, his age in Year N, some traditional statistics, the amount of value added by the receiver, and his rank among wide receivers. Then starting in the “N+1 tm” category, we see his new team, his statistics in the new season, how much value he added in Year N+1 and his rank in that season.
[continue reading…]

{ 9 comments }
Mike Wallace dropped Pittsburgh for Miami.

Mike Wallace dropped Pittsburgh for Miami.

Happy New Year to the NFL, which opened for business at 4PM yesterday. It’s been a busy couple of days, as the Seahawks (Percy Harvin) and 49ers (Anquan Boldin) acquired veteran receivers a day before the floodgates opened. The Dolphins made the biggest waves yesterday by signing WR Mike Wallace and ILB Dannell Ellerbe from AFC North heavyweights, and then later released ILB Karlos Dansby and signed OLB Philip Wheeler from the Raiders. The Colts chose to go quantity over quality by signing four different players (G Donald Thomas from New England, OLB/Colin Kaepernick turnstile Erik Walden from Green Bay, T Gosder Cherilus from Detroit, and DE Lawrence Sidbury from Atlanta). The Ravens lost Paul Kruger to Cleveland but did sign former Giants DE Chris Canty.

Tennessee made some noise signing G Andy Levitre from Buffalo and TE Delanie Walker from San Francisco, while the Chiefs picked up 3-4 DE Mike DeVito and TE Anthony Fasano from the AFC East. Chicago helped out Jay Cutler by signing TE Martellus Bennett (Giants) and T Jermon Bushrod (New Orleans), while Sam Bradford will be happy to know that the Rams added TE Jared Cook from Tennessee. The Broncos added guard Louis Vasquez from division-rival San Diego to keep Peyton Manning upright, and are rumored to be after Steelers running back Rashard Mendenhall. The Eagles won’t win the headlines, but made a couple of interesting signings in NT Isaac Sopoaga (San Francisco) and TE/HB/WR/FB/Chip Kelly chess piece James Casey from Houston. About an hour later, the Eagles added CB Bradley Fletcher (Rams), S Patrick Chung (Patriots) and LB Jason Phillips (Panthers). And there were some releases, with Ryan Fitzpatrick (Buffalo), Nnamdi Asomugha (Philadelphia), Sione Pouha (Jets), and Darrius Heyward-Bey and Michael Huff (Oakland) among the more notable cuts. You can check out Pro-Football-Reference.com’s free agent tracker to stay up to date on the latest signings.

The first few days of the league year provide fans across the country with an opportunity to ring in the new year with a dash of optimism. But how often does adding a veteran or two via trade or free agency land a team in the Super Bowl? The table below lists every notable veteran acquisition [1]Here, notable means having an AV of 4 or greater in Year N. by the 40 teams to make the Super Bowl since 1993, the start of the Free Agency era in the NFL. The “W/L” column shows whether the team won or lost in the Super Bowl, while the AV column shows how much Approximate Value the player provided in his first season with the new team. The N-1 Tm and N-1 AV columns show where the player came from and how valuable he was in the prior year; the table is sorted by the average of the player’s AV in Years N and N-1.
[continue reading…]

References

References
1 Here, notable means having an AV of 4 or greater in Year N.
{ 1 comment }

The origin of the name ‘Redskins’

The uniform worn by the Boston Redskins in 1935

The debate concerning whether the Washington Redskins should change its name has resurfaced in recent weeks. I have my opinion as to whether a name change is appropriate, but nobody cares to read that. Instead, I’d like to recount the history behind the name.

The nickname ‘Redskins’ predates the team playing football in Washington. The organization began playing football in 1932 — in Boston — under the nickname Braves. That was changed in 1933 to Redskins, and the franchise moved to Washington in 1937.

So where did the name Braves come from? The NFL was a fledgling league in the ’20s and ’30s, and teams in that era often chose names synonymous with the local baseball team. George Halas saw the success of the Cubs and named his team the Bears. When the Portsmouth Spartans moved to Detroit in 1934, the name “Lions” made sense for a city that already loved the Tigers. Major League Baseball’s San Francisco Giants began playing in New York in the 19th century, so it didn’t take the football team long to come up with a nickname in 1925. Like the Giants, the Boston football team simply copied one of the baseball team’s names — and they didn’t pick ‘Red Sox’. In 1932, the Atlanta Braves were still playing in Boston at Braves Field, and since that’s where the football team was scheduled to play, I imagine the team spent all of several seconds coming up with a name.
[continue reading…]

{ 80 comments }

The History of Black Quarterbacks in the NFL

Fritz Pollard, the first African American coach and quarterback in the NFL.

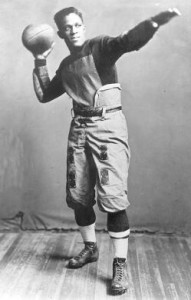
Fritz Pollard, the first African American coach and quarterback in the NFL.

Five years ago, I wrote a four part series detailing the history of the black quarterback. With February being Black History Month and Super Bowl XLVII marking the 25th anniversary of Doug Williams becoming the first black quarterback to win a Super Bowl, I figured it was worth another trip down memory lane.

The history of black quarterbacks in professional football is complicated. As recently as 2007, the New York Giants had never had a black quarterback throw even a single pass. On the other hand, as far back as 1921, Frederick Douglass “Fritz” Pollard not only quarterbacked the Akron Pros, but was also the first black head coach in NFL history.  A year earlier, Pollard and Bobby Marshall were the first two black players in professional football history and helped the Pros win the championship in the NFL’s inaugural season. [1]At the time, the NFL went by the name the American Professional Football Association. It was not known as the NFL until 1922. The Pros ran the single-wing, and Pollard was the player lined up behind the center who received the snaps. At the time the forward pass was practically outlawed, so Pollard barely resembles the modern quarterback outside of the fact that he threw a few touchdown passes during his career. [2]In addition to his NFL exploits, Pollard also achieved a great deal of fame for leading Brown to back-to-back road wins over the powerhouse schools of the time, Yale and Harvard, in 1916. He would … Continue reading

According to the great Sean Lahman, at least one African American played in the NFL in every year from 1920 to 1933, although Pollard was the only quarterback. [3]It wasn’t just African Americans that had full access during this era: Jim Thorpe coached and starred in a team composed entirely of Native Americans called the Oorang Indians in 1922 and 1923. Beginning in 1934, that there was an informal ban on black athletes largely championed by Washington Redskins owner George Marshall.   It wasn’t until 1946 that black players were re-admitted to the world of professional football, when UCLA’s Kenny Washington [4]Who occupied the same backfield with the Bruins as Jackie Robinson. and Woody Strode were signed by the Los Angeles Rams; in the AAFC, Bill Willis and Marion Motley were signed by Paul Brown’s Cleveland Browns that same season.
[continue reading…]

References

References
1 At the time, the NFL went by the name the American Professional Football Association. It was not known as the NFL until 1922.
2 In addition to his NFL exploits, Pollard also achieved a great deal of fame for leading Brown to back-to-back road wins over the powerhouse schools of the time, Yale and Harvard, in 1916. He would become the first African American to be named an All-American and the prior season, he lead Brown to the Rose Bowl.
3 It wasn’t just African Americans that had full access during this era: Jim Thorpe coached and starred in a team composed entirely of Native Americans called the Oorang Indians in 1922 and 1923.
4 Who occupied the same backfield with the Bruins as Jackie Robinson.
{ 38 comments }

The table below lists every retired number for each of the 32 franchises. It also lists each player’s career AV (starting in 1950), position(s), and years with the team. Each column is sortable, and you can use the search box to search by team (or uniform number, or position, or anything else); you can also change how many rows are shown by clicking on the dropdown box on the left.

[continue reading…]

{ 12 comments }

Now that we live in a world where Joe Flacco and Eli Manning have quarterbacked 3 of the last 6 Super Bowl-winning teams, you might be tempted to think that winning a Super Bowl as a QB doesn’t mean what it used to. After all, the playoffs are getting more random — as Aaron Schatz pointed out last night, four of the last six Super Bowl champs have finished the regular season with 10 or fewer wins. So it stands to reason that, as the championship teams themselves post less-remarkable seasons, so too would their quarterbacks not be the cream of the crop. And for all of his postseason brilliance, Flacco was just the league’s 17th-best quarterback during the regular season. Does his ascendancy, coming on the heels of Manning’s, signal a new trend?

To answer that question, I turned to a methodology I’ve used many times before. The basic premise is that, to put modern and historical quarterbacks on an even playing field (no pun intended), you must translate their stats into a common environment. To do this, you take the quarterback’s stats from a given season, pro-rate to 16 scheduled games, and multiply by the ratio of the league’s per-game average during the season in question to that of a common reference season. For instance, if I’m adjusting Terry Bradshaw’s 1977 passing yards to the 1991-2012 period, I would multiply his actual total of 2,523 by (16/14) to account for the shorter season that year, then multiply that by (225.1/162.2) to account for the change in the league’s passing environment, giving an adjusted total of 4,001 yards.

After doing that for every QB season since the merger, I then plugged the translated stats into a regression formula that predicts Football Outsiders’ Yards Above Replacement based on the QB’s box score stats (including the standard cmp/att/yds/td/int, plus sacks, fumbles, and rushing stats). This gives us Estimated Yards Above Replacement (eYAR) a measure of total value for each QB season, adjusted for schedule length and league passing conditions, which is perfect for historical analysis.

To get an idea of what we’re talking about, here are Flacco’s career translated stats and eYAR numbers:
[continue reading…]

{ 6 comments }

The winner of the first Super Bowl

The winner of the first Super Bowl.

Congratulations to Ray Lewis, Ed Reed, Joe Flacco, and the Baltimore Ravens on winning Super Bowl XLVII. The Ravens and 49ers treated us to an exciting Super Bowl, and the Hall of Fame chances of Terrell Suggs, Haloti Ngata, Matt Birk, Anquan Boldin, and yes, Joe Flacco, are a lot better today than they were 24 hours ago. And while most writers today will focus on the champions, I’m going to go in a different direction.

Two years ago, the 49ers were 6-10 and floundering; they had the 5th worst record in the league from 2004 from 2010 in the pre-Jim Harbaugh era. Today, San Francisco possesses arguably the NFL’s most talented roster and best coaching staff, but is coming off a painful loss in the title game.

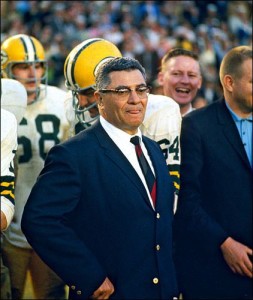
When I look at the 49ers, it’s hard not to see the striking similarities to an incredible turnaround executed 52 years ago. From 1953 to 1958, the Green Bay Packers were one of the league’s most poorly-run franchises. The team won just 20 games over that six-year period, the second fewest in the league. Vince Lombardi arrived in 1959, and the Packers won the NFL’s West Division in 1960, losing in the final seconds in the title game that year to Philadelphia. It was a heartbreaking loss, but the Packers used that game as motivation to win NFL titles in ’61, ’62, ’65, ’66, and ’67, with the latter two coming in the Super Bowl.

In 2011, I read and reviewed John Eisenberg’s excellent book That First Season: How Vince Lombardi Took the Worst Team in the NFL and Set It on the Path to Glory. Eisenberg looked at a subject that always fascinated me: the 1958 Packers, despite being the worst team in the league, had seven future Hall of Famers.
[continue reading…]

{ 1 comment }

Ever wondered which Super Bowl teams were the oldest or youngest? I went and calculated the AV-adjusted age of every team to appear in the Super Bowl. (AV stands for Pro-Football-Reference’s Approximate Value system, which assigns an approximate value to each player in each season; you can read more about it here.) You can probably guess who the oldest team was, but the youngest might be a bit of a surprise. Baltimore and San Francisco both come in roughly in the middle of the pack, with the Ravens slightly older than the 49ers. This also jives with Football Outsiders’ snap-adjusted ages article.

Bill Barnwell wrote a good article yesterday summarizing the success of Ozzie Newsome, the Baltimore Ravens general manager. That made me curious to see what percentage (based on AV, not total players, naturally) of the players on each Super Bowl team had never before played for another team. Great general managers do more than build their teams through the draft (and Barnwell specifically praised Newsome for that, including the trade for Anquan Boldin), but the question of what percentage of the team is “homegrown” is still an interesting one.

For the Ravens, 73% of their players (as measured by AV) have never played for another team, with Boldin, Cary Williams, Jacoby Jones, Bryant McKinnie, Matt Birk, Bernard Pollard, Corey Graham, and Vontae Leach being some notable exceptions. On the other side, 75% of the 49ers have only worn the red and gold, although Justin Smith, Jonathan Goodwin, Randy Moss, Donte Whitner, Carlos Rogers, Mario Manningham (at least, in the regular season) were key contributors who are not home-grown 49ers.

When it comes to AV-adjusted age or measuring how ‘home-grown’ each team is, neither team really stands out from the pack. The ’78 and ’79 Steelers featured 22 starters that were all home-grown, although making placekicker Roy Gerela the lone outlier (and since AV does not include kickers, both Pittsburgh teams were at 100%).

In addition to the AV-adjusted ages and “home-grownness” of each Super Bowl participant, the table below includes where each team (since 1970) ranked in points for, points allowed, yards, and yards allowed, and whether or not the team won the game. The table is fully sortable and searchable, and the rows for San Francisco and Baltimore will remain highlighted after sorting.

[continue reading…]

{ 16 comments }

I was planning on ignoring the latest Randy Moss news, using that word liberally as it applies to things said on media day. In case you missed it, Moss said yesterday that he believes he is the greatest receiver of all time. Moss is an obvious future Hall of Famer, but Jason Lisk gave Moss’ comments the appropriate treatment yesterday.

Today, though, Moss upped the ante by noting that “Jerry Rice had two Hall of Fame QBs his whole career. Give me that and see where my numbers are.” Yes, Rice was fortunate to play with Joe Montana and Steve Young, , but there is a pretty simple response to that. I wrote that response when Rice was a finalist for the Hall of Fame three years ago. You can read the full HOF profile I wrote on Rice, but I’ve reprinted Part III below:
[continue reading…]

{ 19 comments }

The Schottenheimer Index

Marty checking to make sure the pilot light is out.

Marty inquires as to whether Felix Wright's pilot light is out.

Last week, Neil brought us the latest iteration of the Manning Index, showing which quarterbacks have overachieved in the playoffs relative to expectation (based off of the Vegas line). I’m going to do the same today for coaches. A couple of introductory notes:

Neil described the exact methodology in his quarterbacks post, so I won’t waste time repeating it. However, I wanted to look at coaches over an even longer period, and 1950 sounded like a good cut-off. [1]Note that coaches, like Paul Brown, who coached before 1950 are included, but their pre-1950 stats are not. Since we don’t have point-spread data for games from 1950 to 1977 [2]One other piece of fine print: for the Super Bowls, I used the actual Vegas lines, since those are readily available., I simply used the projected point spread based on the differential between each team’s SRS ratings and by awarding the home team three points. So for pre-1977 games, coaches are credited with wins over expectation based on the SRS, and for post-1977, for wins over expectation based on the Vegas line. Here are the results.
[continue reading…]

References

References
1 Note that coaches, like Paul Brown, who coached before 1950 are included, but their pre-1950 stats are not.
2 One other piece of fine print: for the Super Bowls, I used the actual Vegas lines, since those are readily available.
{ 17 comments }

Flaccoing?

Flaccoing?

In September, I started a post by asking you to make this assumption:

Assume that it is within a quarterback’s control as to whether or not he throws a completed pass on any given pass attempt. However, if he throws an incomplete pass, then he has no control over whether or not that pass is intercepted.

If that assumption is true, that would mean all incomplete pass attempts could be labeled as “passes in play” for the defense to intercept. Therefore, a quarterback’s average number of “Picks On Passes In Play” (or POPIP) — that is, the number of interceptions per incomplete pass he throws — is out of his control.

After doing the legwork to test that assumption, I reached two conclusions. One, interception rate is just really random, and predicting it is a fool’s errand. Two, using a normalized INT rate — essentially replacing a quarterback’s number of interceptions per incomplete pass with the league average number of interceptions per incomplete pass — was a slightly better predictor of future INT rate than actual INT rate. It’s not a slam dunk, but there is some merit to using POPIP, because completion percentage, on average, is a better predictor of future INT rate than current INT rate.

So, why am I bringing this up today, at the start of Super Bowl week? Take a look at where Sunday’s starting quarterbacks ranked this year in POPIP (playoff statistics included, minimum 250 pass attempts):
[continue reading…]

{ 14 comments }

Want to see how passing has changed in the NFL over the last 63 years? A picture is worth at least 1,000 words in this case. The graph below shows the number of interceptions per dropback (red), sacks per dropback (purple), non-INT incomplete passes per dropback (yellow) and completions per dropback (green). Of course, a dropback is simply a pass attempt or a sack. The information is stacked on top of each other for ease of viewing.

pdist2
[continue reading…]

{ 6 comments }

Those are some clutch shirts

Those are some clutch shirts.

Eight years ago — almost to the day — our old PFR colleague Doug Drinen wrote a Sabernomics post about “The Manning Index”, a metric designed to roughly gauge the clutchness (or chokeitude) of a given quarterback by looking at how he did relative to expectations (he revived this concept in version two, six years ago). In a nutshell, Doug used the location of the game and the win differential of the two teams involved to establish an expected winning percentage for each quarterback in a given matchup. He then added those up across all of a quarterback’s playoff starts, and compared to the number of wins he actually had. Therefore, quarterbacks who frequently exceeded expectations in playoff games could be considered “clutch” while those who often fell short (like the Index’s namesake, Peyton Manning) might just be inveterate chokers.

Doug ran that study in the midst of the 2004-05 playoffs, so it shouldn’t be surprising that Tom Brady (who was at the time 8-0 as a playoff starter and would run it to 10-0 before ever suffering a loss) came out on top, winning 3.5 more games than you’d expect from the particulars of the games he started. Fast-forward eight years, though, and you get this list of quarterbacks who debuted after 1977:
[continue reading…]

{ 31 comments }

Is Joe Flacco elite?

Just a guess, but I think that question will be asked quite a few times over the next couple of weeks. While the inanity of the discussion that usually follows that question is not something I wish to emulate, there’s no particular reason not to take an in-depth look at Flacco’s career. The table below shows Flacco’s performance in six key metrics — all relative to league average (1.00) — for each season of his career:

Flacco career

As you can see, with the exception of his great interception rate — which justifies its own post during this pre-Super Bowl period — Flacco’s career performance has been rather average. His touchdown rate, like those of many quarterbacks, has bounced up and down throughout his career. His sack rate was below average during his first three years, improved significantly in 2011, and landed right at the league average in 2012.

ELITE

That is an elite Fu Manchu.

In the three main statistics — Y/A, NY/A, and ANY/A — Flacco has consistently finished in a tight window around the league average. His ANY/A has been slightly better than his NY/A thanks to that lofty interception rate, but suffice it to say Joe Flacco is, and has been for years, a league average quarterback.

If we look at ESPN’s Total QBR, Flacco ranked 27th as a rookie in 2008, 15th in 2009, and 12th in 2010, signaling a young quarterback improving and on the rise. In 2011, he ranked 14th, perhaps signaling a leveling off, and then this past season, he finished 25th. The positive spin would be that he’s a league-average quarterback, and the negative one (at least prior to this post-season) would have been that he was regressing.

On the other hand, here is how Flacco has performed in the playoffs in each game, as measured by AY/A:

[continue reading…]

{ 12 comments }

Super Bowl History

Now that the Super Bowl matchup is set, I thought I’d start the two-week period with some Super Bow history. The table below lists some information from each of the first 46 Super Bowls. With Joe Flacco and Colin Kaepernick facing off, that ends five-year streak where at least one of the two quarterbacks in the Super Bowl had previously won (or been in) a Super Bowl:


[continue reading…]

References

References
1 Co-MVP with Harvey Martin
{ 9 comments }

Yesterday, I provided my preview of the NFC Championship Game, and I’ll do the same for the AFC tomorrow. But today, here’s a listing of every conference championship game the since the NFL merger. The table below shows each game from the perspective of the winning team and includes a linkable boxscore for each game. The table also includes the Offensive SRS and Defensive SRS grades for each team and each opponent, along with the total SRS difference between the two teams. The final column shows the Vegas spread. You can search for all AFC or NFC games, or all games with BUF or DAL, for example. If you type in “NYG” you will see the five NFC Championship Games the Giants were in: not only was New York 5-0, but they were underdogs in four of those games. As always, the table is also fully sortable.
[continue reading…]

{ 3 comments }

Moss makes turkeys out of the Cowboys

Moss was very good when his teams won.

Last weekend, I looked at career rushing stats in wins and losses, and yesterday, I did the same for quarterbacks. Today we will check out the splits for receivers.

I looked at all games, including playoffs, from 1960 to 2011, for all players with at least 4,000 receiving yards over that time period. The table below lists the following information for each player:

– His first year (or 1960, if he played before 1960) and his last year (or 2011, if still active)
– All the franchises he played for (which you can search for in the search box)
– His number of career wins, and his career receptions, receiving yards, yards per reception, and receiving yards per game in wins
– His number of career losses, and his career receptions, receiving yards, yards per reception, and receiving yards per game in losses

You might be surprised to see Andre Johnson at the top of the list, but his career average should decline the longer he plays; that said, 2012 didn’t drop his numbers. On the flip side, Calvin Johnson moves up into the #2 slot; part of that was due to a great season (although Detroit didn’t get many wins) and part of that was due to Randy Moss slipping. Larry Fitzgerald comes up high on the list for the same reason as both Johnsons, although it’s often easy to forget how great Fitzgerald can be thanks to his current situation.

The table is sorted by receiving yards per game in wins:


[continue reading…]

{ 2 comments }

Is this a thinly-veiled Brady/Manning post?

Is this a thinly-veiled Brady/Manning post?

Last weekend, I looked at career rushing stats in wins and losses; today I will do the same but for quarterbacks.

I looked at all games, including playoffs, from 1960 to 2011, for all quarterbacks with at least 5,000 career passing yards over that time period. The table below lists the following information for each passer:

– His first year (or 1960, if he played before 1960) and his last year (or 2011, if still active)
– All the franchises he played for (which you can search for in the search box)
– His number of career wins, and his touchdown rate, interception rate, yards per attempt and Adjusted Yards per Attempt (which includes a 20-yard bonus for touchdown passes and a 45-yard penalty for interceptions) in wins [1]Unfortunately, I excluded sack data from this study due to its general unavailability for most of the covered time period.
– His number of career losses, and his touchdown rate, interception rate, yards per attempt and Adjusted Yards per Attempt in losses

The table is sorted by AY/A in wins; unsurprisingly, Aaron Rodgers — who is the career leader in that metric — tops this table, too. In fact, Rodgers is also the leader in AY/A in losses. Note that this table includes all games played by the quarterback, not just his starts.


[continue reading…]

References

References
1 Unfortunately, I excluded sack data from this study due to its general unavailability for most of the covered time period.
{ 0 comments }

This is mostly a huge end-of-regular-season data dump, but I’ll explain a little before the table…

PFR’s Simple Rating System can be broken into offensive and defensive components, which represent the number of points per game the team scored/allowed per game compared to the league average, after adjusting for the strength of opposing offenses and defenses faced. If you want to derive an expected winning percentage from that, you have to “back out” to total points scored/allowed again. To do that, you just add OSRS (or subtract DSRS) to the league’s average PPG, then multiply by the number of games the team played. This will give you adjusted points scored/allowed totals for the season.

To get that into a winning percentage-like form, you then need to plug those totals into the Pythagorean Formula. It usually takes the form of

(Pts Scored ^ x) / (Pts Scored ^ x + Pts Allowed ^ x)

where x was determined to be around 2.4 for the NFL in the 1990s, when current Houston Rockets (yep, basketball) GM Daryl Morey researched it for STATS, Inc. Last year, Football Outsiders decided to employ a “floating” exponent that varies with the scoring environment in which a team played, recognizing that a single point is more important to winning in lower-scoring environments. To that end, they used what’s known as the “Pythagenport” method of determining the exponent, which is

1.5 * log10((PF + PA) / G)

I was poking around in the data the other day, though, and found that the so-called “Pythagenpat” variant actually correlates slightly better with teams’ actual won-lost records since the NFL-AFL merger. That formula suggests for each team an exponent of

((PF + PA) / G) ^ 0.2466

This gives you a 1.204 RMSE vs. wins since 1970, a very slight improvement over the 1.205 RMSE you get using FO’s formula.

At any rate, I applied the Pythagenpat exponent to each team’s schedule-adjusted points scored/allowed totals since 1970, and tweaked the pythagorean win/loss totals up/down at the league-season level to match actual league-wide win/loss totals. The result was a definitive set of pythagorean ratings for every team since the merger:

Now, as an aside, I wouldn’t go plugging those directly into the log5 formula to predict this weekend’s games just yet. You first need to regress to the mean to account for the uncertainty we see in any observed result. To do that, just add about 17.65 games of .500 performance to each team’s pythagorean Wpct, and you’ll get a “true talent” number that should yield more accurate probabilities regarding future outcomes.

{ 6 comments }

Three weeks ago, I set forth the argument that perhaps Calvin Johnson was not even the most productive receiver in his own division. While Megatron racked up the numbers, I argued that you have to account for the situation. The relevant situation here is that the Lions ran an incredible 1,160 plays compared to just 999 for the Bears, and Detroit attempted 740 passes while Chicago threw only 485 times.

When one team throws 255 more passes than the other, I don’t think it’s appropriate to compare the receivers based on their raw receiving yards. One thing we could look at is yards per team attempt. The table below lists the number of team attempts for each wide receiver, his raw receiving statistics, and also his yards per attempt. The table is sorted by yards per team passing attempt. And while it is not relevant when discussing Marshall and Megatron, I have also included a Pro-rated Yards per Attempt column, which pro-rates the number of team attempts for the number of games played by the receiver (this helps Percy Harvin, of course).

Why can't we throw it like the Lions do??

Why can't we throw it like the Lions do??


As it turns out, Calvin Johnson was neither the best Johnson nor the best receiver in his division, at least as measured by this metric. I’m not convinced or even arguing that yards/attempt is the best way to rank receivers, but I do think the statistic represents an improvement on just receiving yards. Since receiving yards are so highly correlated with attempts, some adjustment needs to be made, and I plan on providing more analysis on how to grade wide receivers this off-season.
[continue reading…]

{ 3 comments }

In 2011, the Broncos scored 309 points and allowed 390 points. Despite being outscored by 81 points, the Tim Tebow express still made it into the post-season. In June, I speculated that the 2012 Broncos might set the record for the largest increase in pass completions in one year, and they did just that on Sunday. They also moved into fourth place on another list.

With 481 points and 289 points allowed, Denver outscored its opponents by 192 points in 2012. Peyton Manning and Von Miller have turned the Broncos into one of the best teams in the league a year after they were one of the worst (at least, as measured by points differential). Denver improving their points differential by a whopping 273 points this year relative to 2011, the fourth largest increase in football history.

{ 1 comment }

Trent Richardson thinks this guy was an average running back in losses.

Trent Richardson thinks this guy was an average running back in losses.

Yesterday, I noted that Adrian Peterson is averaging nearly two more yards per rush in losses than wins. He’s also averaging a nearly identical number of rushing yards per game in wins and losses.

As you’re about to see, that’s pretty rare. We all know that wins are correlated with rushing yards, so it should come as no surprise that running backs generally gain more rushing yards in wins than in losses.

I looked at all games, including playoffs, from 1960 to 2011, for all players with at least 3,000 rushing yards over that time period. The table below lists the following information for each player:

— His first year (or 1960, if he played before 1960) and his last year (or 2011, if still active)
— All the franchises he played for (which you can search for in the search box)
— His number of career wins, and his career rush attempts, rushing yards, rushing yards per carry, and rushing yards per game in wins
— His number of career losses, and his career rush attempts, rushing yards, rushing yards per carry, and rushing yards per game in losses

The table is sorted by rushing yards per game in wins. Again, for players like Jim Brown or Peterson, they are included but only their stats from 1960 to 2011 are shown. The table only shows the top 50 players, but the search feature works for the entire table, which includes 281 players. In addition, you can click on the drop arrow and change the number of rows shown.

As always, the table is fully sortable. If you click twice on the far right column, you see the career leaders in rushing yards per game in losses. You probably aren’t surprised to see Barry Sanders at the top, but the presence of the running back formerly known as Dom Davis up there is a bit surprising. Steven Jackson is one of the few players who have averaged over 70 rushing yards per game in losses, which jives with the sixth post in Football Perspective history. In addition, Jackson (at least through 2011) and LaDainian Tomlinson form an interesting example of Simpson’s Paradox: Jackson has a higher career rushing yards per game average in both wins (93.9 to 89.9) and losses (71.1 to 63.2), while Tomlinson has the higher career average overall (78.6 to 78.3).


[continue reading…]

{ 4 comments }

Checkdowns: Biggest failed comebacks

Brady joins Marino on the failed comebacks list

Brady joins Marino on the failed comebacks list.

[UPDATE: There was an error earlier in this post. I believe it is fixed now.]

On Sunday Night, the Patriots trailed 31-3 halfway through the third quarter. But that’s when Tom Brady got hot, and New England tied the game with 6:43 left in the 4th quarter. At that moment, many fans probably had visions of the Oilers-Bills playoff game, where Buffalo came back from a 32-point deficit to win.

And while there are a lot of famous comebacks, the failed comeback is much less memorable. But in fact, this was the 4th time a team trailed by 28 points in the game only to tie or take the lead in the 4th quarter… but ultimately lose.

The table below shows all games prior to 2012 where a team trailed by at least 21 points, was trailing entering the 4th quarter, came back to tie or take the lead in the 4th quarter, but then still lost. The table is listed from the perspective of the eventual winner and shows the final points for and points allowed in the game, along with the biggest lead and the largest fourth-quarter deficit the winning team faced despite the large early lead.

Note that this excludes games this game between Green Bay and Pittsburgh from 1951, where the Packers held a 28-point lead and won, but actually trailed entering the 4th quarter.

{ 1 comment }
Next Posts Previous Posts