≡ Menu

Did You Know: The 49ers Were Terrible Last Year?

It’s easy to forget that the 49ers were awful last season, going 4-12 and earning the second pick in the NFL Draft. To the extent you remember that San Francisco was bad last year, it’s probably because you see All-World rookie defensive end Nick Bosa dominating the league this season, and the 49ers drafted him with that second overall pick.

But otherwise, it’s hard to fathom that the dominant, 7-0 49ers, were actually terrible last year. Those 49ers allowed 27.2 points per game and scored 21.4 points per game, a difference of 5.8 points per game. This season, San Francisco is averaging 29.6 points per game and allowing just 11.0 through seven games, a difference of 18.6 points per game and an improvement of 24.4 net points per game.

That’s… a lot. In fact, it’s the third most in the NFL since 1950, trailing only the 2013 Chiefs (who added HC Andy Reid and ex-49ers QB Alex Smith in the offseason) and the 1999 Rams (who added QB Kurt Warner, RB Marshall Faulk, and WR Torry Holt in the offseason to form the GSOT offense).  San Francisco has been helped by having QB Jimmy Garoppolo back, of course, but the team has mostly been aided by a dominant defense.

The graph below shows the points differential for each team since 1950 on the X-Axis, and that team’s points differential through 7 games the next season on the Y-Axis.  I’ve colored in four of those dots: at -5.8, 21.6 are the ’98-99 Rams; at -5.8, 18.6 are the ’18-19 49ers.  Over to the left at -13.4, 12.6 are the 2012-13 Chiefs, and at the top of the chart are the 2018-2019 Patriots, who jumped from a +6.9 points differential to a +25.0 points differential through 7 games. [continue reading…]

{ 0 comments }

All-Pro Voting: Comparing Barry Sanders and Emmitt Smith

Barry Sanders and Emmitt Smith are two of the greatest running backs in NFL history. They also happened to be contemporaries, which let NFL fans and analysts compare them year after year. Today, I want to review how the media viewed these two players.

Sanders entered the NFL a year before Smith, and was an instant success. As a rookie, Sanders and Christian Okoye were the  top running backs in the NFL, with Thurman Thomas, Neal Anderson, and Dalton Hilliard rounding out the top five.  Here was the voting by the Associated Press, Pro Football Writers Association, Sporting News, Newspaper Enterprise Association, Pro Football Weekly, and the UPI.  I have noted whether each award was a 1st-team All-Pro honor, a 1st-team All-Conference honor, or a 2nd-team All-Pro honor.

In 1990, Smith entered the league, and while he earned the AP Offensive Rookie of the Year award, he couldn’t compete for honors on a larger scale.  This was the start of a two-year period where the former Oklahoma State Cowboys, Sanders and Thomas, were the clear top two running backs in the NFL, with Anderson and Marion Butts also picking up some honors.

In 1991, Thurman Thomas was the MVP of the league according to the AP, PFWA, and the NEA, and he also picked up the AP Offensive Player of the Year award. Sanders, however, also won his first MVP this season, snagging the Bert Bell Award.  Smith started to get some honors, and was the media’s choice as the third best running back in the NFL this season.

In ’92,  Steve Young was outstanding and won most of the major MVP awards, but Smith earned his first MVP honors this season, being selected by the NEA as the best player in the NFL.  Barry Foster had a career season, and it was he — and not Sanders — who shared the first-team All-Pro awards.   Pro Football Weekly also made All-Conference choices this season.

The next season, 1993, Smith swept all the major awards, winning the AP, NEA, PFWA, and Bert Bell MVP honors.  Jerome Bettis (on the Rams) was probably the second-best RB this season, with Thomas the best running back in the AFC and fighting with Sanders for the title of third best running back in the NFL. [continue reading…]

{ 0 comments }

There were 14 NFL teams back in 1962, and the starting quarterbacks for 11 of them averaged more yards per pass attempt than the starting quarterbacks for those same teams did in 2018. We learned that in Part I of this series.  Today, in Part II, we will look at the evolution of passing efficiency in the NFL since 1940.

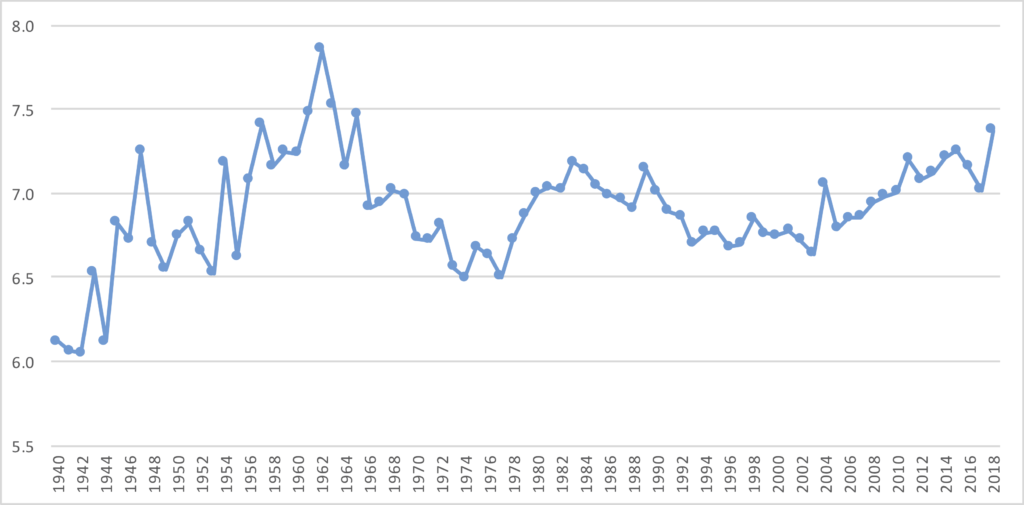
In 1962, the league as a whole averaged 7.9 yards per pass attempt.  That’s a remarkable figure.  So remarkable that it remains the record and is unlikely to be broken anytime soon.  The graph below shows the NFL yards per attempt average in each season from 1940 to 2018.

It doesn’t take a long examination to see that the 1962 season is a significant outlier.  So what caused this?  It helps to begin by breaking down yards per attempt into two components: Completions per Attempt and Yards per Completion; the product of these two statistics is, of course, yards per attempt.

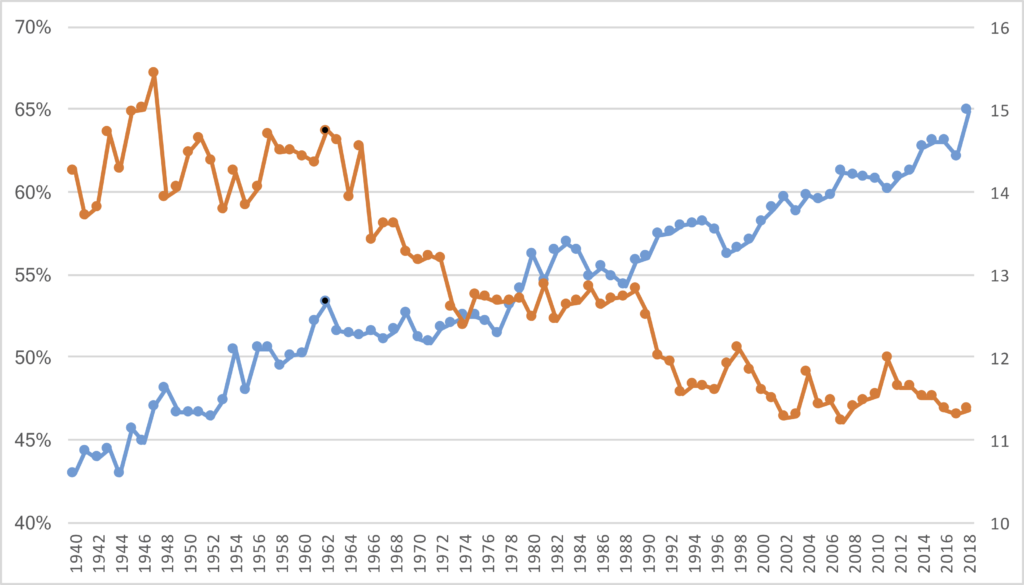
Over the last 80 years, completion percentages have been rising. This is well known, but less discussed is that the average gain on those completed passes — the statistic known as yards per completion — has been steadily falling.   The graph below shows the NFL average completion percentage in blue and marked against the Left Y-Axis, and NFL  yards per completion average in orange marked against the Right Y-Axis, for each year from 1940 to 2018.  The graph forms a jagged X: yards per completion starts up and to the left and ends down and to the right, with completion percentage beginning in the lower left quadrant and ending on the upper right quadrant.

To make it easier for you to see, I shaded the 1962 season in black dots on both lines.  There was a large jump in completion percentage in 1962 — in fact, ’62 set the new record for completion percentage in a season at 53%, and that mark wasn’t broken until 1979!  On the other hand, this wasn’t shocking for the era: after all, 1961 also set a new record for completion percentage.  The 53% rate was notably high and a bit of an outlier, but part of a (still) growing trend towards higher completion percentages year over year.

On the other hand, the 1962 season also represented a reversal of the trend in terms of yards per completion.  Teams gained 14.74 yards per completed pass, the 4th-highest since 1940 both at the time and since.  And the three higher seasons all had come well over a decade earlier, so this was a true change in the tides.  Not only were teams completing more passes than ever, but they were doing so at a rate similar to what happened prior to 1950.

Of course, simple math tells us that if you have an extraordinarily high (for that era) completion percentage combined with an extraordinarily high yards per completion average, that you will wind up with a record-setting yards per attempt average.  And that’s exactly what happened.  The early 1960s were somewhat of an inflection point in this regard: the top three yards per attempt seasons in NFL history were in 1961, 1962, and 1963!  And the 4th-best mark came in 1965.

In the early part of the ’60s, while the AFL was earning a reputation for being a pass-happy league, the NFL was quietly enjoying its most pass efficient seasons in history.  And to be clear, all data in this post is NFL-only.  But even among this era of rising completion percentages and still-high YPC averages, the ’62 season stands alone.  If 1962 didn’t exist, we’d talk about how 1961 and 1963 were remarkably high yards/attempt seasons, but 1962 easily eclipses both of those marks.

Finally, here is the data from every year since 1940, presented in table form.

So what caused all of this? Stay tuned for Part III.

{ 0 comments }

Super Bowl Teams And Passing Efficiency

Over the last two days, I have argued that the value of a top passing offense is lower than it used to be. One natural counter to that might be, hey Chase, haven’t you noticed that Tom Brady and the Patriots tend to always win the Super Bowl?

But that’s not exactly as convincing an argument as you might think. The Patriots won the Super Bowl in 2014, 2016, and 2018. And let’s be super clear about what I’m saying: I am not saying that quarterbacks are not critical, just that they are less critical than they used to be! From 1958 to 1979, the team that won the NFL championship or Super Bowl had a Hall of Fame quarterback in all but two of those seasons.

So yes, Tom Brady may be winning Super Bowls, but that’s hardly evidence that quarterbacks matter more than ever. Especially when you consider that Brady being at his best has borne little relation to whether or not the Patriots win the Super Bowl.

The graph below shows the Patriots passing offense in each season from 2001 to 2018, measured by New England’s Adjusted Net Yards per Attempt average minus league average ANY/A. Yes, New England has had an above-average passing offense each year. The team has won 6 Super Bowls, and those dots are in gold and black. [continue reading…]

{ 0 comments }

In this series, I will be looking at the history of coaches, quarterbacks, rushers, and receivers for all 32 franchises. For coaches and quarterbacks, I will be looking at how much their franchise’s career records (regular season only) would change if we removed the games with that person. For rushers and receivers, I will note how many times that player was the team’s leading rusher/receiver over the course of their time with that franchise (regular plus postseason).

Teams:

AFC East: Dolphins, Bills, Jets, and Patriots
NFC East: Cowboys, Eagles, Giants, and Redskins
AFC North: Steelers, Browns, Ravens, and Bengals
NFC North: Packers, Vikings, Bears, and Lions
AFC South: Jaguars, Colts, Texans, and Titans
NFC South: Panthers, Falcons, Saints, and Buccaneers
AFC West: Raiders, Chiefs, Chargers, and Broncos
NFC West: Seahawks, Rams, 49ers, and Cardinals
[continue reading…]

{ 0 comments }

In this series, I will be looking at the history of coaches, quarterbacks, rushers, and receivers for all 32 franchises. For coaches and quarterbacks, I will be looking at how much their franchise’s career records (regular season only) would change if we removed the games with that person. For rushers and receivers, I will note how many times that player was the team’s leading rusher/receiver over the course of their time with that franchise (regular plus postseason).

Previous Teams:

AFC East: Dolphins, Bills, Jets, and Patriots
NFC East: Cowboys, Eagles, Giants, and Redskins
AFC North: Steelers, Browns, Ravens, and Bengals
NFC North: Packers, Vikings, Bears, and Lions
AFC South: Jaguars, Colts, Texans, and Titans
NFC South: Panthers, Falcons, Saints, and Buccaneers
AFC West: Raiders, Chiefs, Chargers, and Broncos
NFC West: Seahawks, Rams, 49ers
[continue reading…]

{ 0 comments }

In this series, I will be looking at the history of coaches, quarterbacks, rushers, and receivers for all 32 franchises. For coaches and quarterbacks, I will be looking at how much their franchise’s career records (regular season only) would change if we removed the games with that person. For rushers and receivers, I will note how many times that player was the team’s leading rusher/receiver over the course of their time with that franchise (regular plus postseason).

Previous Teams:

AFC East: Dolphins, Bills, Jets, and Patriots
NFC East: Cowboys, Eagles, Giants, and Redskins
AFC North: Steelers, Browns, Ravens, and Bengals
NFC North: Packers, Vikings, Bears, and Lions
AFC South: Jaguars, Colts, Texans, and Titans
NFC South: Panthers, Falcons, Saints, and Buccaneers
AFC West: Raiders, Chiefs, Chargers
NFC West: Seahawks, Rams, 49ers [continue reading…]

{ 0 comments }

In this series, I will be looking at the history of coaches, quarterbacks, rushers, and receivers for all 32 franchises. For coaches and quarterbacks, I will be looking at how much their franchise’s career records (regular season only) would change if we removed the games with that person. For rushers and receivers, I will note how many times that player was the team’s leading rusher/receiver over the course of their time with that franchise (regular plus postseason).

Previous Teams:

AFC East: Dolphins, Bills, Jets, and Patriots
NFC East: Cowboys, Eagles, Giants, and Redskins
AFC North: Steelers, Browns, Ravens, and Bengals
NFC North: Packers, Vikings, Bears, and Lions
AFC South: Jaguars, Colts, Texans, and Titans
NFC South: Panthers, Falcons, Saints, and Buccaneers
AFC West: Raiders, Chiefs, Chargers
NFC West: Seahawks, Rams
[continue reading…]

{ 0 comments }

In this series, I will be looking at the history of coaches, quarterbacks, rushers, and receivers for all 32 franchises. For coaches and quarterbacks, I will be looking at how much their franchise’s career records (regular season only) would change if we removed the games with that person. For rushers and receivers, I will note how many times that player was the team’s leading rusher/receiver over the course of their time with that franchise (regular plus postseason).

Previous Teams:

AFC East: Dolphins, Bills, Jets, and Patriots
NFC East: Cowboys, Eagles, Giants, and Redskins
AFC North: Steelers, Browns, Ravens, and Bengals
NFC North: Packers, Vikings, Bears, and Lions
AFC South: Jaguars, Colts, Texans, and Titans
NFC South: Panthers, Falcons, Saints, and Buccaneers
AFC West: Raiders, Chiefs
NFC West: Seahawks
[continue reading…]

{ 0 comments }

Andrew Luck Retires: How Good Was He Really?

Seven years ago, Andrew Luck entered the NFL as one of the greatest quarterback prospects of all time. He was expected to become this generation’s John Elway or Peyton Manning, and he never looked the part more so than on this touchdown pass:

Those who witnessed the Luck era will not soon forget it. The hype accompanied Luck was massive, because he was a perfect prospect. He not only had an arm that could do this, with little help from his legs…

But he also had legs that could do this, with a little help from his arms…

[continue reading…]

{ 0 comments }

In this series, I will be looking at the history of coaches, quarterbacks, rushers, and receivers for all 32 franchises. For coaches and quarterbacks, I will be looking at how much their franchise’s career records (regular season only) would change if we removed the games with that person. For rushers and receivers, I will note how many times that player was the team’s leading rusher/receiver over the course of their time with that franchise (regular plus postseason).

Previous Teams:

AFC East: Dolphins, Bills, Jets, and Patriots
NFC East: Cowboys, Eagles, Giants, and Redskins
AFC North: Steelers, Browns, Ravens, and Bengals
NFC North: Packers, Vikings, Bears, and Lions
AFC South: Jaguars, Colts, Texans, and Titans
NFC South: Panthers, Falcons, Saints, and Buccaneers
AFC West: Raiders
NFC West: Seahawks
[continue reading…]

{ 0 comments }

In this series, I will be looking at the history of coaches, quarterbacks, rushers, and receivers for all 32 franchises. For coaches and quarterbacks, I will be looking at how much their franchise’s career records (regular season only) would change if we removed the games with that person. For rushers and receivers, I will note how many times that player was the team’s leading rusher/receiver over the course of their time with that franchise (regular plus postseason).

Previous Teams:

AFC East: Dolphins, Bills, Jets, and Patriots
NFC East: Cowboys, Eagles, Giants, and Redskins
AFC North: Steelers, Browns, Ravens, and Bengals
NFC North: Packers, Vikings, Bears, and Lions
AFC South: Jaguars, Colts, Texans, and Titans
NFC South: Panthers, Falcons, Saints, and Buccaneers
AFC West: Raiders
[continue reading…]

{ 0 comments }

All Time NFC South Teams, by Bryan Frye

This marks the end of my series on all-time division teams. As I have advertised at a shamelessly attention seeking level, I wrote this while under the influence of narcotics following back surgery. While I’m sure the series would have been better had I written while more cognizant of my surroundings, the idea of trying to sleepwalk my way through a historical piece piqued my interest. The idea of accidentally forgetting obvious players or saying things I would normally filter when thinking rationally amuses me, and I can’t pass up the opportunity to embarrass myself and my children after me. Once again, these are the rules Chase and I have agreed on:

  1. I write everything before my painkiller prescription runs out,
  2. I write it completely off the top of my head and don’t do any research,
  3. I don’t have to proofread this when I finish it, and
  4. Chase doesn’t edit my nonsense out of the article (so we can maximize my odds of getting owned online).[1]Roster construction is as follows: 1 QB, 2 RB, 3 WR, 2 TE, 2 T, 2 G, 1 C, 2 DE, 2 DT, 2 OLB, 2 MLB/ILB, 3 CB, 2 S, 1 K, 1 P, 1 HC
  5. I maintain modern division designations. If a player played for the Seahawks when the team was in the AFC West, I am counting him in the NFC West. I spent five minutes staring at the corner of my phone because I didn’t remember it being that shape, so I’m sure as hell not spending time putting Aeneas Williams in the NFC East.

Previous articles:

AFC North
AFC East
AFC West
AFC South
NFC North
NFC East
NFC West

Without further ado, here’s the NFC South: [continue reading…]

References

References
1 Roster construction is as follows: 1 QB, 2 RB, 3 WR, 2 TE, 2 T, 2 G, 1 C, 2 DE, 2 DT, 2 OLB, 2 MLB/ILB, 3 CB, 2 S, 1 K, 1 P, 1 HC
{ 0 comments }

1962 in Review: Comparing Starting QBs to 2018

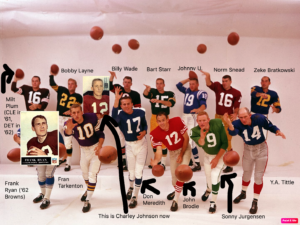
In 1962, Eagles QB Sonny Jurgensen averaged 8.9 yards/attempt. In 2018, Eagles QB Carson Wentz averaged 7.7 yards per attempt.

In 1962, Packers QB Bart Starr averaged 8.6 yards/attempt. In 2018, Packers QB Aaron Rodgers averaged 7.4 yards per attempt.

In 1962, 36-year-old Giants QB Y.A. Tittle averaged 8.6 yards/attempt. In 2018, 37-year-old Giants QB Eli Manning averaged 7.5 yards/attempt.

In 1962, Redskins QB Norm Snead averaged 8.3 yards/attempt. In 2018, Washington QB Alex Smith averaged 6.6 yards/attempt.

And while those were the four best quarterbacks of 1962, a cherry-picked sample doesn’t explain the superiority of the ’62 passers.

  • Vikings QB Fran Tarkenton averaged 7.9 yards/attempt in ’62, besting ’18 successor Kirk Cousins and his 7.1 Y/A average.
  • Bears QB Billy Wade averaged 7.7 yards/attempt in ’62, while Chicago QB Mitchell Trubisky averaged 7.4 yards/attempt last year.
  • The Cardinals? Forget about any comparison here. In 1962, Charley Johnson averaged 7.9 yards/attempt, while 2018 Josh Rosen gained just 5.8 yards per attempt for the Cardinals.
  • In 1962, Dallas split its quarterback duties between Eddie LeBaron and Don Meredith. The 32-year-old LeBaron averaged 8.7 yards per attempt in 6 starts, while the 24-year-old Meredith averaged 7.9 yards per attempt in 8 starts; either way, both bested 2018 Dak Prescott, who averaged 7.4 yards per attempt for the Cowboys.

At this point, you’re probably thinking that I’m engaging in some form of misdirection about the 1962 season versus the 2018 season. I can assure you I am not. In 1962, Lions QB Milt Plum gained 7.3 yards per attempt; in ’18, Detroit QB Matthew Stafford averaged 6.8 yards per attempt. What about the Colts? Well, in 1962, John Unitas averaged 7.6 yards per attempt; that’s better than 2018 Andrew Luck, who gained 7.2 yards per pass attempt. In 1962, Cleveland QB Frank Ryan averaged 7.9 yards per attempt; in 2018, Cleveland QB Baker Mayfield averaged 7.7 yards per attempt.

There were 14 teams in the NFL in 1962, and all 14 teams are still around today (albeit with some relocation). Relative to the starting quarterbacks for those teams in 2018, 11 of the starting quarterbacks in 1962 averaged more yards per pass attempt than their 2018 successors. The three outliers were in Pittsburgh, San Francisco, and Los Angeles. In 1962, John Brodie averaged a very respectable 7.5 yards per attempt, but 2018 Nick Mullens averaged 8.3 yards per attempt. If you expected to read an article about how Nick Mullens helped save the 2018 NFL season from looking weak relative to 1962, you are a better prophet than me. In ’62, Steelers 36-year-old QB Bobby Layne averaged 7.2 yards per attempt; last year, Pittsburgh’s 36-year-old QB Ben Roethlisberger averaged 7.6 yards per attempt. And finally, the 1962 Los Angeles Rams were awful: Zeke Bratkowski averaged a league-low 7.0 yards per attempt, and the team went 1-12-1. Last year, Jared Goff of the Los Angeles Rams averaged 8.4 yards per attempt as he helped the team win the NFC. [continue reading…]

{ 0 comments }

In Super Bowl II, Green Bay quarterback Bart Starr completed 13 of 24 passes for 202 yards, with 1 TD and no interceptions. He also took three sacks for 30 yards, and his backup was sacked once for 10 yards.

That means on 28 dropbacks, the Green Bay passing attack picked up 162 yards and produced 1 TD and 0 INTs, which translates to 142 Adjusted Net Yards. That’s an Adjusted Net Yards per Attempt average of 6.50 in Super Bowl II for Green Bay.

So was that a good performance by Starr and the Packers passing attack? No.

It was a great one. Passing efficiency was a lot different in 1967 than it is today, and the Raiders had a great pass defense. In 1966, Oakland allowed 3.14 ANY/A to opposing passers, the 3rd-best in the AFL; in 1967, that number dropped to just 2.23, the best in the AFL and third in all of pro football. And in 1968, opposing QBs averaged just 2.81 ANY/A against the Raiders. (And in 1969, it was just 2.64.)

The graph below shows every game for the Raiders defense from 1966 to 1968, in chronological order. Joe Namath consistently gave the Raiders problems, including in the famous Heidi Game in 1968. But otherwise, the Raiders pass defense tended to overwhelm most quarterbacks. On the X-Axis, we have games played in order. The Y-Axis shows the ANY/A allowed by the Raiders, shown from -6 to 14 (since the league average ANY/A was around 4.0). [continue reading…]

{ 0 comments }

In this series, I will be looking at the history of coaches, quarterbacks, rushers, and receivers for all 32 franchises. For coaches and quarterbacks, I will be looking at how much their franchise’s career records (regular season only) would change if we removed the games with that person. For rushers and receivers, I will note how many times that player was the team’s leading rusher/receiver over the course of their time with that franchise (regular plus postseason).

Previous Teams:

AFC East: Dolphins, Bills, Jets, and Patriots
NFC East: Cowboys, Eagles, Giants, and Redskins
AFC North: Steelers, Browns, Ravens, and Bengals
NFC North: Packers, Vikings, Bears, and Lions
AFC South: Jaguars, Colts, Texans, and Titans
NFC South: Panthers, Falcons, Saints, and Buccaneers

[continue reading…]

{ 0 comments }

It has long been established that, on average, winning teams rush for more yards than losing teams. That’s because, among other reasons, the winning team usually has the lead late in the game, causing the winning team to run more frequently and the losing team to run less frequently. Rushing attempts (and therefore, yards) are highly correlated with winning, which is one of the reasons I first started calculating Game Scripts data.

As a result, teams tend to average more rushing yards in victories than defeats. And I’m not breaking any news here when I say that this tenet holds up at the individual player level, too. From 1950 to 2018, there were 69 players who (i) rushed for at least 2,500 yards in games their teams won and also (ii) rushed for at least 2,500 yards in games their teams lost.

And 67 of those players averaged more rushing yards per game in wins than in losses. That, of course, is what you would expect. Earnest Byner is the most extreme player in this regard: in games his team won, Byner averaged 52.2 rushing yards per game; in games his team lost, Byner averaged 25.7 rushing yards per game. And it’s not just the Byners of the world: Hall of Famers with different styles and from different eras — Marshall Faulk (86.0 rushing yards per game in wins, 52.0 in losses), Earl Campbell (107.4, 63.4), O.J. Simpson (112.0, 69.3) and Thurman Thomas (77.6, 44.5) to name a few — have large splits in rushing averages in wins and losses.

But today’s post is about Byner’s teammate on the ’91 Redskins, Gerald Riggs. He is one of just two players (Don Perkins, 56.2, 59.8) in this group who averaged fewer rushing yards per game in wins (60.0) than in losses (66.2). That should be shocking to you as a reader, given that the average running back will have about 40% more rushing yards in wins than losses. So does this mean Riggs actually was a better running back when his team lost the game?

The short answer is, no. Riggs, like every other running back, rushed for more yards when his team won than when his team lost, all else being equal. It’s that last part, though, that is the tricky part.

Riggs had two dominant rushing seasons where he averaged 99 and 107 rushing yards per game: 1984 and 1985. In those two seasons, his Falcons went just 7-24 in the games he played.

Riggs had four strong seasons where he averaged between 50 and 90 rushing yards per game: 1986 to 1989. In those four years, his teams went 20-28-1 in games he played (and I will be ignoring the one tie game for the rest of this article).

Riggs also had four years — two at the beginning of his career and two at the end — where he was a backup and averaged under 50 rushing yards per game. In those four seasons (’82, ’83, ’90, and ’91) his teams went 31-18. Notably, this includes his time on the ’91 Redskins — who went 14-2 and for whom Riggs played every game — when he averaged a career low 15.5 rushing yards per game and retired after the season (after scoring a pair of touchdowns in the Super Bowl, no less).

Regular readers of this site and those familiar with Simpson’s Paradox can surely see what’s coming. During his stud running back days, Riggs played on bad teams that produced just 12% of his career wins but 34% of his career losses. During his days as a solid starter, Riggs played on teams that produced 34% of his career wins and 40% of his career losses. And during his days as a backup, Riggs played on good teams that produced 53% of his career wins and just 26% of his career losses. His time as the third-string running back behind Byner and Ricky Ervins on one of the best teams of all time produced 24% of his career wins but just 3% of his career losses.

So when we look at his career, of course Riggs rushed for more yards in losses than in wins: broadly speaking, he was a reserve in a lot of the games his team won and the center of the offense in many of the games his teams lost.

In 1984, Riggs rushed for 99 yards per game on a 3-12 Falcons team in the games he played. In Atlanta’s three wins, he rushed for 137 yards per game; in the 12 losses, he averaged 90 rushing yards per game. That’s perfectly normal, rushing for significantly more yards per game in wins than losses.

In 1991, Riggs rushed for 16 yards per game on maybe the best team of all time. In wins, he rushed for 17 yards per game, and in losses, he rushed for 2 yards per game. That’s perfectly normal, too: rushing for significantly more yards per game in wins than losses.

But here’s the catch: what if we remove the ’84 and ’91 seasons from Riggs’ career entirely? By removing two years where Riggs rushed for significantly more yards per game in wins than in losses, what happens to his career average? Well, it would mean Riggs would have rushed for 69 yards per game in wins and … 63 yards per game in losses. This, of course, is the heart of Simpson’s Paradox: because of the different sizes of the groups, the results are reversed when we combine the data. It’s counter-intuitive, because Riggs looks better for his career in wins than in losses only after we remove two years where he did much worse in wins than in losses!

The table below shows Riggs’s career stats by season, and his per-season rushing statistics in wins and losses. The final right column shows how many more rushing yards per game Riggs averaged in losses than in wins each year. As you can see, while this number is a positive 6.2 for his career, in all but two seasons, this number was negative, meaning Riggs averaged more rushing yards per game in wins than losses:

This is what Simpson’s Paradox is all about, and this may be my new favorite example: the 1991 season really deflates his career averages, but it hits his “wins” statistics 8x as powerfully as his “losses” statistics.

And there’s even an easy story to tell about his 1989 season, which looks like a big outlier. After all, Riggs averaged a mediocre 50 rushing yards per game in wins and a superstar-producing 108.5 yards per game in wins. So what happened? In week 2, Riggs rushed for a whopping 211 yards in a win against the Eagles…. except it wasn’t a win; the Redskins led 20-0 early and 37-28 with less than three minutes left in the game, but the Eagles scored two last-minute touchdowns to steal the game and turn this into a great rushing effort in a loss (in part because of Riggs’ game-changing fumble). Had this been a win, Riggs would have averaged 69.0 rushing yards in wins that season, and 71.0 rushing yards per game in losses. And that is only because Riggs lost playing time as the season went along: he was a part-time player by December, when Washington went 4-0 but Riggs averaged only 41 rushing yards per game.

The general rule is that all players average more rushing yards in wins than in losses. And when that’s not true, well, it probably still is true: you just need to figure out how Simpson’s Paradox is mucking up your data.

{ 0 comments }

In this series, I will be looking at the history of coaches, quarterbacks, rushers, and receivers for all 32 franchises. For coaches and quarterbacks, I will be looking at how much their franchise’s career records (regular season only) would change if we removed the games with that person. For rushers and receivers, I will note how many times that player was the team’s leading rusher/receiver over the course of their time with that franchise (regular plus postseason).

Previous Teams:

AFC East: Dolphins, Bills, Jets, and Patriots
NFC East: Cowboys, Eagles, Giants, and Redskins
AFC North: Steelers, Browns, Ravens, and Bengals
NFC North: Packers, Vikings, Bears, and Lions
AFC South: Jaguars, Colts, Texans, and Titans
NFC South: Panthers, Falcons, Saints

The Tampa Bay Bucs have only had two coaches with a winning record in franchise history. Jon Gruden won the team’s lone Super Bowl, of course, but otherwise he isn’t too interesting to analyze: he went 57-55 as the team’s head coach.

That leaves Tony Dungy, clearly the best regular season coach in the history of the franchise. Under Dungy, Tampa Bay won 56% of their games; without him, the Bucs have won just 36% of their games. During his 6 seasons, the Bucs were tied for the 9th-best record in the league; in the previous six years, Tampa Bay won just one out of every three games, making them one of the league’s worst teams. But with Dungy, the more interesting question is did he do his best work here or with the Colts? Dungy had a better record in Indianapolis and coached there longer, but he certainly had a tougher task considering what he inherited at both spots. By this analysis, it’s almost perfectly even: Dungy improved the Colts’ all-time winning percentage by 3.0%, and he improved Tampa Bay’s mark by 2.9%. Dungy is the only coach to improve two teams by such a large amount; Don Shula is the only other head coach to improve two teams by at least two percent, and for him, the Colts were also his other team (Andy Reid ranks third by this metric; he improved the Eagles by 2.1% and the Chiefs by 1.8% so far). How bad have the Bucs coaches been? Dirk Koetter ranks as the third-best both by this metric and overall winning percentage, two facts I can’t wrap my head around. [continue reading…]

{ 0 comments }

All Time NFC West Teams, by Bryan Frye

Friend of the program Bryan Frye is back for another guest series. As regular readers know, Bryan operates his own fantastic site, http://www.thegridfe.com. You can view all of Bryan’s guest posts here, and follow him on twitter @LaverneusDingle.


This is post seven in an eight part series, so you know how this goes by now. I copy and paste some rules about the article to follow, then I write that article. Here are the rules:

  1. I write everything before my painkiller prescription runs out,
  2. I write it completely off the top of my head and don’t do any research,
  3. I don’t have to proofread this when I finish it, and
  4. Chase doesn’t edit my nonsense out of the article (so my inane asides and non sequiturs are our shared burden now). [1]Roster construction is as follows: 1 QB, 2 RB, 3 WR, 2 TE, 2 T, 2 G, 1 C, 2 DE, 2 DT, 2 OLB, 2 MLB/ILB, 3 CB, 2 S, 1 K, 1 P, 1 HC
  5. I maintain modern division designations. If a player played for the Seahawks when the team was in the AFC West, I am counting him in the NFC West. I have neither the time nor the inclination to make this 100% perfect.

Here’s the article about the NFC West.

Offense

Quarterback – Joe Montana

Sure, Steve Young was more efficient. Kurt Warner and Norm Van Brocklin led record setting offenses. But Montana was Montana, and that’s all I really have to say about that.

Running Backs – Marshall Faulk and Eric Dickerson [continue reading…]

References

References
1 Roster construction is as follows: 1 QB, 2 RB, 3 WR, 2 TE, 2 T, 2 G, 1 C, 2 DE, 2 DT, 2 OLB, 2 MLB/ILB, 3 CB, 2 S, 1 K, 1 P, 1 HC
{ 0 comments }

In this series, I will be looking at the history of coaches, quarterbacks, rushers, and receivers for all 32 franchises. For coaches and quarterbacks, I will be looking at how much their franchise’s career records (regular season only) would change if we removed the games with that person. For rushers and receivers, I will note how many times that player was the team’s leading rusher/receiver over the course of their time with that franchise (regular plus postseason).

Previous Teams:

AFC East: Dolphins, Bills, Jets, and Patriots
NFC East: Cowboys, Eagles, Giants, and Redskins
AFC North: Steelers, Browns, Ravens, and Bengals
NFC North: Packers, Vikings, Bears, and Lions
AFC South: Jaguars, Colts, Texans
NFC South: Panthers, Falcons, Saints

The Tennessee Titans history is really the history of the franchise owned by Bud Adams.  The son of an oil magnate, Adams was part of the foolish club with Lamar Hunt and the other key founding member of the AFL.  Adams named his Houston expansion team the Oilers, of course, and the team resided there until moving to Tennessee in 1997.  The man who guided the team from Houston to Tennessee was Jeff Fisher, who is still arguably the best coach in franchise history. In games coached by anyone but Fisher, the franchise has a 0.458 winning percentage, but including Fisher’s 0.542 mark in 142 games, and the Oilers/Titans franchise has a 0.482 record. Bum Phillips (whose ’78 and ’79 teams lost back-to-back AFC Championship Games to the eventual champion Steelers) and Jack Pardee (who guided the ’90s Run-N’-Shoot teams) are the only other coaches to finish at least 10 games over .500, while the franchise has had a number of coaches (Hugh Campbell, Ed Biles, Ken Whisenhunt, and Bill Peterson) who really struggled. [continue reading…]

{ 0 comments }

Brad Oremland is a sportswriter and football historian. What follows is Brad’s latest work, a multi-part series on the greatest players in pro football history.


This is the final article in a twelve-part series profiling the greatest professional football players of all time. You can find the rest of the series below:

Greatest Football Players: 111-125
Greatest Football Players: 101-110
Greatest Football Players: 91-100
Greatest Football Players: 81-90
Greatest Football Players: 71-80
Greatest Football Players: 61-70
Greatest Football Players: 51-60
Greatest Football Players: 41-50
Greatest Football Players: 31-40
Greatest Football Players: 21-30
Greatest Football Players: 11-20

If you haven’t read those yet, I hope you’ll start there. Each post can be read independently, but they’re intended as a series, and skipping to the end undercuts the historical excellence of the players you’re reading about. I’m confident you’ll enjoy this article more if you read the rest of the series first.

This series is nearly 100,000 words. If you’ve enjoyed it, please credit the three sportswriters whose work has influenced me most: the late Paul Zimmerman, Sports Illustrated‘s legendary Dr. Z, the greatest football writer who ever lived; Bill James, best known for popularizing baseball analytics (and indirectly football analytics as well) but also an immensely underrated writer; and Dave Heeren, unknown compared to Zimmerman and James, but his TENDEX system and Basketball Abstract were the foundation for all subsequent statistical analysis of basketball; his work captured my imagination and made me aspire to better understand the sports I loved. All three have my deepest admiration and gratitude.

And now, the ten greatest football players of all time. [continue reading…]

{ 0 comments }

In this series, I will be looking at the history of coaches, quarterbacks, rushers, and receivers for all 32 franchises. For coaches and quarterbacks, I will be looking at how much their franchise’s career records (regular season only) would change if we removed the games with that person. For rushers and receivers, I will note how many times that player was the team’s leading rusher/receiver over the course of their time with that franchise (regular plus postseason).

Previous Teams:

AFC East: Dolphins, Bills, Jets, and Patriots
NFC East: Cowboys, Eagles, Giants, and Redskins
AFC North: Steelers, Browns, Ravens, and Bengals
NFC North: Packers, Vikings, Bears, and Lions
AFC South: Jaguars, Colts, and Texans
NFC South: Panthers, Falcons

Without Sean Payton, the New Orleans Saints were one of the worst franchises in NFL history. The ‘Aints won just 40% of their games prior to Payton’s arrival in 2006; under his reign, New Orleans has a 0.615 winning percentage. Overall, the franchise now has 45% winning rate, which means “games under Payton” — despite representing just 24% of all Saints games — has increased the team’s overall winning percentage by 5%. That makes him one of just five head coaches to be responsible for a 5% increase in his team’s winning percentage, along with four inner circle Hall of Famers: Don Shula in Miami, Bill Belichick in New England, Paul Brown in Cleveland, and George Halas in Chicago. Payton and Jim Mora are the only two coaches in New Orleans history with a winning record. The table below shows each coach in Saints history. At the bottom you will see Mike Ditka, Hank Stram, and Bum Phillips, who won 63%, 62%, and 61% respectively of their games with Chicago, Kansas City, and Houston, before struggling as head coach of the Saints. [continue reading…]

{ 0 comments }

In this series, I will be looking at the history of coaches, quarterbacks, rushers, and receivers for all 32 franchises. For coaches and quarterbacks, I will be looking at how much their franchise’s career records (regular season only) would change if we removed the games with that person. For rushers and receivers, I will note how many times that player was the team’s leading rusher/receiver over the course of their time with that franchise (regular plus postseason).

Previous Teams:

AFC East: Dolphins, Bills, Jets, and Patriots
NFC East: Cowboys, Eagles, Giants, and Redskins
AFC North: Steelers, Browns, Ravens, and Bengals
NFC North: Packers, Vikings, Bears, and Lions
AFC South: Jaguars, Colts
NFC South: Panthers, Falcons

The Texans have only had three real head coaches in team history. Bill O’Brien has been Houston’s coach for the last five years, and has a 42-38 record. Gary Kubiak was the team’s longest-tenured coach and he went 61-64; he was fired with three games left in the 2013 season, and Wade Phillips replaced him and went 0-3 down the stretch. But the first coach in team history was Dom Capers, and he went 18-46 in four years. The Texans are 30 games under .500 for team’s history, and nearly all of that was due to the Capers era. He has dropped the team’s winning percentage by 5.0%, the largest amount of any coach in NFL history. Of course, he happened to coach the expansion version of the league’s newest franchise, so we can cut him a bit of slack. [continue reading…]

{ 0 comments }

In this series, I will be looking at the history of coaches, quarterbacks, rushers, and receivers for all 32 franchises. For coaches and quarterbacks, I will be looking at how much their franchise’s career records (regular season only) would change if we removed the games with that person. For rushers and receivers, I will note how many times that player was the team’s leading rusher/receiver over the course of their time with that franchise (regular plus postseason).

Previous Teams:

AFC East: Dolphins, Bills, Jets, and Patriots
NFC East: Cowboys, Eagles, Giants, and Redskins
AFC North: Steelers, Browns, Ravens, and Bengals
NFC North: Packers, Vikings, Bears, and Lions
AFC South: Jaguars, Colts
NFC South: Panthers

We have entered the Marion Campbell portion of the series. One of Football Perspective’s best guest profiles was on Marion Campbell, owner of some of the worst coaching records in history. He’s the only coach to win no more than 25% of his games over a 65+ game stretch with one team, and one of just four coaches (David Shula in Cincinnati, Dom Capers with the expansion Texans, and Gus Bradley with the Jaguars) to win less than 30% of his games with one franchise over at least 60 games. The most successful coach in Falcons history is, without question but still weird to say, Mike Smith. Atlanta as a franchise has won 44.2% of its games, but remove the Smith games, and that number drops by 2.34% to just 41.9%. And don’t feel too bad for the team’s first coach, Norb Hecker, who took over the expansion Falcons and went just 4-26-1. He wound up with eight NFL titles: one with the Rams in 1951 as a rookie safety, three with the Lombardi Packers, and then four with the 49ers in the ’80s. The table below shows every head coach in Falcons history: [continue reading…]

{ 0 comments }

All Time NFC East Teams, by Bryan Frye

Friend of the program Bryan Frye is back for another guest series. As regular readers know, Bryan operates his own fantastic site, http://www.thegridfe.com. You can view all of Bryan’s guest posts here, and follow him on twitter @LaverneusDingle.


As you know by now, I’m making all-time division teams while Chase is off on his honeymoon. I’ll spare you a verbose introduction and just lay out the rules:

  1. I write everything before my painkiller prescription runs out,
  2. I write it completely off the top of my head and don’t do any research,
  3. I don’t have to proofread this when I finish it, and
  4. Chase doesn’t edit my nonsense out of the article (so my inane asides and non sequiturs are our shared burden now). [1]Roster construction is as follows: 1 QB, 2 RB, 3 WR, 2 TE, 2 T, 2 G, 1 C, 2 DE, 2 DT, 2 OLB, 2 MLB/ILB, 3 CB, 2 S, 1 K, 1 P, 1 HC
  5. I maintain modern division designations. If a player played for the Seahawks when the team was in the AFC West, I am counting him in the NFC West. I have neither the time nor the inclination to make this 100% perfect.

Without further ado, here’s the NFC East.

Offense

Captain America

Quarterback – Roger Staubach

Sammy Baugh was a better player, but it’s hard to find a better pure quarterback than Captain America himself. Baugh (along with Troy Aikman, Drew Brees, and Kurt Warner) is the most accurate pure passer I have witnessed. But Staubach was in a league of his own as a leader. Not many guys come into a locker room as a rookie with instant credibility because of their military service. Even more impressive is that he backed it up with his play on the field and his actions off the field. [continue reading…]

References

References
1 Roster construction is as follows: 1 QB, 2 RB, 3 WR, 2 TE, 2 T, 2 G, 1 C, 2 DE, 2 DT, 2 OLB, 2 MLB/ILB, 3 CB, 2 S, 1 K, 1 P, 1 HC
{ 0 comments }

Brad Oremland is a sportswriter and football historian. What follows is Brad’s latest work, a multi-part series on the greatest players in pro football history.


Those of you who’ve been following me on Twitter (@bradoremland) may have seen the extension to this series that I began in response to reader feedback. I asked followers what they were most interested in beyond the Greatest Players of All Time series itself, and the response was a Just-Missed List, players 126-160, the 35 players I’m most apprehensive about leaving off the top 125 greatest players of all time.

As we approach the conclusion of the main series next week, the All-Time Top 10, here’s that list. It’s presented in no particular order, and since it’s adapted from Twitter, each entry is 280 characters or fewer.

Dave Casper
OAK 1974-80; HOU 1980-83; MIN 1983; RAID 1984
378 rec, 5216 yds, 52 TD
3 consensus All-Pro, 4 AP, 5 PB, All-1970s, All-Century

Maybe the best blocking TE ever, great hands, lots of TDs. Ghost in Ghost to the Post, recovered the Holy Roller. [continue reading…]

{ 0 comments }

In this series, I will be looking at the history of coaches, quarterbacks, rushers, and receivers for all 32 franchises. For coaches and quarterbacks, I will be looking at how much their franchise’s career records (regular season only) would change if we removed the games with that person. For rushers and receivers, I will note how many times that player was the team’s leading rusher/receiver over the course of their time with that franchise (regular plus postseason).

Previous Teams:

AFC East: Dolphins, Bills, Jets, and Patriots
NFC East: Cowboys, Eagles, Giants, and Redskins
AFC North: Steelers, Browns, Ravens, and Bengals
NFC North: Packers, Vikings, Bears, and Lions
AFC South: Jaguars
NFC South: Panthers

The Colts have been blessed with two Hall of Fame coaches, but oddly, one could argue that neither Tony Dungy nor Don Shula did their best work with the Colts. Both made their names in Florida: Shula as the long-time coach of the Dolphins, and Dungy as the man who turned around Tampa Bay. Still, these two have left a strong mark on Colts history: without Dungy, the Colts would have a losing record; overall, the team is 516-459-7. There’s another shared history between Dungy and Shula: immediate Super Bowl success after they left. When Dungy left Tampa Bay, the Bucs won the championship in the team’s first season without him. When Shula left for Miami, the Colts under Don McCafferty won the team’s first Super Bowl. But as much success as the franchise has had under these two coaches, it’s probably fair to say that the better way to understand this franchise is by examining their quarterbacks. But before we get to that, a moment to stop and pause for Weeb Ewbank, who was one of the two best coaches in Jets history and remains the only coach since World War II to win NFL titles as head coach of two different franchises. Ewbank did it in iconic style, beating the Colts in Super Bowl III as head coach of the New York Jets, and leading the Colts to a title against the New York Giants in The Greatest Game Ever Played. [continue reading…]

{ 0 comments }

Brad Oremland is a sportswriter and football historian. What follows is Brad’s latest work, a multi-part series on the greatest players in pro football history.


This is the eleventh article in a twelve-part series profiling the greatest pro football players of all time. You can find the previous installments below:

Greatest Football Players: 111-125
Greatest Football Players: 101-110
Greatest Football Players: 91-100
Greatest Football Players: 81-90
Greatest Football Players: 71-80
Greatest Football Players: 61-70
Greatest Football Players: 51-60
Greatest Football Players: 41-50
Greatest Football Players: 31-40
Greatest Football Players: 21-30

If you haven’t read those yet, especially the article introducing the series (111-125), I hope you’ll start there. Each post can be read independently, but they’re intended as a series, and skipping to the end undercuts the historical excellence of the players you’re reading about. It’s more meaningful, more impressive, and (I believe) ultimately more satisfying when you see how many dominant, mesmerizing, and exceptional players ranked below this. I’m confident you’ll enjoy this article more if you read the rest of the series first.

Best Players of All Time: 11-20

20. Ray Lewis
Inside Linebacker
Baltimore Ravens, 1996-2012
41.5 sacks; 31 INT, 503 yards, 3 TD; 19 FF, 20 FR, 3 yards
2 DPOY, 4 consensus All-Pro, 10
AP All-Pro, 13 Pro Bowls, 2000s All-Decade Team

In his 1997 All-Pro column, Paul Zimmerman (Sports Illustrated‘s peerless Dr. Z) identified Ray Lewis as “a human tackling machine, always around the ball.” In his 1998 All-Pro column, Zimmerman called Lewis “The Incredible Tackling Machine.” In his 1999 All-Pro column, “a guided missile, a tackling machine.” Ray Lewis could really tackle.

Several times in this series I’ve mentioned a problem for some of the players with great longevity: fans, especially younger fans, remember them as average to above-average older players rather than as the dynamic, game-changing monsters they were in their primes. Lewis is one of the players most afflicted, because in the second half of his career, announcers fawned over everything he did — and sometimes didn’t do. Lewis would assist on a tackle, and the announcer would declare, “Tackle made by, guess who, Ray Lewis,” implying that Lewis made all the tackles. One of his teammates would make a tackle, and Lewis would dive onto the pile, prompting the announcer to burble, “Ray Lewis with another tackle!” If Lewis wasn’t in on the play, the announcer wouldn’t mention the tackler at all. When aging legends get hyped this way, [1]Here’s an example: Week 13, 2010, Ravens at Steelers. With 3:46 remaining in the third quarter, Brandon McKinney and Lewis combined on a tackle. Al Michaels and Cris Collinsworth went into a … Continue reading it’s easy to dismiss them as overrated, with praise that exceeds their play. In the second half of his career, Lewis was overrated, though still a good player. In the first half of his career, he was — have you got this yet? — a tackling machine.

Lewis was instinctive and good at reading offenses, fast and decisive, and a big hitter. He had a non-stop motor, which is an underrated quality — less spectacular than speed, strength, or agility — but allowed Lewis to make plays his peers wouldn’t get to. He covered the field, sideline to sideline, as well as anyone. Lewis was an effective blitzer, with twelve seasons of 2 or more sacks, and he was exceptional in pass coverage, actually underrated in this aspect of his game. Lewis intercepted more than 30 passes, one of only half a dozen LBs to do so, and his 503 INT return yards are the second-most of any LB (Derrick Brooks, 530). As a point of comparison, Champ Bailey had 464 INT return yards. Lewis was a good pass defender and a good returner. Rodney Harrison and Ray Lewis are the only players since 1982, when sacks became an official statistic, with at least 30 sacks and 30 interceptions.

Lewis was the captain of consistently excellent defensive units, and the MVP of Super Bowl XXXV. He played on nine teams that ranked among the NFL’s top three in fewest points allowed and/or fewest yards allowed. The 2001 Baltimore Ravens ranked 4th in scoring defense and 2nd in total defense. The 2003 Ravens ranked 6th and 3rd. In between, the 2002 Ravens’ defense ranked 19th in scoring and 22nd in yardage. Ray Lewis was injured in 2002, missing 11 games.

Lewis had a complete game, strong everywhere you want an inside linebacker to be strong. His best seasons were the Marvin Lewis years, 1996-2001. Ray Lewis led the NFL in tackles in 1997, 1999, and 2001, but never in his final 11 seasons. A shoulder injury cost him most of the 2002 season, and following his 2003 Defensive Player of the Year effort, Lewis was a very good player rather than a great one. If you remember Ray Lewis mostly from the mid-2000s on, you didn’t see him in the seasons that made him a legend: a block-shedding dynamo, a wizard in pass coverage, and a hard-hitting, play-making, league-leading tackling machine. [continue reading…]

References

References
1 Here’s an example: Week 13, 2010, Ravens at Steelers. With 3:46 remaining in the third quarter, Brandon McKinney and Lewis combined on a tackle. Al Michaels and Cris Collinsworth went into a prolonged ecstasy over Lewis, and didn’t even mention McKinney. Lewis made a good but fairly routine play, and he didn’t even do it by himself. If you’re going to write Lewis a damn poem, the least you can do is mention that McKinney was in on the play, too.
{ 1 comment }

In this series, I will be looking at the history of coaches, quarterbacks, rushers, and receivers for all 32 franchises. For coaches and quarterbacks, I will be looking at how much their franchise’s career records (regular season only) would change if we removed the games with that person. For rushers and receivers, I will note how many times that player was the team’s leading rusher/receiver over the course of their time with that franchise (regular plus postseason).

Previous Teams:

AFC East: Dolphins, Bills, Jets, and Patriots
NFC East: Cowboys, Eagles, Giants, and Redskins
AFC North: Steelers, Browns, Ravens, and Bengals
NFC North: Packers, Vikings, Bears, and Lions
AFC South: Jaguars

The Panthers, like the Jaguars, entered the NFL in 1995. They have been almost exactly .500 through 24 seasons, and have had only four coaches. One of them, Ron Rivera, is 15 games above .500; two of them were right around .500, and George Seifert — the first, and the only member of was 16 games below .500. An interesting note: all four were defensive coordinators before becoming head coaches, meaning Carolina’s never had a head coach with an offensive background. [continue reading…]

{ 0 comments }
Next Posts Previous Posts