≡ Menu

All Time AFC North Teams, by Bryan Frye

Chase is a little preoccupied at the moment. I just had back surgery and have little else to but lay in bed. When Chase mentioned he needed some ideas to keep The Streak alive, I offered to make a series of posts briefly detailing my picks for each division’s all-time team. It’s a pretty straightforward concept that has probably been done before, and I’m fine with that. My version comes with a twist: as I warned Chase, I am on quite a few different medications and may not be functioning at 100%. Thus, my stipulations for writing this series are as follows:

  1. that I do it before my prescription runs out,
  2. that I write it completely off the top of my head and don’t do any research,
  3. that I don’t have to proofread this when I finish it, and
  4. that Chase doesn’t edit my nonsense out of the article.

Because I had the idea and made my own rules, I got to set up rosters however I wanted. I landed on the following: one quarterback, two running backs, three wide receivers, two tight ends, two tackles, two guards, one center on offense; and two defensive ends, two defensive tackles, two outside linebackers, two middle/inside linebackers, three cornerbacks, and two safeties on defense. I also went with a kicker and punter, but no return man because I’m lazy and did this for Chase off the top of my head at the eleventh hour.

I also maintained modern division designations. That means if a Packers player from the 1990s makes the team, he does so as part of the NFC North rather than the NFC Central. I don’t have all day, folks. [continue reading…]

{ 0 comments }

Brad Oremland is a longtime commenter and a fellow football historian. There are few who have given as much thought to the history of pro football as Brad has over the years. What follows is Brad’s latest work, a multi-part series on the best players in pro football history.


Best Players in Pro Football History: 111-125

I’m in semi-retirement as a football writer and historian, but my passion for pro football history hasn’t diminished even as my willingness to engage the modern game wanes. I recently re-read and admired the all-time pro football roster constructed by Bryan Frye following the 2014 season, and Bryan was gracious enough to offer me a platform for assembling my own all-time roster to challenge his. It was a fun exercise, and it required a lot of thought about the greatest players in history. That, in turn, led me to this project.

Over the next six weeks, I’ll reveal my personal list of the 125 best players in the history of professional football, with brief profiles on all of them. It’s probably the most ambitious sports project I’ve ever undertaken, so I hope you’ll be understanding about any disagreements. Inevitably, there are some heart-breaking omissions in any project like this. If I left off your favorite player, please understand that I didn’t “forget” him; I just had to make some hard choices. There are 280 players in the Pro Football Hall of Fame, and that doesn’t include active or recently retired players who have already established HOF-worthy legacies. There are historically great, Hall of Fame-caliber players who are not on my list of the top 125 — most of them, in fact. Making this list is a much higher standard than making it to Canton, and missing the list shouldn’t be interpreted as an insult.

Let’s be clear: making this list at any point indicates that I have extraordinary regard for that player. I would like to write about the players in exclusively positive terms, but since this series is organized as a ranking, some of the comments will highlight weaknesses by way of explaining why the player isn’t even higher. I try to anticipate arguments that a player should be ranked higher or lower, and tailor the summaries accordingly, but please don’t misinterpret these justifications as disrespect for the player’s accomplishments. Everyone on the list was (or still is) incredible. [continue reading…]

{ 1 comment }

NFL Field Goal Rates From 2014 to 2018

Field goal efficiency continues to improve in the NFL. Every once in awhile, it’s worth checking in on the league average rates to get a sense of “what’s normal” when it comes to NFL kickers. For example, it’s now expected that a 50-yard field goal will be successful. In fact, over the last 5 years, kicks from 50-53 yards were made nearly 70% of the time!

The graph below shows the NFL success rate on field goals over 4-yard increments. Even from 54-57 yards, kickers are now expected to make those kicks.

We can also use those rates to take a simple look at how each kicker has fared relative to league average, based on the length of their kicks. This covers all field goals from 2014 to 2018, and you won’t be surprised to see Justin Tucker as the NFL’s top kicker over that period.

RkPlayerFGAFGM%Exp FGMDiff
1Justin Tucker19517489.2%159.514.5
2Matt Bryant15513989.7%129.39.7
3Robbie Gould13812691.3%118.17.9
4Stephen Gostkowski19917889.4%170.47.6
5Matt Prater15713686.6%128.97.1
6Adam Vinatieri15813988%132.66.4
7Josh Brown706592.9%60.74.3
8Ryan Succop13511786.7%113.23.8
9Stephen Hauschka17615386.9%149.53.5
10Jason Myers1159784.3%94.12.9
11Josh Lambo1099486.2%91.62.4
12Wil Lutz1099486.2%91.82.2
13Harrison Butker726488.9%622
14Chris Boswell13011386.9%1112
15Greg Zuerlein16313683.4%134.11.9
16Shaun Suisham353291.4%30.51.5
17Michael Badgley222090.9%18.61.4
18Graham Gano16914384.6%141.61.4
19Jake Elliott706085.7%58.71.3
20Jason Sanders201890%17.10.9
21Dustin Hopkins11710085.5%99.30.7
22Ka'imi Fairbairn675785.1%56.40.6
23Garrett Hartley33100%2.60.4
24Daniel Carlson211781%170
25Johnny Hekker11100%10
26Sebastian Janikowski1139382.3%93.1-0.1
27Greg Joseph201785%17.2-0.2
28Shayne Graham353085.7%30.3-0.3
29Aldrick Rosas585086.2%50.3-0.3
30Jay Feely4375%3.4-0.4
31Dan Carpenter907684.4%76.4-0.4
32Dan Bailey14712283%122.5-0.5
33Brett Maher383078.9%30.6-0.6
34Patrick Murray494081.6%40.6-0.6
35Randy Bullock1109485.5%94.6-0.6
36Giorgio Tavecchio262180.8%21.7-0.7
37Travis Coons403587.5%35.9-0.9
38Nick Rose141178.6%12.2-1.2
39Mason Crosby16213684%137.5-1.5
40Kai Forbath1028684.3%87.6-1.6
41Matthew McCrane12866.7%9.7-1.7
42Cairo Santos13011084.6%111.8-1.8
43Chandler Catanzaro14412184%123.1-2.1
44Nick Novak1068984%91.1-2.1
45Younghoe Koo6350%5.2-2.2
46Zach Hocker141071.4%12.3-2.3
47Sam Ficken8562.5%7.3-2.3
48Alex Henery5120%3.6-2.6
49Andrew Franks393179.5%33.6-2.6
50Nate Freese7342.9%6-3
51Billy Cundiff292275.9%25.1-3.1
52Brandon McManus14912281.9%125.3-3.3
53Mike Nugent1119182%94.5-3.5
54Phil Dawson12710481.9%107.5-3.5
55Kyle Brindza12650%9.5-3.5
56Zane Gonzalez342470.6%27.7-3.7
57Cody Parkey12210283.6%105.8-3.8
58Connor Barth856981.2%72.9-3.9
59Josh Scobee362672.2%29.9-3.9
60Nick Folk977880.4%82.7-4.7
61Caleb Sturgis1169481%99-5
62Roberto Aguayo312271%27.1-5.1
63Blair Walsh1229678.7%102.7-6.7
{ 7 comments }

Thirteen years ago, Doug Drinen first looked at NFL player birth days (the month and the day, not the year) at the old PFR Blog. Six years ago, I took a second look at that study.  And over the last two days, I spent time looking not just at when NFL players were born, but when people are born in the United States. Today is a continuation of those studies.

There have been 17,027 players to enter the NFL and play in a game since 1970.  Given what we know about the birth rate in the United States, we can then estimate how many NFL players should have which birth date.  For example,  the most common birthday, according to one study, is September 9th.  Roughly 0.303% of all U.S. babies are born on this day, which means we would “expect” there to be 51.5 players in this time period with 9/9 birthdays. It turns out that there have been 48, which is pretty close. September 8th is the date with the most NFL players since 1970 — 72 — compared to an expected result of 50.2 players.

Those are just two dates, of course, so let’s look at the entire calendar. I performed this same calculation for every date.  As it turns out, January 1st is the biggest outlier: it is a very rare day for babies to be born, but it’s actually an above-average day for NFL players.  More on that in a minute.  To smooth out the chart, I looked at 31-day periods, so the month of July would be captured by looking at July 16th on the draft (each data point represents that day, along with the 15 days before and after).

Two other notes.  For the ends of the year — early January and late December — I pro-rated the numbers to make them work while still using just calendar year cut-offs. [1]Specifically, here’s what I did.   For days before January 7th, I excluded due to small sample size.  Beginning on January 7th, I looked at the 7 days from the 1st to the 7th, and then … Continue reading The blue line represents the actual number of NFL players born in each 31-day window.  The orange line? That represents the estimated number of NFL players based on the birth rates for the United States. [continue reading…]

References

References
1 Specifically, here’s what I did.   For days before January 7th, I excluded due to small sample size.  Beginning on January 7th, I looked at the 7 days from the 1st to the 7th, and then multiplied that result by 31 divided by 7.  For January 8th, I looked at the players born from the 1st to the 8th, and multiplied that result by 31 and divided by 8.  And so on, until I got to January 16th. I used the same methodology for the end of December.
{ 0 comments }

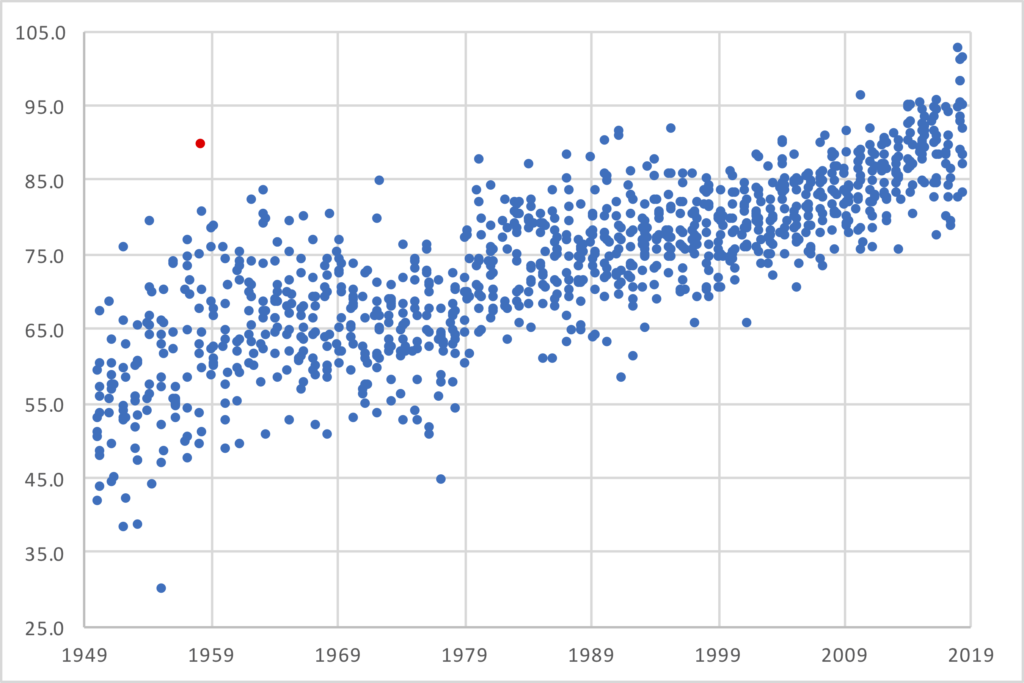
The graph below shows the passer rating in every week of every NFL season since 1950. The red dot at the top left? That’s the passer rating from week 7, 1958, when six games all took place on Sunday, November 9th.

November 9th, 1958 should be remembered as the greatest passing day of the NFL’s first 50 years. It was a star-studded day with names even modern fans will recognize. Two of the best quarterbacks of the 1960s, Bart Starr and Norm Van Brocklin, were starters that day, while the 49ers saw both future MVP John Brodie and Hall of Famer Y.A. Tittle take the field. And all four lost. [continue reading…]

{ 1 comment }

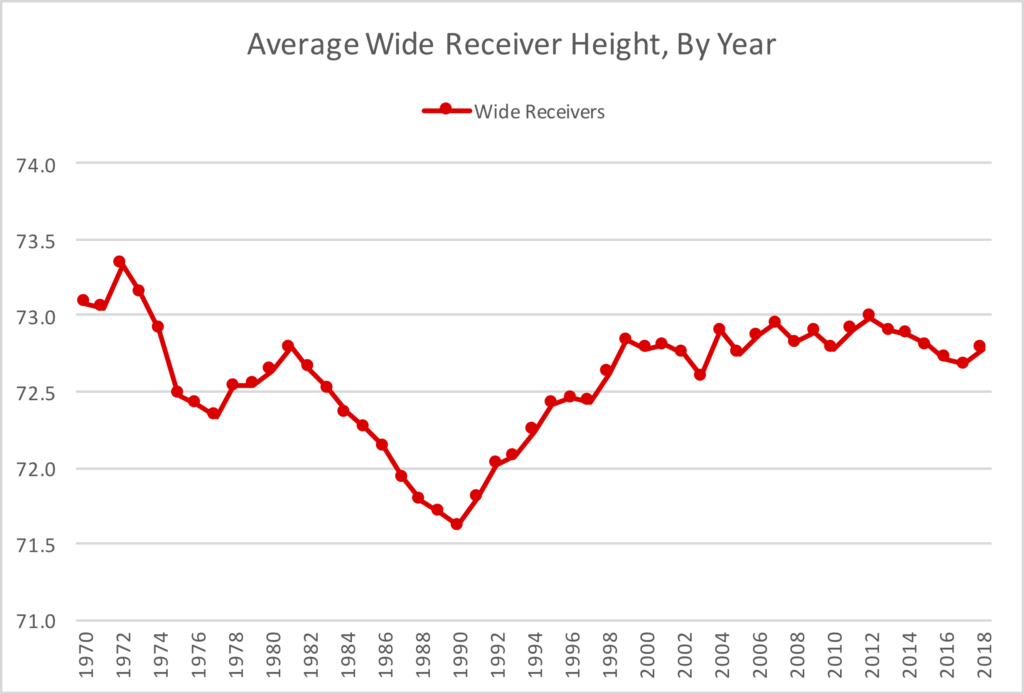
In 1973, the top five fantasy wide receivers were 6’8 Harold Carmichael, 6’3 Charley Taylor, a pair of 6’1 guys in John Gilliamand Isaac Curtis, and 5’10 Harold Jackson.

In 1988, the top five fantasy wide receivers were 6’2 Jerry Rice, a pair of 5’11 players in Henry Ellard and Ricky Sanders, and a pair of 5’9 targets in Mark Clayton and Drew Hill.

Ten years later, in 1998, the top five fantasy wide receivers were a pair of 6’4 wideouts in Randy Moss and Keyshawn Johnson, a 6’3 Terrell Owens, a 6’2 Eric Moulds, and a 6’1 Antonio Freeman. 6’3 Cris Carter was the sixth-ranked fantasy wideout.

Those years are representative of the broader trend in the NFL: the “average” wide receiver was a bit over six feet tall throughout the 1970s and through 1985; during the ’80s, receivers kept getting shorter, and the “average” receiver was just 71.6 inches tall — also known as a hair under six feet — in 1990. During the ’90s, however, the trend reversed, and by 1998, the “average” receiver once again looked like he did (from a height perspective, at least) prior to the mid-’80s. The “average” wide receiver now is consistently just shy of 6’1 tall, league-wide.

What do I mean by average? I took the height of every wide receiver in the NFL each year, and then took a weighted average of those players based on the number of receiving yards they had. This means a 6’3 receiver with 1200 yards counts three times as much as a 5’10 receiver with 400 yards when determining the weight of the “average” wide receiver in the NFL in a given season. Take a look:

[continue reading…]

{ 4 comments }

Yesterday, I noted that in 2018, Josh Rosen produced one of the least valuable passing seasons ever. One reason that Rosen had so much negative value attributed to his stats is because he took 80% of all Arizona dropbacks last year. So while Rosen was bad, the results look different if we examine things on the team level.

In fact, two other Cardinals passing attacks were worse. In 2012, Arizona had three passers with over 180 dropbacks — John Skelton, Kevin Kolb, and Ryan Lindley — and a fourth (Brian Hoyer) with 57 dropbacks. Collectively, the group averaged 3.42 ANY/A (compared to 3.68 in 2018). The league average was 5.93 that season (and 6.32 last year), and Arizona had a whopping 666 pass plays that season. As a result, the 2012 Cardinals finished 1,672 adjusted net yards below average, the second worst in NFL history. (The 1999 Cardinals, with Jake Plummer, also check in as slightly worse than the 2018 Cardinals; more on them in the table below). [continue reading…]

{ 0 comments }

One of my favorite articles was written back in 2012, and the idea began during my law school days.

One of my law school professors was very quirky, even by law school professor standards. His preferred examination method was multiple choice, but with a twist. After grading each exam, he would then divide the students into quarters based on their test score. He would then re-examine each question, and measure how the top quarter of students performed on each question relative to the bottom quarter. Any question that more bottom-quarter students answered correctly than top-quarter students would be thrown out, and the exam would be re-graded. As he delicately put out, ‘if the wrong students are getting the question right, and the right students are getting the question wrong, it’s a bad question.’

NFL passing records are falling for a variety of reasons these days, including rules changes and league policies that make the passing game more effective. But there’s another reason: for the first time in awhile, the right people are throwing the most passes in the league. And there’s no better example of that than Drew Brees. Since coming to the Saints in 2006, he’s ranked 1st or 2nd in pass attempts four times, and ranked in the top three in net yards per attempt four times. But even since ’06, we’ve seen the passing game evolve, as the best quarterbacks are now the most likely ones to finish near the top of the leaderboard in pass attempts. In 2010, Peyton Manning had his first 600-attempt season… when he threw 679 passes for the Colts. Tom Brady threw 611 passes last year for the 13-3 Patriots, making New England one of just three teams to threw 600 pass attempts and win 13 or more games in a season. The other two teams? The ’09 Colts and the ’11 Saints.

In this early 1970s, the best passing teams often didn’t throw very often. In 1972, the top four teams in ANY/A — the Dolphins, Redskins, Giants, and Jets — all ranked in the bottom half of the NFL in pass attempts. And as I wrote in a 2014 update, there is a way to measure whether the best passing teams in the NFL are also the most frequent passing teams:

[W]hen we say the average completion percentage in the NFL is 61.2%, this is generally assumed to reflect the fact that in 2013, there were 18,136 passes thrown in the NFL, and 11,102 of them were completed.

An alternative method of measuring completion percentage in the NFL is take the average completion percentage of each of the 32 teams. That number won’t be very different, but it won’t be identical, either. The difference, of course, is that this method places the same weight on each team’s passing attack when determining the league average. The former, more common method, means that the Cleveland Browns make up 3.755% of all NFL pass attempts and the San Francisco 49ers are responsible for only 2.299% of the league-average passing numbers. The latter method puts all teams at 3.125% of NFL average.

Believe it or not, that background presents an interesting way to look at how the NFL has become more of a passing league.

For example, let’s look at the 1972 season. Miami led the NFL in points scored and in rushing attempts, while ranking 24th out of 26 teams in pass attempts. Does this mean the Dolphins weren’t a good passing team? Of course not; in fact, Miami had the highest Adjusted Net Yards per Attempt average of any team that season! That year, only two teams threw over 400 passes: New England and New Orleans. And both teams were below-average in ANY/A, with the Patriots ranking in the bottom three.

In 1972, the average pass in the NFL gained 4.28 Adjusted Net Yards. But an average of each team’s ANY/A average was 4.34, because good passing teams like Miami and Washington passed less frequently than bad passing teams like New England and New Orleans. The league-wide average was only 98.5% of the “average of the averages” average; whenever that number is less than 100%, we can conclude that the better passing teams are passing less frequently.

The graph below shows the passing data for the 32 teams in the NFL in 2018. The X-Axis shows each team’s Adjusted Net Yards per Attempt average; the Y-Axis shows each team’s number of dropbacks (pass attempts plus sacks). In a league where the teams with the best quality of passing attacks also have the most quantity of pass plays, the data will generally fit a line that slopes up and to the right. That’s not quite the case here, but there is a positive relationship between the two variables. Yes, the Saints were very efficient but didn’t pass very often, but the Chiefs led the NFL in ANY/A and were 12th in passing dropbacks, while the Falcons were 3rd in ANY/A and 5th in dropbacks. And the bottom three teams in dropbacks — the Jets, Bills, and Cardinals — all ranked in the bottom 10 in ANY/A.

In 2018, the NFL as a league averaged 6.32 ANY/A. However, if you average the ANY/A averages of each of the 32 teams, you get an average of 6.29. This means the average ANY/A was equal to 100.5% of the “average of the averages” ANY/A; that result only exceeds 100% when the better passing teams pass more frequently than the weaker passing teams. Twenty years earlier, in 1998, the league as a whole averaged 5.31 ANY/A, but an average of each team’s ANY/A would give you a result of 5.34. That’s because by assigning the same weight to each passing offense, you would have a higher result in 1998 than if you weighted efficiency by pass attempts because in 1998, weaker passing teams passed more often than stronger passing teams.

The graph below shows the relationship between these two variables. In short, it shows for each season since 1970, the league-wide ANY/A average divided by the ANY/A average for each of the teams in the league that year. A result of more than 100% means the better passing teams passed more often than the weaker passing teams.

Pretty neat, right? And at least in 2018, the better passing teams passed more often than the weaker passing teams.

{ 1 comment }

Rob Gronkowski Was An Outlier In Yards per Reception

Rob Gronkowski has retired from football, at the age of 29. At his peak, Gronk was the most dominant tight end of all time. He excelled at so many things and in so many ways: a remarkable red zone scorer, a tremendous blocker, a clutch receiver, and a consistent producer. From 2011 to 2017, Rob Gronkowski averaged 67.5 yards per game in all seven seasons; all other tight ends in the NFL combined to do that…. 7 times (Jimmy Graham twice, Travis Kelce twice, and Delanie Walker, Jordan Reed, and Greg Olsen once each).

But one of Gronk’s statistics that most interests me is his remarkable yards per catch, particularly given his size. The graph below shows the 300 players with the most receiving yards in pro football history. The X-Axis shows player weight; the Y-Axis shows yards per catch. This graph includes running backs, wide receivers, and tight ends, so lots of running backs are at the bottom of the graph. But what sticks out — as you would suspect — is how bare the upper right portion chart appears. In other words, players who weigh a lot typically don’t have high YPC averages. [continue reading…]

{ 2 comments }

Why Do Teams Run The Ball, Part III

It was 11 years ago that I first asked the question, why do teams run the ball? And then four years ago, I revisited that post. Today, a further update.

Let’s begin by measuring how effective teams have been, on average, at both running and passing. To measure rush efficiency, we will use Adjusted Yards per Carry, which is calculated as follows:

(Rush Yards + 11 * Rush TDs + 9 * Rush First Downs) / (Rushes)

For passing, we will use a modified version of ANY/A by also giving credit for first downs. Here’s the formula:

(Gross Pass Yards – SackYardsLost + 11 * Pass TDs + 9 * Pass First Downs – 45 * INTs) / (Pass Attempts + Sacks)

[continue reading…]

{ 1 comment }

New England Finally Has A Better Record Than Miami

Let’s flash back to the end of November 1993.  The Patriots were 1-10 in their first season under Bill Parcells.  The Dolphins had just defeated the Cowboys on Thanksgiving in the Leon Lett game to get to 9-2. And these records were consistent with the level of success each franchise had achieved. At that point in time, New England’s franchise record was an underwhelming 217-269-9, which translates to a 0.447 winning percentage. Miami, meanwhile, was one of the best franchises in league history, with a 253-154-4 record, a 0.620 winning percentage.

But things have been very different since then. Miami lost their final 5 games of the regular season, while the Patriots ended the year on a 4-game winning streak.  And, you know, lots of good things for happened for New England since then, too.

As crazy as this might be for younger fans to believe, the Dolphins *still* had a better franchise record than the Patriots entering the 2018 season. Miami was 445-351-4, a 0.5588 winning percentage, while New England was at 489-386-9, a 0.5583 winning percentage.

On the morning of October 21, 2018, the Dolphins and Patriots were both 4-2, slightly upping Miami’s franchise winning percentage to 0.5596 and New England’s to 0.5590. That afternoon, Miami would lose to the Lions while New England would beat the Bears. While this was not a big story at the time, it was a momentous moment for the two franchises: the Dolphins were now 449-354-4, giving them a 0.5589 winning percentage, while the Patriots were 494-388-9, a 0.5595 winning percentage.

It means, after all these years, the Patriots finally had a better franchise record than the Dolphins. And, of course, New England didn’t let up. As of the end of the 2018 season, the Dolphins have a franchise record of 452-360-4 (0.556), while New England is 500-391-9 (0.561). [continue reading…]

{ 0 comments }

Matt Stafford (And Other Passers) Through Age 30

A few days ago, I noted that Falcons wide receiver Julio Jones turned 30 years old on February 3, 2019, and he held the record for receiving yards through age 29.   Well, on February 7, 2019, Lions quarterback Matt Stafford turned 31 years old.  The two former SEC stars played each other once, in 2008, but that was it: Stafford entered the league in 2009 at the age of 21, while Jones waited until he was 22 years old and entered the 2011 draft. But both have been very productive in the NFL: Stafford is now the record-holder in passing yards through age 30.

Is Stafford in play to set the all-time record in passing yards? It’s tough to say, but I’d argue that he’s got a better chance than Jones, just because of the way age seems to impact quarterbacks in modern times relative to wide receivers.  This graph shows how many career passing yards, at each age X, each of Stafford, Peyton Manning, Brett Favre, Tom Brady, Drew Brees had: [continue reading…]

{ 0 comments }

2018 Era-Adjusted Passer Ratings

Two years ago, I wrote a six-part series on adjusting passer ratings for era.

Last year, after the 2017 regular season ended, I posted the single-season results and also updated the career ratings. Today is the 2018 update.

Passer rating is made up of four variables: completion percentage, yards per attempt, touchdown percentage, and interception percentage. The reason passer rating needs to be adjusted for era? Well, that’s pretty simple to explain.

When the formula was derived in the early ’70s, an average rating in each variable was achieved with a 50% completion rate, averaging 7.0 yards per pass attempt, a 5% touchdown rate, and a 5.5% interception rate.  Since those numbers are wildly out of date, I came up with a formula that perfectly matches the intent of passer rating but ties the variables to the league average in any given season. You can get the formulas and read more background in the linked posts.

In 2018, the four averages were 64.9%, 7.37, 4.79%, and 2.37%. The big changes, of course, are in completion percentage and interception rate; yards per attempt is much more stable throughout history (although 2018 was higher than in recent years), while touchdown rate is actually slightly lower than it was in the ’70s.

One thing to keep in mind: these adjustments will not change the order of passer ratings in a given season. So Drew Brees, Patrick Mahomes, Russell Wilson, Matt Ryan, Philip Rivers will remain your top 5 leaders; the way the formula works, it simply subtracts a fixed amount from each passer’s actual passer rating. In 2018, that amount was an enormous 26.3 points from each passer. [continue reading…]

{ 1 comment }

Tom Brady Has Had Three Great and Distinct Mini-Careers

Tom Brady has had a remarkable career, and it doesn’t appear that he’s done adding to his legacy. But for now, I’d like to analyze Brady’s passing performance for each season of his Hall of Fame career.

Every season is different, and some stats do a decent job of describing a player in some years, but fail in others. Passer rating, total yards, touchdowns, and interceptions sometimes work, but can also paint very misleading pictures. But if you want to use one stat consistently, I always suggest using Adjusted Net Yards per Attempt, which is the best basic metric to measure a passer’s performance. ANY/A is simply yards per attempt with a 45-yard penalty for interceptions, a 20-yard bonus for touchdown passes, and appropriate inclusions for sacks and yardage lost on sacks. And if you want to measure ANY/A in different seasons, it’s best to compare a player’s ANY/A average to league average, to get his Relative ANY/A in each season.

I went ahead and calculated Brady’s RANY/A for each season of his career. For example, in 2007, playing with Randy Moss and Wes Welker, Brady averaged 8.88 Adjusted Net Yards per Attempt, the best of his career. The league average ANY/A that year was 5.52, giving Brady a Relative ANY/A of +3.36. Meanwhile, in 2002, a still green Brady averaged just 5.54 ANY/A when the league average ANY/A was 5.35. That gives Brady a RANY/A of +0.19, the worst of his career — which, by the way, was still above league average. Yes, Brady has been a starter for 17 seasons (all analysis today discards his ’00 and ’08 seasons, when he combined to throw 14 passes) and has had above-average passing stats in each year. Remarkable.

The graph below shows Brady’s Relative ANY/A, plotted on the Y-Axis from -4.0 to 4.0, in each season of his career. The first thing that stands out to me is how all of the data is plotted in the top half of the graph: that’s because every season is above average. The X-Axis shows season, with a gap around his injured ’08 campaign. Finally, I have plotted the graph in Patriots red and blue, but placed gold circles around his six Super Bowl-winning seasons: ’01, ’03, ’04, ’14, ’16, and ’18. [continue reading…]

{ 0 comments }

There have been 52 Super Bowl games played so far, but they have featured just 17 upsets. But a Super Bowl upset was once extremely rare. The Jets and Chiefs produced the first two Super Bowl upsets, in Super Bowls III and IV, respectively. But then there wasn’t a single Super Bowl upset during the decade of the 1970s! (Excluding, of course, Super Bowl IV, which concluded the 1969 season but took place on January 11th, 1970).

In the 1980s, there were 4 Super Bowl upsets, all featuring the Raiders or the Redskins (or both). Oakland beat Philadelphia in 1980, Washington beat Miami in 1982, the Raiders beat the Redskins in ’83, and the Redskins upset the Broncos in ’87. All featured point spreads of 3.5 or fewer points, in contrast to the two double digit upsets from the AFL teams.

In the ’90s, there were just TWO upsets in the Super Bowl: the Giants over the Bills and the Broncos over the Packers. When Tom Brady and the Patriots took the field as underdogs in Super Bowl XXXVI, but 8 of the first 35 Super Bowls had featured upsets. But beginning with that first Patriots/Rams Super Bowls, there have been a whopping 9 upsets in 17 games (and the denominator is really 16 here, since one Super Bowl had an even point spread and therefore couldn’t feature an upset)! In other words, we’ve gone from an upset happening less than 25% of the time to an upset happening over 50% of the time.

Beginning with the first Patriots Super Bowl, and excluding the New England/Seattle Super Bowl (which featured the even points spread), there have been 16 Super Bowls with a favorite during the Brady/Belichick era. Of those 16 Super Bowls, the favorites have lost 9 times, and failed to cover in 3 of the 7 times that they actually won! There have been just 6 times in Super Bowl history that the favorite won but failed to cover the point spread, so that means half have occurred in relatively recent history.

From 1966 to 2000, favorites went 22-11-2 against the spread during the first 35 Super Bowls. In the 16 Super Bowls since 2001 to feature a favorite, those favorites have gone just 4-12 against the spread. The graph below shows the point spread (in red) and margin of victory (in blue) for the Super Bowl winner in each game. The point spread is shown as an expectation of how much the winner was expected to win by (so the Jets in Super Bowl 3, rather than shown as +18, are shown as -18). All Super Bowl upsets feature red bars that are negative.

What stands out to you?

{ 0 comments }

The engineers driving football’s best offense

The 2018 Kansas City Chiefs had a remarkable offense.  Behind head coach Andy Reid and quarterback and MVP Patrick Mahomes, the Chiefs led the NFL in scoring with 565 points.  Kansas City joined the 2007 Patriots and 2013 Broncos as the only teams with 50+ passing touchdowns and 15+ rushing touchdowns, as the Chiefs scored a whopping 66 offensive touchdowns (and 5 more on defense/special teams).  But Kansas City’s offensive skill position players were not highly drafted, and that makes the Chiefs a pretty notable case.

A lot of great offenses are driven, unsurprisingly, by highly drafted skill position players. The 2007 Patriots had Randy Moss (1st round), and then Ben Watson (1st), Laurence Maroney (1st) and Jabar Gaffney (2nd) to go along with undrafted Wes Welker.

The Greatest Show On Turf Rams had high 1st round picks in Marshall Faulk and Torry Holt, along with #33 overall pick Isaac Bruce.

The Colts for much of the Peyton Manning era had 1st round picks in Marvin Harrison, Reggie Wayne, Edgerrin James, and Dallas Clark. And Manning’s 2013 Broncos had 5 players with double digit TDs: first round picks in Demaryius Thomas and Knowshon Moreno, and later picks in Julius Thomas (4th round), Eric Decker (3rd round), and undrafted Wes Welker.

The 1998 49ers had 1st round picks in Garrison Hearst, Jerry Rice, and J.J. Stokes. The ’94 49ers had Jerry Rice, Ricky Watters, Steve Young, and William Floyd. And the list goes on and on.

But there are some teams that the overwhelming majority of touchdowns came from 3rd round picks or later. For example, the 1984 Dolphins had Mark Clayton (18 TDs, 8th round), Woody Bennett (8 TDs, undrafted), Nat Moore (6 TDs, 3rd round) and Bruce Hardy (5 TDs, 9th round). Only Pete Johnson (9 TDs, 2nd round) and Mark Duper (8 TDs, 2nd round) were higher picks, among the team’s leading scorers.

The 2011 Saints top four leaders in touchdowns were Jimmy Graham (3rd round), Darren Sproles (4th), Marques Colston (7th), and Lance Moore (undrafted). The next four players were Pierre Thomas (undrafted), Robert Meachem (1st round), Mark Ingram (1st round), and Jed Collins (undrafted).

Still, the 2018 Chiefs stand out from this pack, at least if you group together all players taken in the 3rd round or later. [1]By the Jimmy Johnson Draft Value Chart, 83% of all draft value resides in the top 64 picks. Even in my draft value chart, which is more representative of actual value rather than trade value, 63% of … Continue reading A whopping 92% of Kansas City touchdowns came from such players, an almost unheard of margin for an elite offense. Take a look: [continue reading…]

References

References
1 By the Jimmy Johnson Draft Value Chart, 83% of all draft value resides in the top 64 picks. Even in my draft value chart, which is more representative of actual value rather than trade value, 63% of draft value comes from the top 64 picks.
{ 0 comments }

The 1981 San Diego Chargers led the NFL in points and yards, but ranked 26th in points allowed and 27th in yards allowed in a 28-team NFL. The Chargers made it to the AFC Championship Game, but had the poor fortune of playing in Cincinnati in a game with -32 degree wind chill. The game wound up being known as the Freezer Bowl, and the Chargers lost 27-7. San Diego might have been better off playing in 2018.

The table below shows where each of the final four teams rank in points, yards, points allowed, and yards allowed, along with each team’s average rank of the two offensive categories and average rank of the two defensive categories. The final column shows the difference between the team’s offensive and defensive ranks, as a way of describing whether a team is offensive-powered or defensive-powered.

YearTeamPF RkYd RkPA RkYA RkAvg Off RkAvg Def RkOff Heavy
2018NOR3814145.5148.5
2018NWE457214.5149.5
2018LAR222019219.517.5
2018KAN112431127.526.5

Let’s use the Saints as an example. New Orleans ranks 3rd in points for and 8th in yards, while ranking 14th in points allowed and 14th in yards allowed. Therefore, New Orleans has an average offensive rank (3, 8) of 5.5, and an average defensive rank of 14 (14,14). The Saints are considered offensive heavy to the tune of 8.5 slots (14 minus 5.5). And that makes the Saints the least offensive-heavy team remaining in the final four.

The graph below shows the average offensive rank (taking the average of each team’s rank in points and yards) and defensive rank for each of the final four teams in each season since the merger. As you can see, this is a heavily-slanted year for offense: [continue reading…]

{ 1 comment }

The Kansas City Chiefs led the NFL in scoring in 2018, and fielded the third highest scoring team in NFL history. But that doesn’t always lead to playoff success. Since 2000, just one team that led the NFL in scoring has won the Super Bowl.

The table below shows all teams to lead the NFL (or combined AFL/NFL) in the Super Bowl era, and how those teams fared in the playoffs. [continue reading…]

{ 0 comments }

Through 14 games this season, Alabama outscored its opponents by 31.5 points per game. Last night, in the most shocking national championship game I can remember, Clemson dominated Alabama in historic fashion. The Tigers beat Alabama 44-16, a 28-point margin of victory against a Nick Saban Alabama team that in 12 seasons had never lost a game by more than 14 points.

No team in NFL history has outscored opponents by 20 points per game and then lost a playoff game by 20+ points. The closest comparisons:

  • The 1967 Raiders outscored opponents by 16.8 points per game. Oakland defeated Houston 40-7, to up its average points differential per game to 17.9 through 15 games. Then, in the Super Bowl against the Packers, Oakland lost by 19 points, 33-14.
  • The 1969 Vikings outscored opponents by 17.6 points per game.  After a couple of close playoff wins, Minnesota lost Super Bowl IV by 16 points, 23-7.

In more recent times: the 2012 Patriots outscored opponents by 14.1 points and lost in the playoffs by 15 points, the 2013 Broncos outscored opponents by 12.9 points and lost by 35 points, and the 2011 Packers outscored opponents by 12.6 points and lost by 17 points.

My first reaction was to think of the 1983 Redskins: that year, Washington outscored opponents by 13.1 points and lost by 29 points.

What I wanted to do was plot team points differential in the regular season against each team’s worst playoff loss.  I plotted regular season points differential on the X-Axis and worst playoff margin on the Y-Axis; then I realized we just want to focus on the bottom right quadrant of that graph (positive regular season points differential, negative playoff margin).  So here is that bottom right quadrant of the graph: [continue reading…]

{ 0 comments }

Parity Does Not Exist In The 2018 NFL

With three weeks left, the NFL playoff picture is nearly complete.  In the AFC, the Chiefs, Patriots, and Chargers are all going to make the postseason; in 2017, Kansas City and New England won their divisions, and the Chargers won 9 games.

The Steelers and Ravens are favorites to go to the postseason; Pittsburgh won the AFC North last year, and Baltimore won 9 games.  The AFC South will likely go to Houston, and that would be the only “surprise” in the AFC this year.  The Texans won just 4 games last year, although expectations were much higher this year with a healthy Deshaun Watson.  The Titans, who made the playoffs last year, are still technically in the hunt for the division title, which would make the AFC (lack of) turnover even more extreme.

Things aren’t much different in the NFC.  The Saints and Rams have already clinched their division titles for the second year in a row. The Seahawks and Cowboys, who each won 9 games last year, will likely be in the postseason this year.  The Bears are the Texans of the NFC, going from 5-11 to division champion with a first round quarterback from the 2017 Draft.  Nobody in the NFC wants the 6th spot, but the Vikings — who went 13-3 last year — are the current favorite.

Think about that: if the season ended today, then 10 of the 12 playoff teams in 2018 had a winning record in 2017. There is still time for the Dolphins or Colts to snag the 6 seed in the AFC from the AFC North runner up, but in the NFC, the Eagles and Panthers (who both won 11+ games last year) are on deck for the 6 seed if the Vikings falter.

How does that compare to prior years? Assuming 10 of the 12 2018 playoff teams — 83% — had a winning record in 2017, that would stand out as a pretty big outlier. It would mark a reversion to the 1980s, pre-salary cap and free agency era of the NFL, where parity didn’t play a central role. The graph below shows, for each year since 1970, the percentage of teams that made the postseason and had a winning record the prior year. [continue reading…]

{ 0 comments }

Reid looks up at the scoreboard and sees more points

Tonight is one of the games of the year: the 9-1 Chiefs against the 9-1 Rams. This is perhaps the best regular season game, by record, since another primetime game featuring Andy Reid’s Chiefs back in 2013, when the 9-0 Chiefs traveled to Denver to face the 8-1 Broncos.

Back then, I wrote about the best regular season matchups ever. And I’ve also written about the worst regular season matchups ever. And to be clear, there’s no right or wrong way to identify the best or worst matchup ever, even if you just base things on record.

You can’t use just winning percentage, because it’s hard to compare teams who have played a different number of games (is a matchup of two 3-0 teams better than a matchup of two 9-1 teams? I don’t think so, but winning percentage says otherwise). One solution is to add 11 games of .500 football to each team; in other words, add 5.5 wins and 5.5 losses to each team. For the Chiefs and Rams, that would make both teams 14.5-6.5, which translates to an adjusted winning percentage for both Kansas City and Los Angeles of 0.690. A game between two 3-0 teams would have an average adjusted winning percentage of only 0.607, which is one reason why I like this formula.

So where does Rams/Chiefs rank? With all due respect to the classic 49ers/Browns games from 1948, I’m limiting today’s post to games since 1950. And tonight’s matchup is the 20th best game during that period. The table below shows the best matchups in the NFL since 1950. Each game is listed from the perspective of the winner, and displays each team’s each team’s adjusted winning percentage and the average of the two adjusted records. Finally, I’ve included a linkable boxscore to each game. [continue reading…]

{ 0 comments }

Aaron Rodgers On Pace To Set Interception Record

Aaron Rodgers has thrown just one interception in 10 games this year. That’s 1 interception on a league-high 385 pass attempts. And this was it:

Damon Huard (2006) holds the current record for interception rate in a season at 0.4%; he threw 1 interception on 244 passes, so to beat him, a quarterback would need to either throw no interceptions and 224 passes (to qualify), 1 interception on more than 244 passes, 2 interceptions on more than 488 passes, or 3 interceptions on more than 672 passes. Rodgers has 1 interception so far this year on 385 pass attempts (0.26%!); he has room to throw one more interception this year and still win the crown, but he probably doesn’t have wiggle room to throw two more.

Josh McCown (2013) had 1 interception on 224 pass attempts (0.4%), putting him second all-time on the single-season list. Tom Brady (2016), Nick Foles (2013), Tom Brady (2010), Dak Prescott (2016), Steve DeBerg (1990), Sam Bradford (2016), and David Garrard (2007) are the only other players to throw fewer than 1 interception for every 100 passes in a season, min 14 pass attempts per team game. (Oh, and Drew Brees has a 0.3% interception rate this year, too: he has 1 interception on 304 passes).

Interceptions rates have plummeted, of course, so it’s hard to truly compare this season by Rodgers to some of the low interceptions of years past. Here’s the league average interception rate in every season since 1970:

Another thing that makes Rodgers’ 2018 interception rate so interesting, particularly compared to Brees, is that Rodgers has thrown a lot of incomplete passes. In fact, he’s thrown more than twice as many incomplete passes as Brees — 147 to 69. The graph below shows every player this season with an interception (no regular quarterback has zero interceptions). The X-Axis shows interceptions; the Y-Axis shows incomplete passes. Rodgers really stands out here, and while you didn’t need the help finding him, I colored his dot in Packers colors:

Rodgers is tied with Joe Flacco for the league lead in incomplete passes at 147, and yet he is also tied with Brees for the fewest interceptions among qualifying passers. That’s how extreme Rodgers has been this year. Consider that Rodgers has thrown an interception on just 0.7% of his incomplete passes; Brees ranks second with an interception on 1.4% of his passes, and nobody else has thrown an interception on fewer than 2.8% of interceptions. Huard in 2006 (1.0%) currently has the record for interception rate on incomplete passes, and that’s another mark Rodgers has in his sights.

It’s been an up-and-down year for Rodgers. For example:

  • His winning percentage is below .500, the worst of his career since his first year as a starter in 2008.
  • His touchdown rate is below 5.0% for the first time in his career.
  • His completion percentage is 62%, the second lowest of his career.

On the other hand, his sack rate is slightly better than his (not very good) career average, his yards/attempt is slightly better than (his remarkably good) career average, he’s averaging more passing yards/game than any season other than 2011, and he’s posting by far the best interception rate of his career, which has been littered with remarkable interception rates.

Rodgers entered the season with a remarkable TD/INT ratio, and it’s only gotten better.  He’s now at 4.20/1, easily the best in history (only Brady and Russell Wilson — both are at 3.02 to 1 — have more than 3 touchdown passes for every interception).  And while it’s been a rough year for Rodgers, he’s in position to set a new record in 2018.

{ 1 comment }

Back-To-Back Long Winning/Losing Streaks

In 2017, the Houston Texans lost their final six games of the season. Tom Savage started the first of those three games, with T.J. Yates starting the final three. This year, with Deshaun Watson back from injury, the Texans… lost their first three games of the season. So entering week 4, Houston was on a 9-game losing streak. Since then? Houston has won four straight, and with a home game against the Dolphins tonight, have a good chance of running that winning streak to five straight. With a win in Denver next week, the Texans would have followed a streak of 6+ straight losses by, immediately, winning 6+ straight games.

That’s pretty rare: only six teams have ever strung together back to back streaks of 6+ wins and 6+ losses. And if Houston runs the streak to 9 straight wins, the Texans would be the first team to ever have back-to-back 9-game streaks.

The longest streak? That belongs to the San Diego Chargers. In 1987, the Chargers lost the season opener, but responded by winning 8 consecutive games (including three with replacement players). And then San Diego promptly lost 8 straight games, marking the only time a team has ever had back-to-back 8-game winning/losing streaks. For those curious, a 36-year-old Dan Fouts was the starter for 5 of the games during the winning streak, and four of the games during the losing streak, which stretched into 1988.

Just two other times has a team had a 6+ game winning streak followed by a 6+ game losing streak. In 1977, the Don Coryell Cardinals began the season 1-3 before Jim Hart and crew went on a 6-game winning streak, bringing St. Louis’s record to 7-3. From that point on, the Cardinals lost their final four games of the regular season and the team’s first eight games of 1978 under Bud Wilkinson.

Finally, the 2001 Rams under Kurt Warner won their final six regular season games, plus the team’s two NFC playoff games, allowing St. Louis to enter the Super Bowl on an 8-game winning streak. The Rams lost to the Patriots in the Super Bowl, of course, and then began the 2002 season on a 5-game losing streak, with Warner the starter for all but the final game. And at 0-5, the Rams responded with a 5-game winning streak, then under Marc Bulger!

What about teams like the Texans, who followed long losing streaks with long winning streaks? There are just three of those teams, using 6-game minimums.

In 1970, the Cincinnati Bengals had one of the more interesting seasons in NFL history.  With Paul Brown and Bill Walsh as offensive masterminds, the Bengals found a gem in Greg Cook to be the team’s quarterback in 1969.  Unfortunately, Cook suffered what would be a career-limiting injury, and the Bengals brass turned the ball over to Virgil Carter.  You know the story from there, as Carter, Walsh, and Brown helped usher the West Coast Offense into the NFL.  After winning the team’s opener, Cincinnati lost 6 straight games, before going on a 7-game winning streak to end the regular season.  The Bengals lost the team’s only playoff game.

In 1994, the New York Giants began the season 3-0, then lost 7 straight games, and then won the team’s final 6 games. Dave Brown was the team’s quarterback for all but one game.

Finally, we have the 1974 Jets, with a 31-year-old Joe Namath who managed to play every game that season.  New York lost its first game, won its second game, and then won on a 6-game losing streak followed by a 6-game winning streak to end the season.  From weeks 3 through 8, the Jets ranked 25th in passer rating and 17th in Net Yards per Attempt; during the final six weeks, the Jets ranked 3rd in passer rating and 3rd in NY/A.

{ 0 comments }

Championship Leverage, Part 2


Back in June, I wrote about Championship Leverage in the NFL. My particular interest was determining the value of a postseason game relative to that of a regular season game (and vice versa). In the original formula, I used a figure for wildcard games that was not intuitive to me. After careful consideration and discussing it with my readers, I have tweaked the formula to change the 8.33% odds in the wildcard round to 6.25% odds. This means seasons since 1978 now have a higher weight for postseason games. Nothing else has changed yet.

Championship Leverage

Read the table below thus: In the 2017 NFL, there were 11 playoff games, 16 scheduled regular season games per team, and 32 teams. That means a generic regular season game changes a team’s odds of a title by 0.244%, and a first round playoff game is worth 25.60 times more than a regular season game (in this case, that’s the wildcard game. Relative to a regular season game, the divisional round is worth 51.20, the championship round is worth 102.40, and the championship is worth 204.80. [continue reading…]

{ 0 comments }

The Opposite Trends of Field Goals and Turnovers

There are only a few statistics that have clear long-term trends. And two of them happen to intersect in a notable way.

The NFL used to have significantly more turnovers. Both fumbles lost and interceptions thrown have been declining since the merger, and for the decades before then, too.

Another trend: field goal accuracy has gone up, consistently, for generations. Field goal attempts rose for much of history until 1974 — when the goal posts were moved 10 yards from the front of the end zone to the back — and then began rising again. As a result, made field goals have increased significantly.

There have been varying numbers of teams and games on team’s schedules throughout history, so the best way to think of some statistics is on a per team basis. To avoid too many decimals, let’s look at things on a per-100 team game basis for the remainder of this post.

In 1950, teams made 51 field goals per 100 team games, or just over half a field goal per game (they attempted about 1.2). Also in 1950: teams averaged 373 turnovers per 100 team games! In other words, in a given game, if you picked a random play, it was over 7 times as likely to be a turnover than a successful field goal.

In 1960 (NFL data only), teams made 104 field goals per 100 team games, and committed 286 turnovers. So now a turnover was 2.74 times as likely as a field goal.

In 1970, teams made 131 field goals and committed 243 turnovers per team game, making turnovers 1.85 times as likely as successful field goal tries.

By 1980, we were back down to 107 field goals (remember, the goal posts were now 10 yards back) and 232 turnovers per 100 team games, for a ratio of 2.17 turnovers to every field goal.

In 1990, teams made 132 field goals per team game and had 199 turnovers, the first season where teams averaged fewer than two turnovers per game. This was a ratio of 1.51 to 1.

In 2000, teams kicked 147 field goals per team and and had 188 turnovers, meaning there was only 1.28 turnovers for every successful field goal.

In 2008, teams made 165 field goals per team game and committed just 155 turnovers, the first season where there were more field goals made than turnovers forced.

And last year, in 2017, teams averaged 169 field goals per team game and only 138 turnovers, for a rate of 0.82 turnovers per field goal, the single lowest rate in NFL history.

But despite all the words I just wrote, one picture is worth more than all of them. The graph below shows the turnovers committed and field goals made per 100 team games.

Pretty crazy, eh? Entertainment is subjective, of course, but declining turnover rates and increasing field goal rates do not seem like steps in the direction of a more entertaining game.

{ 1 comment }

I looked at all players (excluding quarterbacks) since 1990 with at least 50 carries in a season. I then grouped those players into 50-carry increments based on their number of carries that season: i.e., 50-99 carries, 100-149 carries, and so on. The chart below shows that data, along with the average number of carries for each group, the average number of rushing yards, and the average yards gained per carry:

Carries# of PlayersAvg RushAvg Rush YardAvg YPC
50-99619722884.03
100-1493381224914.01
150-1992771726894.00
200-2492222239274.15
250-29918127211474.21
300-34912732213614.22
350+3937116424.42

Those results are probably not very surprising. The players with the most carries have the most rushing yards, and the yards per carry average tends to increase, too. This is in some ways an example of survivorship bias: the players who are performing the best will continue to keep getting carries, moving them into the higher-carry buckets.

Now, what happens the next season? Take a second and think about what you expect…. [continue reading…]

{ 1 comment }

Super Bowl LII. Nine seconds left, New England down by eight. Tom Brady had already thrown for 505 yards, but the Patriots still needed another 51 yards from him to have a chance to extend the game. Brady launches a prayer to Rob Gronkowski, who …

… nearly comes down with it in the end zone. Had the Hail Mary been completed, Brady would have thrown for 556 yards, setting a new single-game passing yardage record. The current record, as trivia experts know, is 554 passing yards, set by Norm Van Brocklin way back in 1951.

Eight years ago, I first wrote about how Van Brocklin held the record for most passing yards in a single game. I’ll be reprinting and updating that post today.

Let’s begin with the obvious: Van Brocklin is a Hall of Famer and all-time great quarterback who, at his very best, produced some of the most efficient and valuable seasons in NFL history. He should be on most top-20 quarterback lists, and his net yards per pass attempt — one of the most basic but important measures of quarterback play — is the best of all time.

On the other hand, he set the record in 1951.  How the heck did that happen?  Below, I have plotted all games where a team has passed for at least 450 gross yards (that is, without deduction for sacks).  As you can see, the dot at (1951, 554) is a pretty large outlier: [continue reading…]

{ 1 comment }

Back in June, I wrote about how the average length of touchdown passes was declining significantly. I wanted to revisit that post with a graph that really highlights the change in the type of touchdown passes thrown over time. The graph below shows, for each season from 1950 to 2017, the percentage of touchdown passes each year that were:

  • At least 50+ yards, plotted in dark red;
  • 30-49 yards, plotted in in red;
  • 20-29 yards, plotted in gray;
  • 10-19 yards, plotted in light blue;
  • Inside of 9 yards, plotted in dark blue.

The overall trend is obvious: while in the ’60s, fewer than 25% of touchdown passes came from inside of 9 yards, in modern times, well over 40% of touchdown passes come from that range. On a raw basis, as recently as 1975, there were more touchdown passes from 30+ yards (85 from 30-49, 44 from 50+) than from 9 yards and in (128).  Last season, there were 314 touchdown passes from the 9 yard line or closer, and 157 from 30+ (76 from 31-49, 71 from 50+).

What’s really notable is that while passing touchdowns are on the rise, that is entirely a function of short touchdowns. There are 32 teams and 16 games per season, providing for 512 team games in modern times. In the graph below, the dark red line shows the number of passing touchdowns in each season per 512 team games. The high-water mark was 2015, when there were 842 passing touchdowns, and therefore 842 passing touchdowns per 512 team games. But the dark blue line shows the number of passing touchdowns per 512 team games but excluding all touchdown passes inside of 9 yards.  That number has been relatively constant across NFL history (well, at least since the merger), but if anything, the trend (both shot-term since 2015, and long-term) is negative for gross passing touchdowns once you eliminate the shortest throws.

Pretty interesting, eh?

{ 0 comments }

A couple of months ago, I asked this question on Twitter:

Do you know the answer? I’ll give you a couple of moments to think about it. First, a graph showing the 200 players with the most pass attempts in NFL history (all have at least 1,325 attempts). On the X-Axis is completion percentage; on the Y-Axis is Yards per Completion. There are no era adjustments here, which can also make it kind of fun: over time, completion percentages have skyrocketed, while the average yardage gained per completion has decreased. As a result, a player with a very high yards per completion percentage almost certainly played long ago, and therefore has a low completion percentage (and vice versa). Take a look: [continue reading…]

{ 1 comment }

You probably don’t think too much about Vince Young these days. The former Texas Longhorn star and Tennessee Titans disappointment last played in an NFL game back in 2011. But when I ran some queries recently, Young shocked me in a couple of stats. Let’s start with one you probably didn’t expect.

Young had a really good sack rate, particularly in 2009. But what makes Young’s sack rate really impressive is his sack rate relative to his rushing ability. In 2009, Young rushed 55 times and was sacked just 9 times. Among players with at least 200 pass attempts in a season, Young 2009 is the only instance where a player had at least 6 times as many rushing attempts as sacks; even if you drop the ratio to 5 times, only two other seasons are included.

And because Young had an insanely low average sack yards that year — he averaged just four yards lost per sack — he set another “record” that year. Young rushed 55 times and lost 36 yards on sacks; no other player has ever had more rushing attempts than sack yards lost, much less than 1.5:1 ratio that Young had that would hold up until you drop the pass attempt minimum below 120.

For his career, the numbers are similar, though obviously less extreme. Young had 282 career rushing attempts and just 83 sacks; that ratio of 3.40 rush attempts per sack is the highest among all players since 1970 (among the top 200 leaders in pass attempts). If you look at rushing yards compared to sacks, Young was at 17.58-to-1, second only to Michael Vick, who was helped by a remarkable 7.0 yards per carry average that nobody can match.

The table below shows this data for the 200 quarterbacks with the most attempts since 1970. When it comes to being a rushing quarterback and avoiding sacks, nobody can beat Vince Young: [continue reading…]

{ 0 comments }
Next Posts Previous Posts