≡ Menu

Joe Montana had what many consider to be the best performance in Super Bowl history. In Super Bowl XXIV against the Broncos, Montana completed 22 of 29 passes for 297 yards and 5 touchdowns, with 1 sack for 0 yards. Jerry Rice was the biggest beneficiary, catching 7 passes for 148 yards and 3 touchdowns, in a 55-10 blowout of the Broncos.

Do the math, and Montana averaged 13.23 Adjusted Net Yards per attempt that day. Making it even more impressive is that he was facing a Broncos defense that allowed just 3.89 ANY/A to opposing passers during the regular season. That means Montana averaged 9.35 additional ANY/A relative to the average Broncos opponent. Over 30 dropbacks, that’s 280 Adjusted Net Yards of Value that Montana added. That’s the most in Super Bowl history, just ahead of what Doug Williams did two years earlier against the Broncos.

In that game, Williams was 18/29 for 340 yards with 4 TDs and 1 INT, and one sack for 10 yards. That’s an ANY/A of 12.17, but it came against a slightly tougher defense: the Broncos allowed 3.77 ANY/A that season. So Williams was 8.40 ANY/A better than “expected” against Denver, over 30 dropbacks; that means he produced 252 ANY of value in the Super Bowl.

Below are those numbers for each of the 128 passers in Super Bowl history. For Super Bowls prior to 1981, I had to use estimated sack data rather than actual, with the formula for estimated sacks being simply (Team Sacks) * (QB Pass Attempts/Team Pass Attempts). [continue reading…]

{ 40 comments }

Atlanta had a really, really good offense this year. My favorite statistic: the Falcons had 59 drives end in a punt or a turnover, and 58 end in a touchdown.  Atlanta averaged 3.03 points per drive this year, and yet, the offense has been even better in the playoffs.

There was no stopping Matt Ryan and the Falcons against Green Bay, as the group scored 44 points on 9 drives in the NFC Championship Game. In the division round, the Falcons scored 36 points on 9 or 10 drives against Seattle, depending on whether you want to treat the Falcons final drive of the game as a real drive.  In two NFC playoff games, Atlanta’s offense has scored 10 touchdowns, seen 5 drives end on punts, 3 end on field goals, with zero turnovers and one drive end with the clock running out.

Scoring 80 points on 18 or 19 drives translates to an average of 4.21 or 4.44 points per drive. Take an average of those two numbers, and the offense is still averaging a whopping 4.32 points per drive. How remarkable is that? Well, it’s the best average for any of the 102 Super Bowl teams in their pre-Super Bowl playoff games.

The NFL has not historically recorded drive stats, so I previously wrote how one can estimate the number of offensive drives a team has in a game or season.  I used that formula to measure the best playoff offenses entering the Super Bowl; unsurprisingly, the 1990 Bills were the previous hottest offense.

Against Miami in the division round, Buffalo had between 10 and 12 drives, depending on how you treat the final drives of the half (the Bills received the ball with 14 seconds left on their own 32, and took a knee) and the game (Buffalo received the ball with just over one minute to go, and ran three times for a first down to run out the clock). Those other ten drives ended as follows, in order: Touchdown, Field Goal, Field Goal, Touchdown, Touchdown, Interception, Field Goal, Touchdown, Touchdown, Punt. That’s 44 points on 10 real drives.

The next week, in the AFC Championship Game against the Raiders, the Bills had 11 or 12 drives, as the final drive of the game featured Buffalo taking a pair of knees to close out a 51-3 victory. The first 11 drives went: TD, TD, Interception, TD, missed FG, TD, TD, Punt, TD, FG, Punt.  That’s 44 points (Buffalo also scored on a pick six, and one extra point was missed) on 11 drives. [continue reading…]

{ 14 comments }

Would the Atlanta Falcons be the worst franchise to win the Super Bowl? The Falcons have a franchise regular season record of 341-437-6, which translates to a 0.439 winning percentage.

In 51 years, the Falcons have made the playoffs just 13 times. Atlanta didn’t record back-to-back winning seasons as a franchise until Matt Ryan arrived; the team had five straight years with a winning record, but hasn’t had repeated the feat since (next year, perhaps). Atlanta has never led the NFL in offense; it hadn’t led the league in scoring until this year. It only led the league in points allowed one time, the historic ’77 team, but has never finished first in yards allowed.

In short, this is not a good franchise. It may be one of the three worst franchises to ever win a Super Bowl, yet it may still be the best franchise from the NFC South to ever pull off that feat. Here are my rankings of the worst franchises to win a Super Bowl.

5) 2001 Patriots: Sure, it’s easy to think of New England as one of the best franchises in the league. But 15 years ago? Not so much. New England had a 291-328-9 record (0.471), 37 games below .500, when the team won its first Lombardi Trophy. The franchise had been on the rebound from the ugly days of the early ’90s, but the franchise’s history was mostly bad, even when the team was good (see: Super Bowl XX).

4) 1974 Steelers: Another team that used its first Super Bowl victory as the birth of a dynasty. But Pittsburgh was 199-280-19 (0.419) at the conclusion of the 1974 regular season; at 81 games below 0.500, this was a bad franchise. In the ’50s and ’60s, the Steelers had the second most losses of any team in the NFL. That all changed once Chuck Noll came to town, and quickly turned the Steelers into the team of the ’70s.

3) 2016 Falcons, with a win: Atlanta is currently an underdog in Super Bowl LI, but this feels like the appropriate slot for the team. At 96 games below .500 and with a 0.439 winning percentage, this is a bad franchise. Under Rankin Smith, Atlanta went 129-218-5 in the team’s first 24 years of existence, with just one playoff victory. He handed the keys to the organization to his son, Taylor, in 1990; Atlanta won a playoff game in ’91 and then two more in 1998, culminating in the team’s only Super Bowl appearance prior to this year. Still, three playoff wins and an 83-109 record in 12 years wasn’t much better.

The team was sold to Arthur Blank in 2002, and the Falcons have been good under Blank in large part because the team landed Michael Vick and then Matt Ryan.  The Falcons are 129-110-1 in the Blank years, with a 5-6 playoff record. Perhaps most impressive: in 15 years, Atlanta has had a losing season just five times.

2) 2009 Saints: New Orleans was a whopping 103 games below .500 after the 2009 season, courtesy of a 275-378-5 record (0.422).  This was a bad, bad franchise: under founding owner John Mecom Jr., the team went 78-176-5 in 18 years without a single playoff appearance!  Tom Benson took over in 1985, but the Saints didn’t win their first playoff game until 2000!  Entering the ’09 playoffs, the franchise had just two playoff wins, but won three that year to capture the team’s sole Lombardi Trophy.

1) 2002 Bucs: Tampa Bay had a 0.382 winning percentage at the end of the 2002 regular season, and stood at 99 games below 0.500 with a 160-259-1 franchise mark. This team was called the “Yucks” for a reason: from Hugh Culverhouse was the team’s original owner, and the franchise famously lost its first 26 games.  Culverhouse died after 18 years, and Tampa Bay had won just a single playoff game during his time; overall the Bucs were 81-194-1, easily the worst franchise in the NFL over that period.

In 1994, the Bucs went 6-10 without a true owner; the Culverhouse estate sold the team to Malcolm Glazer, who had a pretty nice start.  His first two draft picks were Warren Sapp and Derrick Brooks, and the team soon turned from laughingstock to contender once Tony Dungy came on board in 1996.  Glazer controversially fired Dungy and traded two first-rounders, two second-rounders, and $8 million for Jon Gruden, but the moved proved to be an immediate (if not necessarily long-term) success: the Bucs won the Super Bowl in ’02, the first year under Gruden.

{ 11 comments }

Background reading:

Part I

Part II

Part III

Part IV

Part V (Career Passer Ratings)

In the interest of making all data available to you, the reader, the table below shows the averages for each professional football league since 1932 in the relevant passing statistics used to calculate passer rating: [continue reading…]

{ 9 comments }

In yesterday’s post, I examined the methodology behind passer rating. Here were the passer ratings for the 30 quarterbacks who threw enough passes to qualify for the crown in 2016:

RkPlayerTmAttCmpYdsTDIntCmp%Yd/AttTD%INT%Rating
1Matt Ryan*+ATL534373494438769.9%9.267.1%1.3%117.1
2Tom Brady*NWE432291355428267.4%8.236.5%0.5%112.2
3Dak Prescott*DAL459311366723467.8%7.995.0%0.9%104.9
4Aaron Rodgers*GNB610401442840765.7%7.266.6%1.1%104.2
5Drew BreesNOR6734715208371570.0%7.745.5%2.2%101.7
6Sam BradfordMIN552395387720571.6%7.023.6%0.9%99.3
7Kirk CousinsWAS6064064917251267.0%8.114.1%2.0%97.2
8Derek Carr*OAK560357393728663.8%7.035.0%1.1%96.7
9Andrew LuckIND5453464240311363.5%7.785.7%2.4%96.4
10Marcus MariotaTEN451276342626961.2%7.605.8%2.0%95.6
11Ben Roethlisberger*PIT5093283819291364.4%7.505.7%2.6%95.4
12Ryan TannehillMIA3892612995191267.1%7.704.9%3.1%93.5
13Matthew StaffordDET5943884327241065.3%7.284.0%1.7%93.3
14Russell WilsonSEA5463534219211164.7%7.733.8%2.0%92.6
15Andy DaltonCIN563364420618864.7%7.473.2%1.4%91.8
16Alex SmithKAN489328350215867.1%7.163.1%1.6%91.2
17Colin KaepernickSFO331196224116459.2%6.774.8%1.2%90.7
18Tyrod TaylorBUF436269302317661.7%6.933.9%1.4%89.7
19Philip RiversSDG5783494386332160.4%7.595.7%3.6%87.9
20Carson PalmerARI5973644233261461.0%7.094.4%2.3%87.2
21Jameis WinstonTAM5673454090281860.8%7.214.9%3.2%86.1
22Eli ManningNYG5983774027261663.0%6.734.3%2.7%86.0
23Trevor SiemianDEN4862893401181059.5%7.003.7%2.1%84.6
24Joe FlaccoBAL6724364317201564.9%6.423.0%2.2%83.5
25Carson WentzPHI6073793782161462.4%6.232.6%2.3%79.3
26Blake BortlesJAX6253683905231658.9%6.253.7%2.6%78.8
27Case KeenumLAR322196220191160.9%6.842.8%3.4%76.4
28Cam NewtonCAR5102703509191452.9%6.883.7%2.7%75.8
29Brock OsweilerHOU5103012957151659.0%5.802.9%3.1%72.2
30Ryan FitzpatrickNYJ4032282710121756.6%6.723.0%4.2%69.6

Now, as we learned yesterday, passer rating is the result of four variables: completion percentage, yards per attempt, touchdown rate, and interception rate. Those variables are all scaled so that the average score is 1.0 for each variable. Then, we take an average of the four variables and multiply it by 66.67, since that was intended to be the league average passer rating (or, said differently and how it is more commonly represented in formulas, we sum the four numbers, divide by six, and multiply by 100).

So let’s take a look at the scores in each of the four variables for these 30 quarterbacks to better understand their 2016 passer ratings. The far right column shows the average of those variables, which again, is equivalent to their passer rating divided by 66.67. [continue reading…]

{ 28 comments }

Adjusting Passer Rating for Era: Part I

Passer rating is a dumb stat. Let’s get that out of the way. As I’ve written before, passer rating is stupid because it gives a 20-yard bonus for each completion, a 100-yard penalty for each interception, and an 80-yard bonus for each touchdown. In reality, there should be no (or a very small) weight on completions (or, better yet, a bonus for completions that go for a first down), a 45-yard weight on interceptions, and a 20-yard weight on touchdowns. But given how ubiquitous passer rating is in analysis of passing, let’s at least try to understand it more.

Let’s begin with the formula one needs to calculate passer rating in Excel:

=IF(C2>223,SUM(MEDIAN(0,2.375,(D2/C2-0.3)*5),MEDIAN(0,2.375,[1]E2)/C2-3)*0.25),MEDIAN(0,2.375,F2/C2*20),MEDIAN(0,2.375,2.375-(G2/C2*25)/6*100,0)

To make this formula work, you need to put the following categories in these cells:

C2 = Attempts
D2 = Completions
E2= Passing Yards
F2 = Passing Touchdowns
G2 = Interceptions

That formula probably seems like gibberish to you, so let’s unpack it a little bit.

=IF(C2>223,SUM(MEDIAN(0,2.375,(D2/C2-0.3)*5),MEDIAN(0,2.375,[2]E2)/C2-3)*0.25),MEDIAN(0,2.375,F2/C2*20),MEDIAN(0,2.375,2.375-(G2/C2*25)/6*100,0)

This part is simple enough: if a quarterback doesn’t have at least 224 pass attempts (during a 16-game season), they fail to qualify for the passer rating crown.  You can lower this number for non-16-game seasons as necessary.

Passer Rating – Four Components

Passer rating comprises four components: completion percentage, yards per attempt, touchdowns per attempt, and interceptions per attempt.  Let’s see how the above formula addresses these concerns:

Completion Percentage

=IF(C2>223,SUM(MEDIAN(0,2.375,(D2/C2-0.3)*5),MEDIAN(0,2.375,[3]E2)/C2-3)*0.25),MEDIAN(0,2.375,F2/C2*20),MEDIAN(0,2.375,2.375-(G2/C2*25)/6*100,0)

Take a look at the bolded blue text — What are we doing? Taking completions and dividing them by attempts is how we come up with completion percentage, of course.  You take that result and subtract 0.3, or 30%.  Savvy readers will pick up on the fact that if your completion percentage is 29% or 0%, you get the same credit in passer rating: there is a floor of 30%. [continue reading…]

References

References
1, 2, 3 E2)/C2-3)*0.25),MEDIAN(0,2.375,F2/C2*20),MEDIAN(0,2.375,2.375-(G2/C2*25
{ 9 comments }

There is a lot of talk about the large point spread in the Patriots/Texans game. New England is a 15.5-point favorite over Houston tonight, tied for the second largest spread ever in a non-Super Bowl playoff game behind only Minnesota/Arizona in 1998.  The over/under is 44.5, which means the projected final score is 30-14.5.

Let’s say the Texans pull off the upset. Are they more likely to do so in a low-scoring game, or in a shootout?  If Houston wins 14-13, they will have come in under their projected points total by 0.5, but held New England to 17 fewer points than expected.  If the Texans win 31-30, they would have exceeded their projected points total by 16.5 points, while holding New England to exactly the number of expected points.

So, which result is more likely? My intuition says a low-scoring game, but what do the numbers say? There have been 24 games since 1985 where a team won despite being an underdog of at least 14 points.  As it turns out, intuition is correct: on average, these underdogs exceeded their projected points for total by 7.8 points, but held their opponents to 13.3 fewer points than expected. [continue reading…]

{ 8 comments }

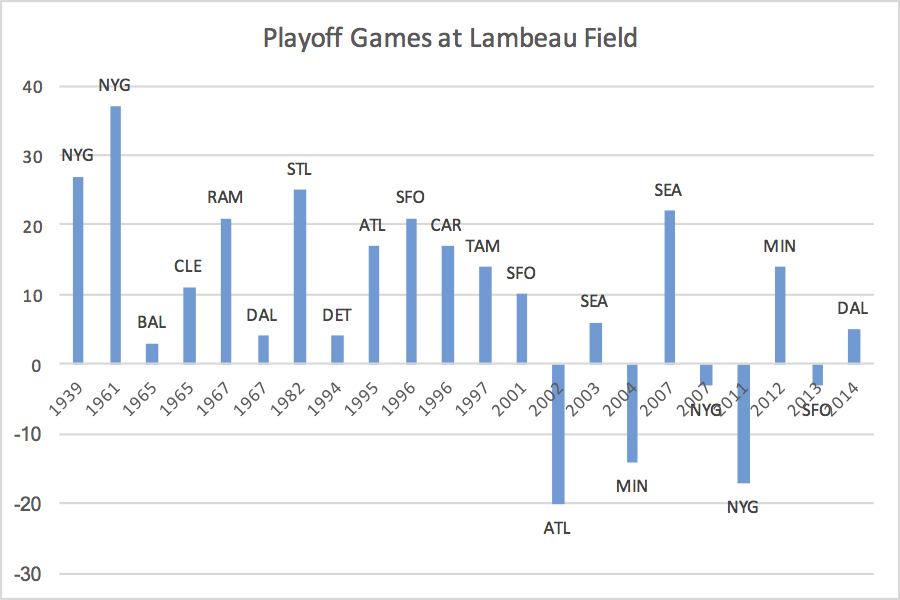
The Packers won every home playoff game for over 60 years. Green Bay was 13-0 at home in playoff games until Michael Vick and the Atlanta Falcons won as 6.5-point underdogs at the end of the 2002 season. Since that 13-0 start, the Packers are a much less intimidating 5-4 in the postseason. Below is the points differential in every playoff game in Green Bay in NFL history:

[continue reading…]

{ 11 comments }

Nobody wants to be compared to Ryan Leaf, so it tells you all you need to know about Jared Goff‘s rookie season that such a headline doubles as a legitimate question. Let’s start with the raw stats, even though we know the passing environment has changed significantly since 1998:

Passing Rushing
Rk Player Year G QBrec Cmp Att Cmp% Yds TD Rate Lng Int Sk Yds Y/A AY/A NY/A ANY/A Att Yds TD Y/A Lng
1 Jared Goff 2016 8 0-7-0 112 205 54.6 1089 5 63.6 66 7 26 222 5.3 4.26 3.75 2.82 8 16 1 2.0 6
2 Ryan Leaf 1998 10 3-6-0 111 245 45.3 1289 2 39.0 67 15 22 140 5.3 2.67 4.30 1.93 27 80 0 3.0 20

[continue reading…]

{ 21 comments }

The Lions began the season 9-4, but have now lost the team’s last two games headed into a winner-takes-the-NFC North showdown with the Packers. Detroit’s success — and failures — have been SOS-related. Detroit’s last two losses came to the two best teams (by record) the Lions have faced all year: the 13-2 Cowboys and 10-5 Giants. And the 9-4 start came with Detroit going 8-1 against teams with a losing record and 1-3 against teams with a winning record. To date, the only wins for the Lions this year against a team with a winning record was a 20-17 home victory over 8-6-1 Washington where Detroit had the ball, down 4, at its own 25, with 1:05 remaining. The Lions have done well by beating bad teams, but if Detroit loses to Green Bay, that unlikely win over the Redskins will be the only impressive win the team has all year.

Eight teams have finished with a winning record, missed the playoffs, and also lost at least their last three games.

  • The final season of Dan Fouts’ career was an odd one. The 1987 Chargers lost their first game, but went 3-0 during the replacement games with Rick Neuheisel and Mike Kelly at quarterback. Then, with Fouts and the regular starters back, the Chargers ran their record to 8-1… before losing their final seven games of the season. San Diego went from 8-1 to eliminated from the playoffs even before the final game of the year, and ended with an 8-7 record.
  • The 1993  Dolphins began 9-2, even though Dan Marino was lost for the season after five games with a torn achilles.  But the 9th win came in the Leon Lett game, and Miami didn’t win another game the rest of the year, while the Cowboys didn’t lose another game that season.  A 5-game losing streak to end the season was particularly painful for the Dolphins, who lost a tiebreaker at 9-7 to two other AFC teams to miss the playoffs.
  • The 2008 Bucs collapsed down the stretch, which resulted in Jon Gruden  losing his job. Tampa Bay began 9-3, but lost their final four games in embarrassing fashion. The Bucs allowed three 4th quarter touchdowns to Carolina to lose 38-23, lost a heartbreaking in overtime to Atlanta, lost by 17 to the Chargers, and then blew a 10-point 4th quarter lead as 10.5-point favorites to the Raiders.
  • The 2002 Saints, 2000 Jets, 1996 Chiefs, 1971 Lions, and 1970 Cardinals all lost their final three games and missed the postseason.  New Orleans, New York, and Kansas City all started 9-4, while Detroit was 7-3-1 and St. Louis was 8-2-1.

[continue reading…]

{ 5 comments }

Guest Post: Wide Receivers and the Hall of Fame

Today’s guest post comes from one of the longest followers of this blog (and its predecessor), Richie Wohlers. Richie is 44-year-old accountant from Southern California who is a Dolphins fan despite never being to Florida. As always, we thank our guest posters for contributing.


Previously, I looked at linebackers and centers in the Pro Football Hall of Fame. With Andre Johnson’s recent retirement announcement, I thought it would be a good idea to take a look at wide receivers next. As before, I am just taking a look at post-merger players by using some objective factors to try to get a picture of what a typical HOFer looks like. Those factors are All-Pros, Pro Bowls, Weighted AV, Total AV, Super Bowl Appearances and Super Bowl wins). I am going to classify all players into a single position for simplicity. If you are interested in knowing the details of my calculation, see footnote. [1]Methodology: For All-Pros, Pro Bowls, Career AV and Total AV, I am looking at the average numbers for each player at his position. In an attempt to make the average HOFer at a position worth 100 … Continue reading

I explored the relationship between statistics (receptions, yards, touchdowns) and HOF induction for WRs, and it doesn’t improve the correlation. My “Career Score” is more aligned with HOF inductions than any single receiving statistic. The correlations are hurt by weak stats from HOFers like Swann and Hayes. And they are also hurt by big numbers from non-HOFers like Henry Ellard, Harold Jackson and Football Perspective hero Jimmy Smith. [continue reading…]

References

References
1 Methodology: For All-Pros, Pro Bowls, Career AV and Total AV, I am looking at the average numbers for each player at his position. In an attempt to make the average HOFer at a position worth 100 points, I am assigning a weight of 16.6 for each category (16.6 times 6 categories equals 99.6 points). If an average player had 5.7 All Pros I divided 16.6 to get 2.9. So each All Pro is worth 2.9 points at that position. Super Bowls are the exception. I’m just going with a straight points system. One appearance is 8 points, 2 appearances is 14 points, 3 appearances is 18 points, and then 2 more points for each additional appearance. Super Bowl wins are worth 12, 20, 26, 30 and then 2 more per additional win. I add them up for a “Career Score”.
{ 43 comments }

Yes.

Take a look at the Broncos pass defense this year, compared to the Broncos pass defense last year:

Year Tm G Cmp Att Cmp% Yds TD TD% Int Int% Y/A AY/A Y/C Y/G Rate Sk Yds NY/A ANY/A
Sk% EXP
2016 DEN 14 260 483 53.8 2562 10 2.1 12 2.5 5.8 5.1 10.7 183.0 67.5 40 221 4.9 4.2 7.6 72.16
Year Tm G Cmp Att Cmp% Yds TD TD% Int Int% Y/A AY/A Y/C Y/G Rate Sk Yds NY/A ANY/A
Sk% EXP
2015 DEN 16 344 573 60.0 3193 19 3.3 14 2.4 6.2 5.7 10.3 199.6 78.8 52 351 5.1 4.7 8.3 59.89

Three years ago, I looked at the Seattle pass defense and calculate how many standard deviations above average the Seahawks were. At the time, I compared them to an average of the other 31 defenses rather than an average of all 32 defenses, including themselves. I don’t know if there’s a right or wrong answer there, but I’m going to use the latter methodology today, which will explain why the numbers are slightly different.

Anyway, Seattle was 2.80 standard deviations above average in ANY/A allowed in 2013. That’s because Seattle’s pass defense allowed 3.19 ANY/A, while the league average was 5.89 ANY/A. That’s a difference of 2.70 ANY/A, and the standard deviation among the 32 pass defenses that year was 0.97. Divide 2.70 by 0.97, and you see that Seattle was 2.80 standard deviations above average.

The 2016 Broncos? They are allowing just 4.25 ANY/A. That is over a full yard “worse” than Seattle, but worse needs to be put in quotes. For starters, the league average is 6.25 ANY/A this year; in addition, the rest of the league is bunched together. The standard deviation for the 32 pass defenses is 0.74 ANY/A. That means the Broncos have a Z-Score of 2.69 standard deviations better than average (here, negative is better).

That puts Denver as the 5th best pass defense, by this metric, since 1970: [continue reading…]

{ 11 comments }

In 2012, the Atlanta Falcons were 11-1 through 13 weeks, just like the Cowboys are this season. And just like this year, the NFC, no other team had more than 8 wins at that point, with an NFC West squad — then, the 49ers, this season, the Seahawks — holding the second best record at 8-3-1.

Through 13 weeks, how often does a team lead its conference by at least 2.5 games?  I am defining through 13 weeks to mean:

  • In 1993, to mean through 14 weeks, since there were two weeks of byes that year.
  • From 1970 to 1989, to mean through 12 weeks, since there were zero bye weeks before 1990.
  • From 1990 to 2016 (1993, excepted), to mean through 13 weeks! That’s simple, isn’t it?

That gives us 94 seasons to analyze conference data in the post-merger era. This year, the Cowboys are at +2.5, while the Raiders and Patriots are tied at 10-2 in the AFC; that means the AFC leader is at +0. On average, the #2 team in a conference has been 1.1 games behind the #1 team in the conference through 13 weeks. Here is the breakdown: [continue reading…]

{ 0 comments }

The 0-11 Browns Are Looking To Challenge History

The Browns have lost their first 11 games of the season, becoming just the sixth team since 2000 to begin the season 0-11.

  • In 2008, the Lions went 0-16.
  • In 2007, the Dolphins began the year 0-13, and ended the streak with an overtime win against Baltimore in game fourteen.

I’m short on time today, so here’s a quick look at all teams that began the season 0-10, along with how long that streak continued, and which opponent broke the streak.

TeamYearFirst WinOppRecord
Cleveland Browns2016Game ??????
Oakland Raiders2014Game 11KAN3-13
Indianapolis Colts201114TEN2-14
Detroit Lions2008n/an/a0-16
Miami Dolphins200714BAL1-15
Detroit Lions200113MIN2-14
San Diego Chargers200012KAN1-15
Indianapolis Colts199711GNB3-13
Cincinnati Bengals199311RAI3-13
Indianapolis Colts198614ATL3-13
Buffalo Bills198412DAL2-14
Houston Oilers198411KAN3-13
Houston Oilers198311DET2-14
New Orleans Saints198015NYJ1-15
Tampa Bay Buccaneers197713NOR2-12
Tampa Bay Buccaneers1976n/an/a0-14
San Diego Chargers197512KAN2-12
Buffalo Bills197111NWE1-13
Philadelphia Eagles196812DET2-12
Oakland Raiders196214BOS1-13
Washington Redskins196114DAL1-12-1
Dallas Cowboys1960n/an/a0-11-1
Chicago Cardinals195312CHI1-10-1
Chicago Rockets194711BCL1-13
Brooklyn Tigers1944n/an/a0-10
Chi/Pit Cards/Steelers1944n/an/a0-10
Chicago Cardinals1943n/an/a0-10
Detroit Lions1942n/an/a0-11
Pittsburgh Pirates193911PHI1-9-1
Oorang Indians192311LOU1-10

The Chiefs have been the streak-breaker four times, but sadly for Cleveland fans, Kansas City is not on the schedule this year.

{ 13 comments }

The Minnesota Vikings are the last undefeated and untied [1]Note: Throughout this post, I am using “undefeated” or “unbeaten” to mean no losses and no ties. team in the NFL. Entering week 5, there were three undefeated teams, but the Broncos (Atlanta) and Eagles (Detroit) both lost on Sunday.

From 1970 to 2015, there were 43 times when there was one team standing as the lone unbeaten team remaining. [2]Obviously that means there were four seasons where that wasn’t the case. In 2014, the Bengals and Cardinals were the last two unbeaten teams, and lost in week 5. In 1990, the Giants and 49ers … Continue reading How long did those teams remain undefeated? And how did their seasons ultimately end? Take a look: [continue reading…]

References

References
1 Note: Throughout this post, I am using “undefeated” or “unbeaten” to mean no losses and no ties.
2 Obviously that means there were four seasons where that wasn’t the case. In 2014, the Bengals and Cardinals were the last two unbeaten teams, and lost in week 5. In 1990, the Giants and 49ers both went 10-0, but lost in their 11th game before their head-to-head matchup. And in 1970, the Broncos, Lions, and Rams entered week 4 undefeated, but all left week 4 with a loss.
{ 6 comments }

538: Analyzing The Eagles Surprising 3-0 Start

Today at 538: a look at some key numbers surrounding the Eagles hot start.

At 3-0, the Philadelphia Eagles are quickly gaining altitude.  Our preseason Elo ratings gave the Eagles a mere 1 percent chance to win the Super Bowl and a 27 percent probability of winning the NFC East; now those numbers are up to 6 percent and 59 percent, respectively.

Tom Brady’s suspension notwithstanding, three of the league’s other four current undefeated teams had much higher preseason Super Bowl odds: Denver was at 11 percent, with New England at 7 percent and Minnesota at 4 percent. Like Philly, Baltimore was at 1 percent — but at least they were not breaking in a new coach and a new quarterback. Philadelphia’s hot start is the one very few saw coming.

You can read the full article here.

{ 7 comments }

The early AFL was unstable, which probably isn’t too surprising. This was most clear in 1963, which must be one of least sticky league seasons in pro sports.  The Oakland Raiders, under new coach Al Davis, jumped from 1-13 to 10-4. The San Diego Chargers, who added quarterback Tobin Rote and had a breakout season from second-year wide receiver Lance Alworth, went from 4-10 to 11-3 and league champions.

Meanwhile, three of the eight teams in the AFL had huge declines.

  • The Houston Oilers had been the class of the early AFL, winning the title in ’60 and ’61, before falling in the championship game in ’62. But in ’63, Houston dropped from 11-3 to 6-8.
  • Houston lost in the ’62 AFL title game to Lamar Hunt’s Dallas Texans, who went 11-3 behind coach Hank Stram and quarterback Len Dawson. But  after moving to Kansas City in the off-season, the team went just 5-7-2.
  • Denver went 7-7 in 1962,  with a pass offense and a pass defense that was both about average.  But in ’63, both ranked last in the league, and the Broncos fell to 2-11-1.

The graph below shows each team’s winning percentage in 1962 (on the Y-Axis) and in 1963 (the X-Axis), along with a trend line.  In a stable leage, the teams would form a diagonal line that starts on the bottom left and goes up to the bottom right; i.e., as win percentage rises in Year N, it rises it Year N+1. Yet here, the trend line is the exact opposite.  That’s because there was a strong negative correlation (-0.49) between winning percentage in the two years. [continue reading…]

{ 14 comments }
Decker after another score

Decker after another score

For his career, Eric Decker has 5,222 receiving yards and 52 receiving touchdowns.  That means he’s grabbed one touchdown catch for every 100.4 receiving yards, an incredible ratio for a non-tight end.  And while touchdons can be fluky, that doesn’t feel the way with Decker, who has been a touchdown machine for his entire career across two teams and multiple quarterbacks.

To put this into perspective, I looked at all wide receivers who entered the NFL since 1978 who have at least 2,000 receiving yards through the end of the 2015 season.  Decker has the third lowest (i.e., most touchdown-heavy) rate at a touchdown every 100.4 receiving yards [1]For Decker, I included 2016, but for every other player, I have not updated their numbers, if any, with the results of this year.  The only two players ahead of him? Randy Moss and Dez Bryant.

In the graph below, I’ve plotted career receiving yards (’78-’15) on the X-Axis, and Receiving Yards/Receiving Touchdowns( ’78-’15) on the Y-Axis. In that case, lower = more of a touchdown machine. [continue reading…]

References

References
1 For Decker, I included 2016, but for every other player, I have not updated their numbers, if any, with the results of this year.
{ 3 comments }

538: Post-Week 1, 2016: Close Games Define Week 1

Today at 538, a look at why Week 1 (prior to Monday Night) was extraordinarily competitive:

But this year’s Week 1 results aren’t just close by Week 1 standards. The Broncos (over the Panthers), Bengals (Jets), Raiders (Saints) and Giants (Cowboys) all won by just 1 point: That’s the first time that four games in one week have been decided by a single point in 34 years.

Since 1993, only one week has been as close on average as the 5.1-point margin tallied so far on opening weekend — Week 5 of the 2001 season. Since 1993, the standard deviation of from the previously mentioned 11.6-point average margin of victory was 2.3 points. That makes this season’s Week 1 a true outlier: At 5.1 points (pending tonight’s games), it is 2.3 standard deviations from average. The graph below shows the average margin in each week of the regular season since 1993:

You can read the full article here. Good thing this was filed before Monday night’s games! The Steelers (38-16) and Rams (28-0) won by a combined 50 points, while the first 14 games were decided by just 72 combined points.

{ 1 comment }

Running Back Production By Birth Year

Barry Sanders was born in 1968. Emmitt Smith was born in 1969. The next two years were pretty quiet — Dorsey Levens and Garrison Hearst were born in ’70 and ’71 — but business was about to pick up. Terrell Davis and Jerome Bettis were born in 1972, and Curtis Martin, Eddie George, Marshall Faulk, and Priest Holmes were all born in 1973. That’s a 6-year period that gave us some of the most important running backs in NFL history.

And it came at a really important time. Because the previous five years were not nearly as fruitful.

  • In 1967, there were no notable [1]Okay, this sounds kind of mean, but I mean notable in the sense of having historical importance to the game of football. running backs born.
  • In 1966, Thurman Thomas was born, but other than him, not much else.
  • In 1965, there were no notable running backs born.
  • In 1964, Neal Anderson [2]Note that the notable bar is very low. was born and that’s about it.
  • In 1963, Rueben Mayes was the most notable running back born.

[continue reading…]

References

References
1 Okay, this sounds kind of mean, but I mean notable in the sense of having historical importance to the game of football.
2 Note that the notable bar is very low.
{ 6 comments }

Resting Starters Database

Adam Steele is back for another guest post. You can view all of Adam’s posts here. As always, we thank him for contributing.


In the same vein as Bryan Frye’s kneel, spike, and first down data and Tom McDermott’s adjusted SRS ratings, I want to contribute some corrections in data distortion. From a stat geek’s perspective, there’s nothing more annoying than strong teams resting their starters in the final week of the season, as it pollutes season long statistics with a game’s worth of junk data. In a 16 game season, even one meaningless outlier can have a big impact on season totals and averages. The most egregious example is the 2004 Eagles, who stormed out to a dominant 13-1 start only to mail in their final two games by a combined score of 58-17. Philly’s season totals look far better (and far more accurate) once those two meaningless games are removed from the sample. I went back to 1993 and noted every game where one team sat their starters and/or played vanilla football with no intention of trying to win. In some instances, a team was clearly going full bore in the first half, then waved the white flag after halftime. In these games, I pulled out the junk data from the second half only.

There are obviously going to be some judgment calls in deciding whether or not a team was really trying to win a given game. For example, this past season’s week 17 matchup between Seattle and Arizona could be viewed two different ways – Arizona was trying to win (at least in the first half) and Seattle just stomped them, or the Cards weren’t really trying even though their starters played the first half. I chose the latter. The one notable game I purposely left out was the week 17 Packers/Lions shootout from 2011. The game was technically meaningless for both teams, and Green Bay kept Rodgers on the bench, but otherwise all the starters played and were clearly playing to win. If the Packers didn’t care, Matt Flynn would not have thrown six TD passes. If you dispute any of the games I’ve listed, I’m happy to discuss and reconsider!

How to read the table: The first five rows are self-explanatory; “Type” designates whether the whole game should be discarded or just the second half; Points, PaTD, and RuTD indicate the points and offensive touchdowns scored during junk time (the stats I believe should be removed from the season data). Defensive numbers can be found by simply looking at the offensive numbers from the team’s opponent.

Team-OppYearWkTypePtsPaTDRuTD
TEN@IND201517Full2412
INDTEN201517Full3020
SEA@ARI201517Full3631
ARISEA201517Full610
WAS@DAL201517Half1010
DALWAS201517Half910
BUF@NE201417Full1711
NEBUF201417Full900
DEN@OAK201317Half300
OAKDEN201317Half1420
BAL@CIN201217Full1702
CINBAL201217Full2310
TB@ATL201117Full2420
ATLTB201117Full4523
OAK@KC201017Full3112
KCOAK201017Full1001
TB@NO201017Half1310
NOTB201017Half600
CIN@NYJ200917Full000
NYJCIN200917Full3704
GB@ARI200917Full3312
ARIGB200917Full710
IND@BUF200917Full701
BUFIND200917Full3030
NYJ@IND200916Half2601
INDNYJ200916Half601
TB@NO200916Half1701
NOTB200916Half000
NE@HOU200917Half1401
HOUNE200917Half2112
NO@CAR200917Full1001
CARNO200917Full2311
ARI@NE200816Full710
NEARI200816Full4732
TEN@IND200817Full000
INDTEN200817Full2310
TEN@IND200717Full1601
INDTEN200717Full1010
SEA@ATL200717Half2421
ATLSEA200717Half2730
IND@SEA200516Full1310
SEAIND200516Full2822
CIN@KC200517Full300
KCCIN200517Full3713
ARI@IND200517Full1310
INDARI200517Full1720
SEA@GB200517Full1711
GBSEA200517Full2311
MIA@NE200517Half1510
NEMIA200517Half1620
PHI@STL200416Full710
STLPHI200416Full2011
ATL@NO200416Full1301
NOATL200416Full2611
ATL@SEA200417Full2620
SEAATL200417Full2822
IND@DEN200417Full1420
DENIND200417Full3321
PIT@BUF200417Full2910
BUFPIT200417Full2402
NYJ@STL200417Full2910
STLNYJ200417Full3231
CIN@PHI200417Full3813
PHICIN200417Full1010
DEN@GB200317Full300
GBDEN200317Full3112
PHI@TB200117Full1720
TBPHI200117Full1301
TEN@PIT199917Half1610
PITTEN199917Half2921
STL@PHI199917Half1420
PHISTL199917Half2110
SF@SEA199717Full900
SEASF199717Full3841
PIT@TEN199717Full600
TENPIT199717Full1601
DEN@SD199617Full1001
SDDEN199617Full1610
SF@MIN199417Full1420
MINSF199417Full2101
DAL@NYG199417Full1001
NYGDAL199417Full1510
PIT@SD199417Half2121
SDPIT199417Half2002
PHI@SF199318Full3730
SFPHI199318Full3422

My plan is to eventually do this all the way back to 1970, then publish the “real” points scored and allowed for each team by prorating the pristine data to a full season.

{ 18 comments }

Is TD/INT Ratio Now Meaningless?

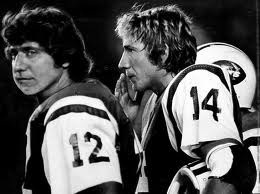
A pair of Crimson Tide/Jets quarterbacks in 1976

A pair of Crimson Tide/Jets quarterbacks in 1976

You remember Jets quarterback Richard Todd, don’t you? Before there was Favre/Rodgers and Montana/Young, Jets fans envisioned a Namath/Todd passing of the torch. Eleven years after New York drafted Joe Namath, the Jets spent the 6th pick in the 1976 draft on Todd: another quarterback from Alabama. For a year, the duo overlapped: a passed-his-prime Namath threw 4 touchdowns against 16 interceptions in 8 starts, while an inexperienced Todd had 3 touchdowns and 12 interceptions in 6 starts.

The duo even looked similar, shaggy hair and all, and you can forgive Jets fans for hoping that another Hall of Fame quarterback had come to them out of Tuscaloosa. Todd failed to meet those lofty expectations, of course, but he did lead the NFL in yards per pass attempt in 1979. Three years later, in the strike-shortened 1982 season, a 29-year-old Todd started every game for the Jets and posted the following stat line: [continue reading…]

{ 38 comments }

Tony Galbreath, A Forgotten Record Holder

Galbreath with the Saints

Galbreath with the Saints

Throughout his playing career, Walter Payton was chasing the ghost of Jim Brown.  At the end of the 1981 season, Payton was in 5th place on the career rushing list.  By ’82, he was in 4th; after ’83, he was up to 3rd place. Then, in 1984, Payton passed both Francos Harris and Brown to move into the top spot on the career rushing yards list.

But at the same time that he was chasing a much more flesh-and-blood figure: Saints/Vikings/Giants running back Tony Galbreath. Let’s jump in a time machine back to 1982. At that time, just seven players had at least 75+ career rushing attempts and 375+ career receptions. Three were Hall of Famers Bobby Mitchell, Charley Taylor, and Elroy Hirsch, but all three players made the HOF in large part because of their work as wide receivers. All three players entered professional football as running backs.

Crazy Legs switched after four years (and just one with the Rams) to become a wide receiver on the high-flying Rams of the early ’50s. Taylor was a running back his first two seasons — and a Pro Bowl one at that — but switched positions midway through the 1966 season and remained at wide receiver the rest of his career. Mitchell was stuck behind Brown in Cleveland, but it wasn’t until he was traded to Washington after his fourth season that he become a receiver.

A fourth member of the 75/475 list was Bobby Joe Conrad. who played with the Cardinals in the ’60s. He also switched positions early in his career, and turned into a star receiver almost immediately. As a result, only three true running backs were on the list: Lydell Mitchell, Rickey Young, and Joe Morrison. A star with the Giants in the ’60s, Morrison retired in 1972; he was still the career leader in receptions by a running back a decade later, with 395 receptions. Mitchell, a borderline HOF running back with the Colts, got up to 376 before retiring. Through age 29, he had 355 receptions and had topped 55 catches in each of his last five years; while he would have seemed like a lock to break Morrison’s record, he caught just two more passes the rest of his career.

That leaves Young, a fullback with the Chargers and Vikings. He caught a league-high 88 passes in ’78, and was at 387 receptions as of 1982. He turned 30 in 1983, his final season in the NFL, but caught another 21 passes, breaking Morrison’s record and retiring as the running back catch king, with 408 grabs. But Morrison didn’t retire with an easy stomach: both Payton and Galbreath were hot on his tails.

As of 1983, Payton, who entered the league in 1975, had 328 receptions. But Galbreath was already at 364 receptions, despite entering the NFL a year later. In ’84, Galbreath became just the second pure running back to hit the 400-catch mark; by ’85, Payton had become the third, and Galbreath had supplanted Morrison as the running back catch king. After ’86, Payton had really narrowed the gap: he had 459 career receptions, while Galbreath was at 464. Who would win up as the all-time running back catch king? That left the 1987 season as the battle ground for the highest of stakes: both Payton and Galbreath would retire after the season.

In the season opener, the duo squared off, with all eyes watching the race with a secondary battle between the Giants and Bears taking place. Payton caught three passes, giving him 462 for his career; Galbreath had just one, upping his total to 465.

By November 8th, Payton had closed the gap entirely: both players stood with 475 career receptions. The next week, Payton had a Pyrrhic victory: his Bears lost in Denver, but he became the running back catch king with the first of his three receptions that day (Galbreath had none). [continue reading…]

{ 5 comments }

Jadeveon Clowney Through Two Years

Jadeveon Clowney was one of the most highly-touted non-quarterback prospects in recent draft history. Clowney, in fact, has been a highly-touted prospect for even longer than that: he was the number one recruit in the country for the 2011 class. And, #DisruptionIsProduction aside, Clowney’s now fallen short of sky-high expectations for three years in a row: after an uneven final year in South Carolina, Clowney was limited to just four games as a rookie in 2014. Last year, Clowney started 9 games and played in 13; he recorded 4.5 sacks and had 27 tackles.

Is 2016 the year of the Clowney breakout? It may be: he was a strong run defender last year and has shown flashes of the dominance we saw in college. That said, I thought it would be interesting to compare Clowney to other number one draft picks through two years.  Clowney has played in 17 games through two years; that’s pretty low, as you expect, compared to other first overall picks. [continue reading…]

{ 7 comments }

On average, passing yards is a pretty meaningless measure of quarterback play.  Consider that the winning team and the losing team in a game both generally throw for about the same number of yards. Last year, for example, winning teams averaged 258 gross passing yards per game, while losing teams averaged 259. In 2013, it was 253 for the winners, 251 for the losers. In 2012, it was 246 for the winners, 248 for the losers. Since 2000, winning teams have averaged about 5 more passing yards per game, thanks mostly to 2009 (244 for winning teams, 222 for losing) and 2014 (261/242) as big outliers.

Joe Flacco, for example, has averaged 233 passing yards per game in wins and 231 in losses. But just because the averages are close together doesn’t mean every quarterback follows this same formula. And two of the best examples of that are Nick Foles and Blake Bortles.

Foles has lost 17 games where he was the starting quarterback; in those games, his average stat line was 21/38 for 214 passing yards, 0.7 TDs and 1.1 INTs. He also has started and won 19 games; in those games, his average stat line was 19/30, for 258 passing yards, 2.1 TDs, and 0.4 INTs. That paints the picture of a guy who is much better in wins than losses, which makes a lot of sense.  (Also, 7 of his 17 losses have come during his ugly time with the Rams, compared to just 4 of 19 wins.) [continue reading…]

{ 4 comments }

Smith nearly drops the chip on his shoulder

Smith nearly drops the chip on his shoulder

Measuring receiver play is really tricky, and that’s before you even get to things like supporting cast. But I want to at least put something out there to measure receiver play in the postseason, something that would be an improvement on just looking at the leaders in receiving yards. So here’s what I did. Let’s use two great playoff performances as our examples.

1) Calculate each player’s Adjusted Catch Yards in a game. In a 1974 playoff loss to Pittsburgh, Oakland wide receiver Cliff Branch had a great game. He caught 9 passes for 186 yards and 1 touchdown; giving him 5 yards for every reception and 20 yards for every touchdown, that translates to 251 Adjusted Catch Yards.

In 2012, Calvin Johnson dominated the Saints defenses in the lone playoff game of his career; Johnson finished with a 12/211/2 stat line, worth 311 ACY, tied (with Reggie Wayne against Denver) for the third most ACY in a playoff game since 1960.

2) But we need to account for era, and we should also account for the quality of the opposition. So I looked at every team since 1960, and calculated the ACY allowed to all opposing players in every regular season game. Then, I took the top 16 (or fewer, in non-16 game seasons) performances during the regular season to calculate the average ACY allowed by each defense to the top opposing receiver.

This is a very, very high baseline, of course, but I am trying to measure dominance. If a team allows 80 yards, on average, to the opposing WR1, then an 80-yard playoff performance shouldn’t stand out as special.

The 2011 Saints allowed an average of 155 ACY to the top 16 players it faced that year. As a result, Johnson gets credit for 156 ACY over expectation. The 1974 Steelers? Well, they allowed just 94 ACY to the top 14 players it faced during the regular season. That gives Branch 157 ACY over expectation.

So Branch slightly beats Megatron using this formula, as gaining 251 ACY against a defense that usually allows 94 is seen as a hair better than gaining 311 against a defense that usually allows 156. Is this formula perfect? Of course not, but it’s a start. Branch’s game checks in as the 8th best since 1960, while Johnson’s is 10th. The top game? That honor belongs to Steve Smith, naturally. [continue reading…]

{ 23 comments }

Brad Oremland is a longtime commenter and a fellow football historian. Brad is also a senior NFL writer at Sports Central. He’s also a semi-regular writer here, and you can view all of Brad’s Football Perspective writing at this page. Brad is working on a WR Project where he analyzes the best WRs over various ten year periods. That work is being produced over at Sports-Central, but Brad has offered to have it reproduced here as well. As always, we at the FP community thank him for his work.

Previous Best WRs By Decade Articles:


Last year, I wrote an article breaking down the best quarterbacks by decade, followed by in-depth profiles of the greatest QBs in history. This year, I combined those two themes in a look at the best wide receivers ever, broken into decades. [continue reading…]

{ 39 comments }

Brad Oremland is a longtime commenter and a fellow football historian. Brad is also a senior NFL writer at Sports Central. He’s also a semi-regular writer here, and you can view all of Brad’s Football Perspective writing at this page. Brad is working on a WR Project where he analyzes the best WRs over various ten year periods. That work is being produced over at Sports-Central, but Brad has offered to have it reproduced here as well. As always, we at the FP community thank him for his work.

Previous Best WRs By Decade Articles:


Last year, I wrote an article breaking down the best quarterbacks by decade, followed by in-depth profiles of the greatest QBs in history. This year, I’m combining those two themes in a look at the best wide receivers ever, broken into decades. Because careers don’t always fit cleanly into a single decade, I’ve gone in five-year increments. Last week, we covered 1990-99 and 1995-2004. This is the seventh installment, examining 2000-09 and 2005-2014. The great receivers of the early ’00s, such as Marvin Harrison and Isaac Bruce, were in last week’s column. [continue reading…]

{ 63 comments }

The 1978 Patriots, Part II

The 2001 Rams had Kurt Warner, Marshall Faulk, Isaac Bruce, and Torry Holt.

The ’92 and ’93 49ers have prime Steve Young and prime Jerry Rice, along with the first two years of Ricky Watters’ great career.

The ’88 Bengals had MVP Boomer Esiason, Pro Bowler Eddie Brown, HOFer Anthony Munoz and Pro Bowler Max Montoya on the offensive line, and a running back tandem of James Brooks and Ickey Woods. Two years earlier, the ’86 Bengals had those players save Woods, but also had Cris Collinsworth in the prime of his career.

The ’51 Rams had Norm Van Brocklin and Bob Waterfield — two HOFers — at quarterback, along with Elroy Hirsch, Dan Towler, Dick Hoerner, and Tom Fears.

Those are 6 of the 7 teams since 1950 to lead the NFL in both average yards per rush and average yards per pass. Can you guess the 7th team? You have three guesses, but the first two don’t count. [continue reading…]

{ 15 comments }

The 1978 Patriots, Part I

Here’s what I wrote in my first post at Football Perspective:

I’ll be blogging about everything football-related, from Jerry Rice to Bobby Douglass, and from the 1978 Patriots to who is the greatest quarterback of all time.

The New England Patriots rushed for 3,165 yards, an NFL record that still stands. Take a look at the individual players on that team:

Games Rushing
No. Age Pos G GS Att Yds ▾ TD Lng Y/A Y/G A/G Fmb
39 Sam Cunningham* 28 FB 16 14 199 768 8 52 3.9 48.0 12.4 4
23 Horace Ivory 24 rb 15 3 141 693 11 28 4.9 46.2 9.4 5
32 Andy Johnson 26 RB 15 13 147 675 3 52 4.6 45.0 9.8 4
14 Steve Grogan 25 QB 16 16 81 539 5 31 6.7 33.7 5.1 9
44 Don Calhoun 26 rb 14 2 76 391 1 73 5.1 27.9 5.4 1
37 James McAlister 27 16 0 19 77 2 16 4.1 4.8 1.2 3
86 Stanley Morgan 23 PR/WR 16 16 2 11 0 6 5.5 0.7 0.1 6
29 Harold Jackson 32 WR 16 13 1 7 0 7 7.0 0.4 0.1 0
30 Mosi Tatupu 23 16 0 3 6 0 3 2.0 0.4 0.2 0
4 Jerrel Wilson 37 P 14 0 1 0 0 0 0.0 0.0 0.1 1
83 Don Westbrook 25 16 0 1 -2 0 -2 -2.0 -0.1 0.1 0
Team Total 26.2 16 671 3165 30 73 4.7 197.8 41.9 35

[continue reading…]

{ 6 comments }
Next Posts Previous Posts