≡ Menu

Boxscore vs. PFF: Era in Review

Adam Steele is back with more analysis of traditional box score stats versus Pro Football Focus’s big time throw and turnover-worthy play metrics. And we thank him for it.


A couple of weeks ago, I compared TD/INT and BTT/TWP numbers for the 2021 season. Today we’ll be looking at the entire Pro Football Focus era going back to 2006.

Before compiling the data, I hypothesized that TD/INT and BTT/TWP would track in relative lockstep, though perhaps the upward slope of the PFF metrics would be less severe. That turns out to be true for 2006-07 and 2014-21, but oh boy was there some wackiness taking place in between. In the graph below, you’ll see league TD-INT difference in blue and league BTT-TWP difference in red: [continue reading…]

{ 1 comment }

Guest Post: Improving on TD:INT Ratio

Adam Steele is back with the crazy notion that we should stop using stochastic, binary events in ratio form as the basis for judging quarterbacks. Fancy that. We thank Adam for his ideas and analysis.


The most commonly cited quarterback stats in mainstream analysis are touchdown passes and interceptions, usually presented as TD/INT ratio. This essentially functions as shorthand to compare the quantity of a player’s great plays against his terrible plays. But this is quite unfortunate since both stats are very noisy and situation dependent. TD/INT ratio not only lacks important information but it can be downright misleading at times.

Luckily for us the good folks at Pro Football Focus have come up with a much better alternative: Big Time Throws (BTT) and Turnover Worthy Plays (TWP). These stats are tabulated by watching film so they capture far more signal than the process-blind box score numbers. Passers get credited with a BTT when they make a throw that goes well beyond what’s expected on a given play, and this includes passes which are dropped or wiped out by penalty. Meanwhile a TWP is charged when a throw is made that has a good chance of being intercepted (whether it’s actually picked or not), or when the QB gets careless with the ball during his dropback and fumbles when such an error could’ve been avoided. [continue reading…]

{ 3 comments }

The penultimate week of the season was an odd one from a statistical standpoint. QBR and PFF mostly agreed (for once), but some of the boxscores straight up lied to us about how well quarterbacks played. We saw 45 touchdown passes and 32 QB turnovers, and that’s standard fare for a late season week in today’s NFL. However, according to PFF graders, quarterbacks registered 36 big time throws and a whopping 55 turnover worthy plays!

Let’s look at the week 17 rankings then take a closer look at some of these misleading statlines: [continue reading…]

{ 0 comments }

I’m short on time right now so this week’s QB rankings will be presented without commentary. [continue reading…]

{ 0 comments }

Adam Steele is back to give us his thoughts on this week’s quarterbacks. It’s been fun to follow his progression from hopeful fan to ranting madman over the course of just fifteen weeks.


This is starting to sound like a broken record but we just witnessed yet another week of terrible quarterbacking. Only 9 of 32 qualifiers even cracked a QBR of 50! We can’t even blame this on backup QB’s dragging down the average as the bottom 10 were all regular starters aside from Mike Glennon. If anything, the backups outperformed the starters with Tyler Huntley taking the week 15 crown and Nick Mullens placing eighth. [continue reading…]

{ 0 comments }

Adam Steele is back with another quarterback recap. He has a broken arm and a detached retina, and he’s ready to win it.


This may have been the least interesting week of the 2021 season for overall game quality (favorites were 12-2 with some totally noncompetitive matchups), but it was still a fascinating slate for analyzing quarterback performance. [continue reading…]

{ 0 comments }

As has been the case for nearly two months now, the steady decline of NFL offenses continued in week 13. Scoring has dropped from 24.8 points per game last year to 22.9 this year. The league is currently averaging 11.0 yards per completion; if this holds it will be the lowest in NFL history. There’s also been a marked shift in touchdown passes vs. interceptions. Early in the season there were 3.5 TD passes for every INT; that ratio is now below 2 to 1. For the first time in several years the NFL has found a nice equilibrium between offense and defense. It’ll be interesting to see if the competition committee devises rule changes to boost offense again in 2022.

Here are the week 13 rankings: [continue reading…]

{ 0 comments }

This week I’m excited to introduce a new data set into my quarterback rankings, courtesy of Pro Football Focus. I’d like to give a helmet knock to our good buddy Bryan Frye for working out some details behind the scenes to make this possible. [1]Note from Bryan: all I did was ask.

From this point forward, I will be using two metrics to rate quarterbacks: QBR and PFF offensive grades. This makes me giddy because both systems attempt to isolate the QB’s contribution from that of his teammates. That’s a significant step up from ANY/A, DYAR, and EPA which simply assign team offensive statistics to the QB taking the snaps. I can live with that for historical comparisons where we don’t have anything better, but in today’s world of robust data there’s no reason to settle for such a high degree of entanglement.

As neither QBR nor PFF grades account for workload, I needed to make an adjustment to prevent low usage QB’s from hogging the top of the rankings. After experimenting with a few ideas I settled on adding a z-score for play count (based on qualifiers only) and giving it half weight compared to the z-scores for the two metrics. It’s not perfect but it gets the job done without too many arbitrary decisions.

Let’s see how the new system looks for week 12: [continue reading…]

References

References
1 Note from Bryan: all I did was ask.
{ 0 comments }

Adam Steele is back, and he’s eschewing the expository fluff (which I am re-adding, right here). Enjoy, friends.


Here are this week’s quarterback rankings: [continue reading…]

{ 0 comments }

As with the rest of these recaps, the ideas and analysis presented here are from Adam Steele. I’m just a dunce with admin rights.


We’ve seen a steady decline in quarterback play across the last month, and this week hit a new low. The unweighted average QBR for week ten qualifiers was a dismal 44.7. That would have ranked 27th in the league last year! This isn’t a surprise as offense tends to decline in the second half of every season as defenses jell and the weather starts to make an impact.

Here are this week’s numbers: [continue reading…]

{ 0 comments }

Adam Steele is back, continuing to refine his methods in real time, and we get to benefit from it. Thank you Adam, for working it out publicly.


After tabulating the numbers for week nine I realized I needed to make one more tweak to the formula. Since EPA per play and QBR are both agnostic to volume, QB games with a low number of plays were disproportionately clustered at the top and bottom of the rankings. Obviously it’s harder to maintain an extreme performance over a larger sample than a smaller one. My solution was to regress EPA/P by adding 20 plays of 0.1 EPA (roughly league average) to everyone’s stat line before calculating their z-scores. This fix strikes a nice balance between efficiency and volume.

Onto this week results: [continue reading…]

{ 0 comments }

Adam Steele is back with a brand new convention, and we thank him for keeping the site humming.


With the NFL trade deadline taking place this week, I decided to make a trade of my own. I’m ditching DYAR in favor of EPA per play. After Davis Mills placed seventh in DYAR by turning into Dan Marino down 38-0, I knew I had to switch to a metric that filters out garbage time.

Thanks to Ben Baldwin and his nifty site rbsdm.com, it’s easy to query EPA/P with various amounts of garbage time removed. After some experimentation I settled on a 4% filter; plays which occur when win probability is below 4% or above 96% are thrown out. The vast majority of plays are still counted but nonsense like the Davis Mills experience is rightfully ignored. To wit, Mills drops from -.149 to -.474 EPA/P with this filter applied.

Here are the week eight numbers: [continue reading…]

{ 0 comments }

Guys, gals, and nonbinary pals, Adam Steele is back with his quarterback recap. And we thank him for it.


I’m going to keep the commentary short and sweet today, so here are the week seven rankings: [continue reading…]

{ 0 comments }

After offenses lit up the scoreboard in week five, we were treated to the poorest quarterbacking of the year in week six. Both DYAR and QBR hit their low points in the 2021 season. What’s shocking is that this happened with the Jets on their bye week!
[continue reading…]

{ 0 comments }

Finally, a week in which the best QB games were more extreme than the worst. The league saw DYAR and ANY/A reach their high points for any week in 2021. Oddly, this was the second worst week for QBR despite the meteoric conventional stats. There seemed to be an unusual number of highlight reel catches and long completions on busted coverages, both of which are likely discounted in QBR.

Fittingly, old man Brady tops the chart in the same week he became the all time leader in total DYAR. Brady and Lamar Jackson had the two best games of the year according to DYAR but fared much worse in QBR. In Brady’s case it’s likely because he faced almost zero pressure vs Miami, while Jackson gets taken to the woodshed for his goal line fumble (another example of QBR overweighting running plays).

Josh Allen had the opposite result – dominant in QBR but merely good in DYAR. He was very successful on his runs, completed his average pass a whopping 13 yards downfield, and didn’t have enough plays to pump up his counting stats. [continue reading…]

{ 0 comments }

With it being the (almost) quarter point of the 2021 season, I’m going to skip commentary on the week four games and focus on quarterback performance across the first month of the season. [continue reading…]

{ 0 comments }

Adam Steele is back with his quarterback recap for week 3, 2021. Thank you, Adam, you beautiful man.


The theme of week three is the same as week two: terrible rookies. Remarkably, the eleven worst QB games this season have all been more extreme than the single best game. Anyone reading this is well aware of Justin Fields‘ spectacularly awful sack-fest performance against Cleveland. But according to DYAR, that wasn’t even the worst game this week!

Here are the week three numbers: [continue reading…]

{ 0 comments }

The following post attributes authorship to Bryan Frye, but everything under the line comes from the mind of Adam Steele. We thank him for his contributions to the site and to football discussion.


For the second week in a row, the worst quarterbacks had more extreme performances than did the best. By absolute value, the eight worst games this season have been more extreme than the single best game. I don’t have a good explanation for this other than sheer randomness. [continue reading…]

{ 0 comments }

The following post attributes authorship to Bryan Frye, but everything under the line comes from the mind of Adam Steele. We thank him for his contributions to the site and to football discussion.


With Chase being such a busy man, I have taken over posting weekly passing reviews during the 2021 season. While the classic ANY/A formula has served its purpose over the years, I’m going to tap into a couple of more advanced metrics to rank quarterbacks on a weekly basis.

Each week, qualifying QB’s will be scored using Football Outsiders’ DYAR and ESPN’s QBR metrics. I think this will give us a nice balance between play-by-play and charting stats, as well as a balance between counting stats and pure efficiency. The qualifying players will have their z-score calculated for DYAR and QBR then averaged to create their overall score.

Here are the week 1 results: [continue reading…]

{ 0 comments }

History of the Career Passing Yards Record

This is an update and revision to a post I wrote after Peyton Manning’s retirement following the 2015 season. I originally penned it to celebrate Manning’s triumph over the record books and look back at the history of the record. Since then, Drew Brees and Tom Brady have broken that record, and both look to push it to new heights as they battle for the crown. Brees beat Brady to the mark and hasn’t looked back yet. The Saint has a history of beating the odds. He has been lauded by an adoring media and legions of fans, and deservedly so. However, with all the attention given to modern players, we often fail to properly remember former greats – legends of the game who paved the way for the sports celebrities of today.

More than relics from days past, these men were trailblazers who helped legitimize the sport we have grown to love. Unlike the iconic sports figures of today, many of these players were actual heroes, serving in the military and coming home to work full-time jobs to support their families. Before quarterbacks were millionaires, they were mostly indistinguishable from the everyman. Except on Sundays. On Sundays, they became giants. [continue reading…]

{ 1 comment }

In general, more passing yards should be better than fewer passing yards. But we know that due to Game Script, teams that are trailing late in games throw much more frequently — and can rack up the passing yards — than teams with a lead.

So, if you know nothing else other than that a team threw for more passing yards than its opponent, would you guess that team won or lost?

And how would you guess that answer would change over time?

For the first question, let’s look at 2019. Last season, the team that threw for more gross passing yards went 136-119-1, so that’s a small but clear edge for the team that threw for more passing yards.  In the graph below, I’ve shown the number of passing yards by each winning team (in blue) and its opponent (in orange) in each game.  The X-Axis shows the difference between the passing yards for the winning team and the passing yards for the losing team. There are a few more dots to the right side of the graph than the left, which is because the winning team more often than not threw for more yards.  This is a fun graph, because it also lets you see how many games are in each category based on the size of the difference.

[continue reading…]

{ 1 comment }

Why Have Passer Ratings Become More Compressed?

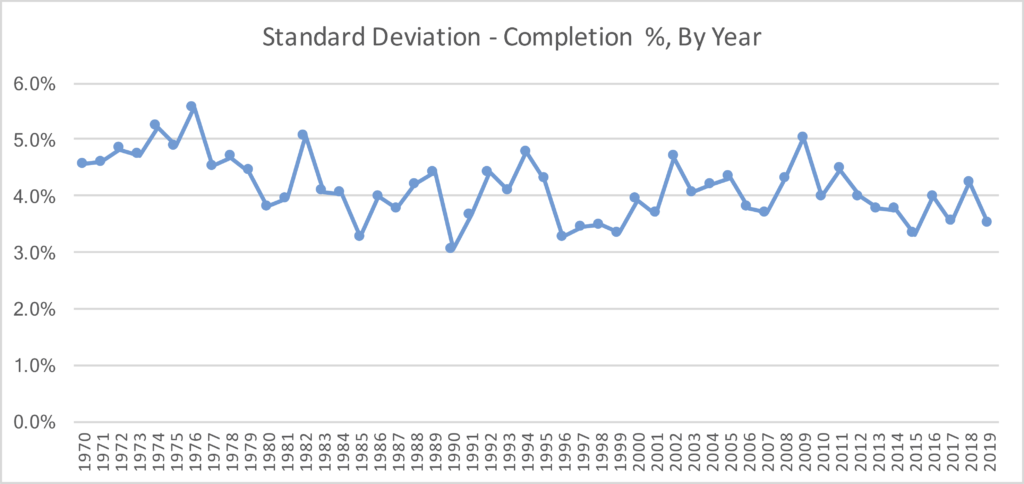
Yesterday, I wrote that the range of passer ratings is getting smaller.  Today, let’s investigate why.  As you know, passer rating is made up of four variables: completion percentage, yards per attempt, touchdown rate, and interception rate.

For each of the four variables, I calculated the standard deviation in that metric for all of the teams in the league in that season.  Last year, for example, the standard deviation in completion percentage was about 3.5%.  That’s on the low end historically, although not the absolute lowest mark.  But in general, it’s fair to say that the league-wide completion percentages are getting more compressed.  Last season, the Saints completed 72% of the team’s passes, and the Bengals were last at 58%. But in 1976, the Raiders were at 64%, while the Bills were at 41%.  That In 1994, the 49ers were a big outlier as they completed 70% of their passes at a time when two teams (Washington, Houston) completed just under 50% of their passes.

With a much higher floor now — the league average completion percentage was 58% in 1994, the same as what the 32nd-ranked Bengals did in 2019 — completion percentages as a whole are simply more compressed.

When it comes to yards per attempt, there isn’t much of a trend.  The variation was a bit higher in the ’70s, but over the last 40 years, the standard deviation is around 0.7 yards per attempt each season.

[continue reading…]

{ 0 comments }

The Range Of Passer Ratings Is Getting Smaller

In 1988, the passer rating for the entire NFL was 72.9. In 2019, every single team had a passer rating higher than that mark! Last season, the Carolina Panthers finished with a 74.7 passer rating, which was both the lowest in the 2019 NFL season and also the highest mark in history by a team that ranked last in that statistic.

This is part of two general trends: passer ratings are going up, but also, the variance in passer ratings is declining. [continue reading…]

{ 0 comments }

2019 Era-Adjusted Passer Ratings

In what is becoming a yearly tradition, today I am going to post the era-adjusted passer ratings from the 2019 season.

Passer rating is made up of four variables: completion percentage, yards per attempt, touchdown percentage, and interception percentage. The reason passer rating needs to be adjusted for era? Well, that’s pretty simple to explain.

When the formula was derived in the early ’70s, an average rating in each variable was achieved with a 50% completion rate, averaging 7.0 yards per pass attempt, a 5% touchdown rate, and a 5.5% interception rate. Since those numbers are wildly out of date, I came up with a formula that perfectly matches the intent of passer rating but ties the variables to the league average in any given season. You can get the formulas and read more background in the linked posts.

In 2019, the four averages were 63.5%, 7.22, 4.46%, and 2.30%, respectively. The big changes, of course, are in completion percentage and interception rate; yards per attempt is much more stable throughout history, while touchdown rate is actually slightly lower than it was in the ’70s.

One thing to keep in mind: these adjustments will not change the order of passer ratings in a given season. So Ryan Tannehill, Drew Brees, Lamar Jackson, Kirk Cousins, and Russell Wilson will remain your top 5 leaders; the way the formula works, it simply subtracts a fixed amount from each passer’s actual passer rating. In 2019, that amount was a whopping 23.7 points from each passer.

Below are the 2019 passer ratings: [continue reading…]

{ 0 comments }

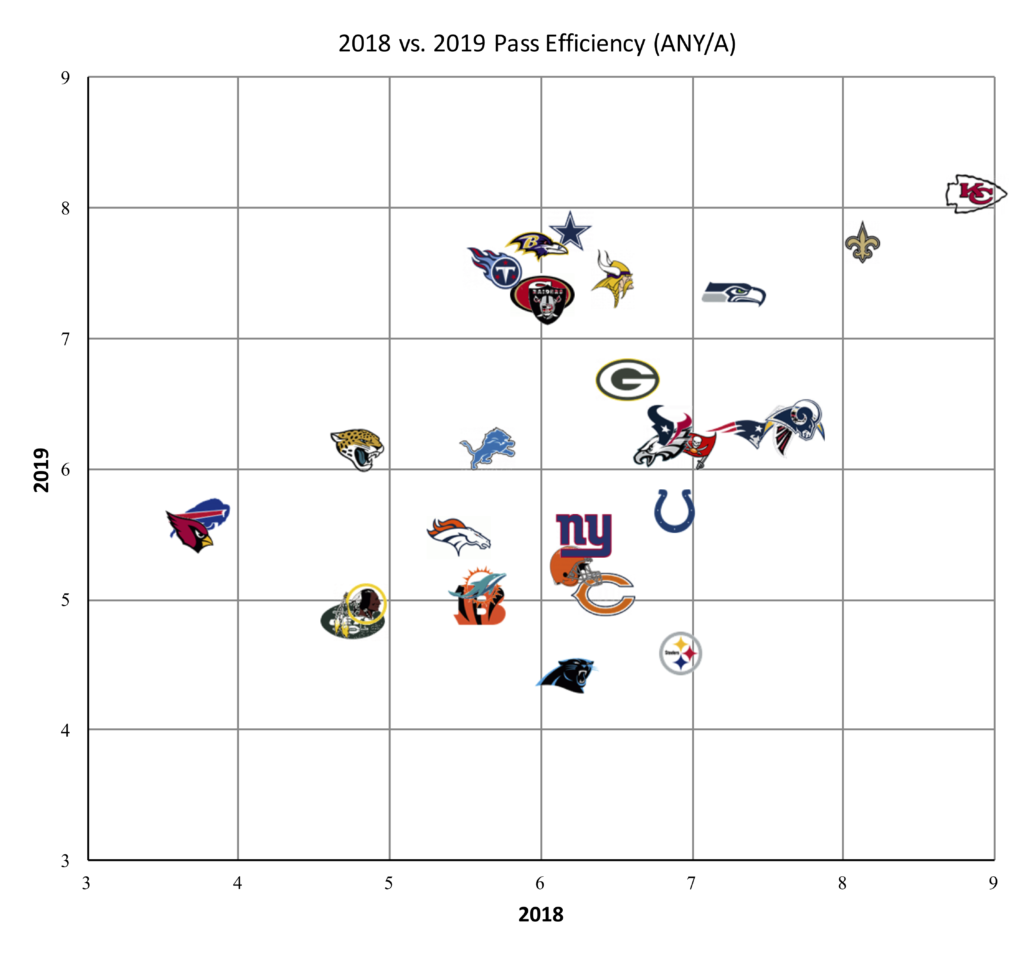
The 2014 season marked a new era of passing efficiency. And since the 2014 season, the passing game has remained extremely efficient. However, there were a lot of quarterback injuries in 2019: we spent most or all of the season without Andrew Luck, Ben Roethlisberger, Cam Newton, and Alex Smith; as a result, pass efficiency, as measured by Adjusted Net Yards per Attempt, was slightly down in 2018 compared to 2019.

The graph below shows each team’s ANY/A in 2018 (X-Axis) and 2019 (Y-Axis).

[continue reading…]

{ 2 comments }

How much did passing efficiency decline in 2019 compared to a record-setting 2018? That depends, a bit, on how you measure passing efficiency — in more ways than one.

In 2018, all NFL passers combined to average 6.32 Adjusted Net Yards per Attempt. In 2019, all NFL passers combined to average 6.16 ANY/A, a decline of 2.6%. However, there is another way to measure league average, and that’s by taking an average of the average ANY/A stats for each of the 32 teams.

In 2019, while “the NFL” as a whole had a 6.16 ANY/A average, an average of each of the ANY/A rates for the 32 teams comes to 6.19. If that is confusing to you, think of it this way: when we calculate “the league average” in passing stats, we are giving more weight to the Bucs, Panthers, and Falcons than to the Ravens, Titans, and Vikings. Collectively, those three NFC South teams were responsible for 11.0% of all passing plays in 2019; meanwhile, pass plays from Baltimore, Tennessee, and Minnesota account for only 7.7% of NFL passing plays.

When we think of league average, we almost always mean a weighted average that gives more weight to the teams that pass most frequently. But there’s at least an argument to be made that league average would be better defined by taking an average of the averages. And in this case, in 2019, it would mean a higher average: that’s because the wrong passers threw it more often in 2019.

Last year, the right passers threw it more often: an average of the ANY/A produced by each of the 32 teams was 6.29 (which was lower than the normal average of 6.32, since the weaker passing teams threw less frequently last year). By this measure, passing efficiency declined only 1.6% — from 6.29 to 6.19 — from 2018 to 2019, rather than by 2.6%.

Let’s look at each team in 2019. The X-Axis shows the number of dropbacks: the NFC South teams (other than the Saints) are on the far right, because they passed the most. The Y-Axis shows pass efficiency, as measured by ANY/A.

It’s pretty clear that the “wrong teams” passed most often in 2019; the chart has a slope that is down and to the right. This, of course, is why the “NFL ANY/A” was 6.16 but the “average of the ANY/A for the 32 teams” was 6.19; by giving the Ravens and Titans equal weight to the Bucs and Panthers, you raise the average.

You might think this is how things always are: after all, the whole point behind my Game Scripts work is that teams with the lead pass less often, and trailing teams pass more often. But of course we already discussed that last year, the reverse was true: the right teams passed more often. In fact, there isn’t much of a trend in recent years as to whether or not the better passing teams are more likely or less likely to pass more often.

This final graph is a little wonky, but here goes. It shows the league average ANY/A in each season calculated the normal way minus the average of the ANY/A for all of the teams. So in 2019, you get a negative number (6.16 – 6.19 is -0.03); in 2018, it’s positive. Any time the graph is above 0, it means that the right teams are passing more often. Any time it’s below zero — as in 2019 — it means the wrong teams are passing more often.

What do you think?

{ 0 comments }

Patrick Mahomes, Russell Wilson, Lamar Jackson, Dak Prescott, and Deshaun Watson are all having great years, and all five players are in the running for the 2019 MVP award. Right now, Mahomes has been the most efficient of the group, but the story of the 2019 season isn’t about great passing offenses…. but the fact that great passing offenses aren’t the story of the 2019 season. (As an aside, Kirk Cousins and Minnesota are quietly number two in ANY/A this season).

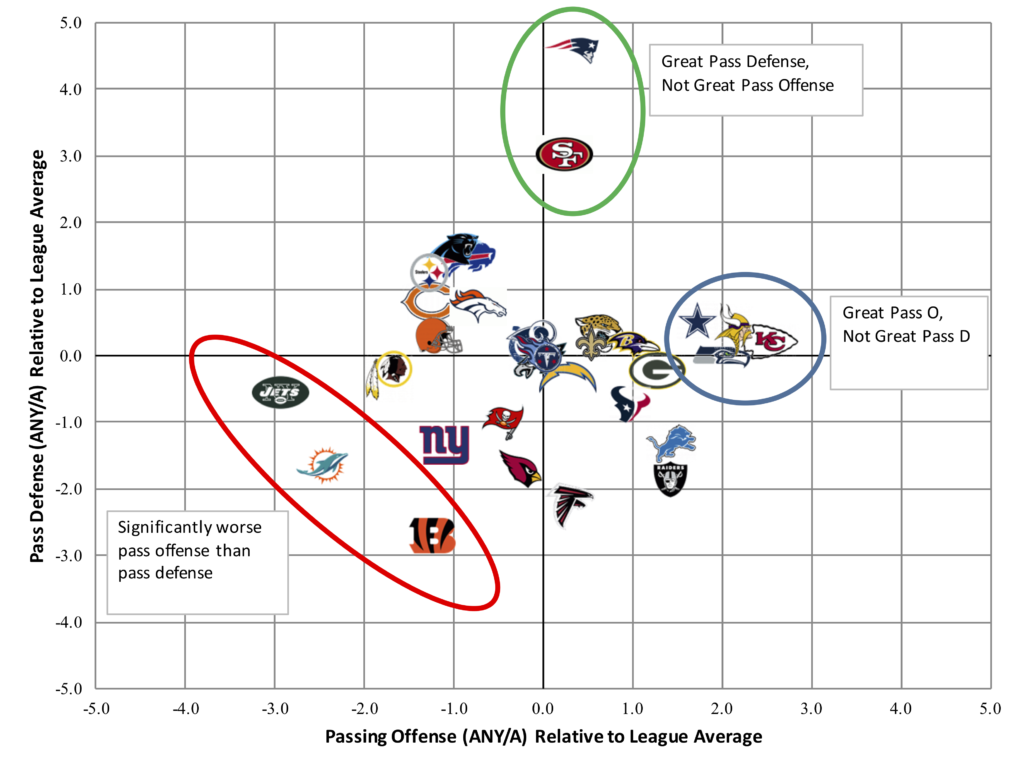
The best passing offense, in terms of Adjusted Net Yards per Attempt, belongs to the Chiefs. So far this season, Kansas City is averaging 8.81 ANY/A, and the league as a whole is averaging 6.27 ANY/A.   So the Chiefs are averaging 2.54 ANY/A more than the average team this year.  That’s great, but what is noteworthy is that it is NOT that noteworthy this year.

The Jets passing offense is more extreme than the Chiefs passing offense.  New York is averaging an anemic 3.34 ANY/A this season, which means the Jets Relative ANY/A on offense is -2.93.  So we could say that the Jets passing offense is the most extreme this season of the 32 passing offenses.

But guess what: opponents facing the Bengals are also more extreme than Chiefs!  So far this season, Cincinnati is allowing a remarkable 8.99 ANY/A to opposing quarterbacks, which means [Insert Bengals Opponent] has been better at passing this year than Kansas City.  At -2.72 ANY/A, the Bengals pass defense is truly awful.

But wait, there’s more.  The Patriots pass defense is even more extreme than the Bengals pass defense. New England is allowing just 1.70 ANY/A this season, which is +4.57 ANY/A better than average!

The graph below shows how each team ranks in both offensive ANY/A (X-Axis) and defensive ANY/A (Y-Axis) relative to league average.  The best teams would be up and to the right, but that’s a generally empty box.  The worst teams are down and to the left, and we do have three teams there.

So while the passing attacks in Kansas City et al. are having great years, they aren’t more extreme than the Jets pass offense, the Bengals pass defense, or the Patriots pass defense.  And that is pretty unusual.  I went and calculated the best and worst passing offenses and defenses, as measured by Relative ANY/A, in each year since 1970.  Usually, extreme offenses are the biggest outliers, and in the positive direction.  In 22 of those seasons, the most extreme unit was the best passing offense; in 13 years, the worst passing offense was the most extreme.  The other 14 years were split evenly between the best and worst passing defenses. Take a look: [continue reading…]

{ 0 comments }

Matthew Stafford is Throwing It Down The Field Again

In 2016, Matthew Stafford averaged just 5.8 air yards per attempt on completed passes.

In 2017, Stafford averaged 6.0 air yards per attempt on completions.

In 2018, the Lions franchise quarterback averaged an anemic 4.8 AYpAoCP.

But this season, through six weeks, Stafford leads the NFL in AYpAoCP, posting a whopping 8.1 average.

There are 23 quarterbacks who threw at least 100 passes last season and, as of today, have thrown at least 100 passes so far this season. This includes Joe Flacco (Baltimore in 2018, Denver in 2019), Case Keenum (Denver, Washington), and Josh Rosen (Arizona, Miami). The graph below shows the Air Yards per Attempt on Completed Passes for all 23 quarterbacks in both 2018 (X-Axis) and 2019 (Y-Axis). The NFL logo represents the quarterback on his 2019 team. Jameis Winston, unsurprisingly, stands out here: he ranks second in this metric in both seasons. Also unsurprising is Derek Carr ranking very low in both years. But Stafford (and Dak Prescott) stand out as big movers: [continue reading…]

{ 0 comments }

When Does ANY/A Get It Wrong? By Adam Steele

Adam Steele is back for another guest post. You can view all of Adam’s posts here. As always, we thank him for contributing.


When Does ANY/A Get It Wrong?

In Chase’s review of week one passing stats, I commented that the league’s passing efficiency was inflated by ANY/A in comparison to expected points added (EPA). Today’s post takes a deeper dive into the discrepancy between ANY/A and EPA and which quarterbacks look better in each metric.

While ANY/A is a good metric for quick and dirty analysis, it ignores a number of important variables for accurately measuring a quarterback’s passing efficiency. These variables include: first downs, failed completions, air yard / YAC splits, dropped passes, fumbles, the context of interceptions, and garbage time adjustments. My metric of choice to solve these issues is ESPN’s model of expected points (the primary component of Total QBR). I prefer ESPN’s version in particular because it attempts to isolate the quarterback’s share of credit for every play; the EPA numbers found at Pro Football Reference and Advanced Football Analytics hold the quarterback fully responsible for his team’s pass plays, which, in my opinion, is not much better than just using ANY/A.

In order to compare EPA to ANY/A, I divided pass EPA by dropbacks then converted EPA/A into an index stat using the same formula for ANY/A+. For those not familiar, index stats are scaled so a score of 100 is average and 15 points represents one standard deviation above or below that average. EPA data goes back to 2006 which gives us 439 qualifying seasons to compare. As you would suspect, these two variables are closely correlated (R^2 of 0.74) in the aggregate, but there will be many individual outliers. In the graph below, the X-Axis shows the ANY/A+ for each quarterback, while the Y-Axis shows the EPA/Attempt+ for that quarterback. [continue reading…]

{ 0 comments }

There were 14 NFL teams back in 1962, and the starting quarterbacks for 11 of them averaged more yards per pass attempt than the starting quarterbacks for those same teams did in 2018. We learned that in Part I of this series.  Today, in Part II, we will look at the evolution of passing efficiency in the NFL since 1940.

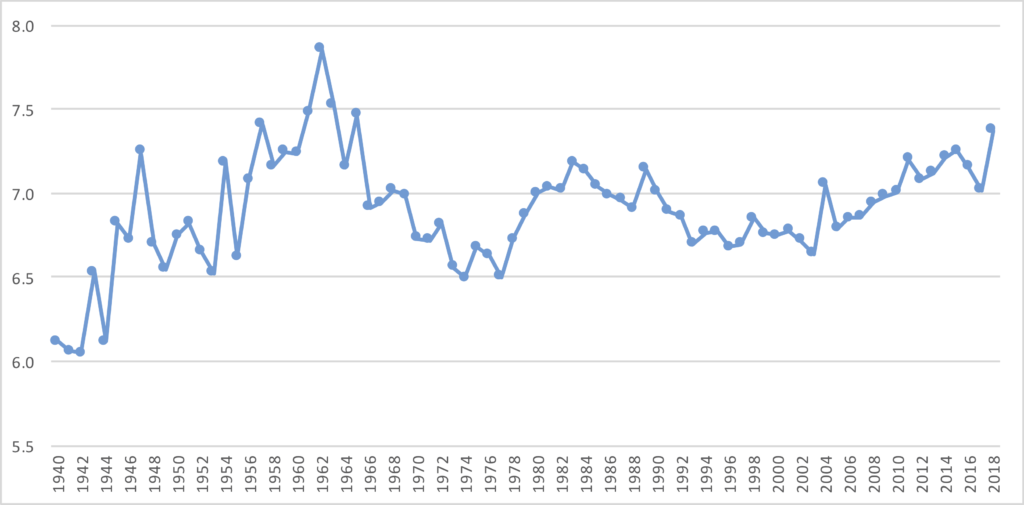
In 1962, the league as a whole averaged 7.9 yards per pass attempt.  That’s a remarkable figure.  So remarkable that it remains the record and is unlikely to be broken anytime soon.  The graph below shows the NFL yards per attempt average in each season from 1940 to 2018.

It doesn’t take a long examination to see that the 1962 season is a significant outlier.  So what caused this?  It helps to begin by breaking down yards per attempt into two components: Completions per Attempt and Yards per Completion; the product of these two statistics is, of course, yards per attempt.

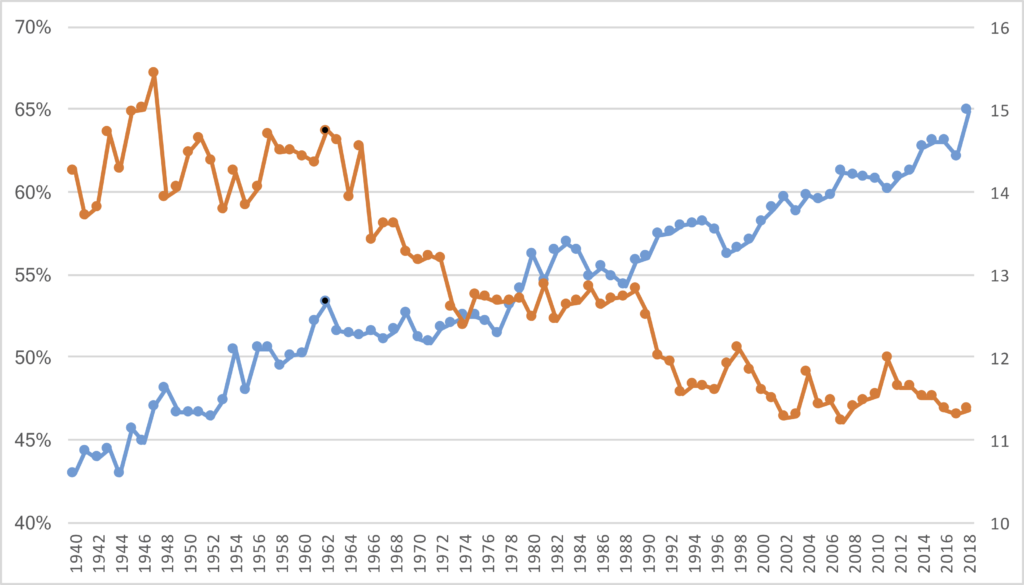
Over the last 80 years, completion percentages have been rising. This is well known, but less discussed is that the average gain on those completed passes — the statistic known as yards per completion — has been steadily falling.   The graph below shows the NFL average completion percentage in blue and marked against the Left Y-Axis, and NFL  yards per completion average in orange marked against the Right Y-Axis, for each year from 1940 to 2018.  The graph forms a jagged X: yards per completion starts up and to the left and ends down and to the right, with completion percentage beginning in the lower left quadrant and ending on the upper right quadrant.

To make it easier for you to see, I shaded the 1962 season in black dots on both lines.  There was a large jump in completion percentage in 1962 — in fact, ’62 set the new record for completion percentage in a season at 53%, and that mark wasn’t broken until 1979!  On the other hand, this wasn’t shocking for the era: after all, 1961 also set a new record for completion percentage.  The 53% rate was notably high and a bit of an outlier, but part of a (still) growing trend towards higher completion percentages year over year.

On the other hand, the 1962 season also represented a reversal of the trend in terms of yards per completion.  Teams gained 14.74 yards per completed pass, the 4th-highest since 1940 both at the time and since.  And the three higher seasons all had come well over a decade earlier, so this was a true change in the tides.  Not only were teams completing more passes than ever, but they were doing so at a rate similar to what happened prior to 1950.

Of course, simple math tells us that if you have an extraordinarily high (for that era) completion percentage combined with an extraordinarily high yards per completion average, that you will wind up with a record-setting yards per attempt average.  And that’s exactly what happened.  The early 1960s were somewhat of an inflection point in this regard: the top three yards per attempt seasons in NFL history were in 1961, 1962, and 1963!  And the 4th-best mark came in 1965.

In the early part of the ’60s, while the AFL was earning a reputation for being a pass-happy league, the NFL was quietly enjoying its most pass efficient seasons in history.  And to be clear, all data in this post is NFL-only.  But even among this era of rising completion percentages and still-high YPC averages, the ’62 season stands alone.  If 1962 didn’t exist, we’d talk about how 1961 and 1963 were remarkably high yards/attempt seasons, but 1962 easily eclipses both of those marks.

Finally, here is the data from every year since 1940, presented in table form.

So what caused all of this? Stay tuned for Part III.

{ 0 comments }
Previous Posts